an author's
https://oatao.univ-toulouse.fr/21595
https://doi.org/10.1016/j.ijhcs.2018.12.010
Causse, Mickaël and Lancelot, François and Maillant, Jordan and Behrend, Julia and Cousy, Mathieu and Schneider,
Nicolas Encoding decisions and expertise in the operator's eyes: Using eye-tracking as input for system adaptation.
(2019) International Journal of Human-Computer Studies, 125. 55-65. ISSN 10715819
Encoding decisions and expertise in the operator's eyes: Using eye-tracking
as input for system adaptation
Mickaël Causse
a,⁎, François Lancelot
a,b, Jordan Maillant
a, Julia Behrend
c, Mathieu Cousy
d,
Nicolas Schneider
baISAE-SUPAERO, Université de Toulouse, France bAirbus Group Innovations, Toulouse, France
cLaboratoire de neurosciences cognitives, Département d’études cognitives, École normale supérieure, INSERM, PSL Research University, 75005 Paris, France dENAC, University of Toulouse, France
Keywords: Eye-tracking Human factors Decision-making Air Traffic Control Adaptive system Machine learning Case-Based Reasoning
A B S T R A C T
We investigated the possibility of developing a decision support system (DSS) that integrates eye-fixation measurements to better adapt its suggestions. Indeed, eye fixation give insight into human decision-making: Individuals tend to pay more attention to key information in line with their upcoming selection. Thus, eye-fixation measures can help the DSS to better capture the context that determines user decisions. Twenty-two participants performed a simplified Air Traffic Control (ATC) simulation in which they had to decide to accept or to modify route suggestions according to specific parameter values displayed on the screen. Decisions and fixation times on each parameter were recorded. The user fixation times were used by an algorithm to estimate the utility of each parameter for its decision. Immediately after this training phase, the algorithm generated new route suggestions under two conditions: 1) Taking into account the participant's decisions, 2) Taking into ac-count the participant's decisions plus their visual behavior using the measurements of dwell times on displayed parameters. Results showed that system suggestions were more accurate than the base system when taking into account the participant's decisions, and even more accurate using their dwell times. Capturing the crucial in-formation for the decision using the eye tracker accelerated the DSS learning phase, and thus helped to further enhance the accuracy of consecutive suggestions. Moreover, exploratory eye-tracking analysis reflected two different stages of the decision-making process, with longer dwell times on relevant parameters (i.e. involved in a rule) during the entire decision time course, and frequency of fixations on these relevant parameters that increased, especially during the last fixations prior to the decision. Consequently, future DSS integrating eye-tracking data should pay specific care to the final fixations prior to the decision. In general, our results emphasize the potential interest of eye-tracking to enhance and accelerate system adaptation to user preference, knowledge, and expertise.
1. Introduction
In dynamic environments, human operators must constantly monitor and integrate incoming information in order to optimize their decision-making. This is particularly true in Air Traffic Control (ATC) ground operations, which require fast, safe, and efficient management of aircraft and vehicles on taxiways and runways. Indeed, today's in-crease of aircraft traffic (Eurocontrol, 2016) challenges not only airport infrastructure but also the operators’ cognitive capacities. Therefore, developing automated tools to assist Air Traffic Controllers (ATCo) in the ground flow management seems to be the best solution. However, current Decision Support Systems (DSS), i.e. tools that support
decision-making in complex activities, do not fully take into account the dy-namic nature of airport ground management. In addition, previous re-search has considered separately airports and ATCo, without in-tegrating the interplay of both (Atkin et al., 2010; Jiang et al., 2015). Routing operations often require real-time adaptation from the system, and therefore the integration of human expertise, preference, decisions, and knowledge is an important factor for the development and ro-bustness of a system. Moreover, the collection of the user's actions would be more complete with the awareness of what features of the interface are visually inspected and what strategies the user exhibits (Bednarik, 2005).
The ability of a system to learn from experience improves its ⁎Corresponding author.
knowledge base and avoids repeating the same mistakes. In the ATC domain,Bonzano et al. (1996)andLiang (2015)showed that a Case-Based Reasoning (CBR) approach can be used in DSS during conflict resolution tasks. The principle of CBR is to solve a new situation by reusing the solution of the most similar previous case. However, the evaluation of the distance between the new situation and the previous one is complex and difficult to objectify. Actually, the number of fea-tures (or parameters) that differentiate two situations can be huge and highly context sensitive. Features that are relevant in a given situation may not be equally significant in another one. For example, during ATC ground operations, the importance of parameters such as aircraft type/ size can be more critical for the decision (to determine the best route) when visibility is poor. The analysis of the eye fixation of the operator on the interface may give reliable indications regarding the user's de-cision-making process and would allow specifying weights for each parameter in a machine learning model, according to its “presumed” criticality in the decision.
1.1. Eye movements as a window into attentional processing and decision-making
Past studies in experimental psychology (Deubel and Schneider,
1996; Hoffman and Subramaniam, 1995; Kowler et al., 1995) and
neuropsychology (Kustov and Lee Robinson, 1996; Mohler and Wurtz, 1976) established the close link between eye movements and atten-tional processes.Carrasco (2011)describes visual attention as a selec-tive process that enables us to prioritize and process relevant visual information in a current task. This tendency to gaze towards a parti-cular area according to the current goal was demonstrated a long time ago in the seminal study ofYarbus (1967). In his experiment, Yarbus demonstrated that the trajectories followed by the gaze on a scene (e.g. a painting) are strongly dependent on the instructions given to the participants (e.g. remember the people's clothes on the painting). Many past studies also indicated that the decision maker tends to gaze more at attributes with greater importance (Glöckner and Herbold, 2011;
Wedell and Senter, 1997). This trend to overwhelmingly attend to
im-portant or high utility information is called the “utility effect” and has been demonstrated across a variety of tasks (for a review, see Orquin and Loose, 2013). For example, in a risky choice task, partici-pants were asked to make quick decisions between two gamble sets with different expected values. They showed that attention to a gamble outcome increased when its expected value is higher, resulting in a more comprehensive information search (amount of fixations) and deeper processing (mean length of a single fixation).
Gaze behavior is also modulated by preferences and by the stage of the decision process, as showed by another study using a forced-choice decision task (Glaholt and Reingold, 2009). Participants were asked to select a preferred image, or the most modern image. The authors de-monstrated robust biases in both gaze duration and gaze frequency towards the chosen items, regardless of the nature of the decision. In-terestingly, dwell duration and dwell frequency reflected different stages of the decision process, with a first “screening” stage char-acterized by selective processing, in which relevant stimuli are encoded in greater depth (longer dwell times) and irrelevant stimuli are less encoded (shorter dwell times) or excluded from further processing; and a later “evaluative stage” of processing that involves the comparison of alternatives and results in a higher frequency of dwells on the chosen item. In this interpretation, the dwell duration bias is related to the encoding of decision alternatives whereas the dwell frequency bias may reflect another process (possibly post-encoding) such as the evaluation and comparison of relevant alternatives. This dissociation of the visual processing in terms of two-stage models, or in two routes of visual processing in the brain, can be found in numerous publications.
Trevarthen (1968)coined the terms “ambient” and “focal” as labels for
distinct brain mechanisms that serve parallel functions of spatial or-ientation (the subcortical pathway) and visual identification (the
cortical pathway). Different patterns of eye movements were attributed to the focal-ambient modes of information acquisition (Unema et al., 2005; Velichkovsky et al., 2005), that has been variably referred to as
evaluating-orienting (Ingle, 1967), examining-noticing
(Weiskrantz, 1972), skimming and scrutinizing (Lohmeyer and
Meboldt, 2015), or exploring and exploiting (Dehais et al., 2017; Dehais et al., 2015). In the last example, a fixation/saccade ratio expresses the balance between different visual strategies: visual search and visual processing (Goldberg and Kotval, 1999).
1.2. Using eye movements to improve system adaptation
Taking this link between attention and eye movement into account, a wide variety of applications have emerged (Duchowski, 2002).
Giannopoulos et al. (2016)used eye-tracking in order to provide
gui-dance to the user facing pervasive environments with high density of visual information. Their experiment took place in a virtual retail, and guidance was contingent upon gaze position. For example, when the user's gaze was directed towards a product on a shelf (e.g. cereal pro-ducts), an advertisement video of this product was shown on a monitor located in the vicinity. Furthermore, when a gaze fixation on the monitor occurred, an attention-getter (flashing) at the position of the advertised product was triggered in order to redirect the attention back to the product. This idea of using an eye tracker to provide real-time guidance and to reduce attentional effort is also explored in a study of
Kajan et al. (2016). They developed an eye-tracking based technology
that extracts information that is most likely relevant to the user. These extracted pieces of information are presented to the user and sorted according to their estimated importance, in the so called “PeepList”. As the user interacts with the display, for each item on the screen, a vector of gaze metrics (gaze time, fixation count, visit counts, and fixated last) is computed. Results showed that eye-tracking was a valuable real-time implicit source of information about what the user was searching and the PeepList principle considerably improved the efficiency of obtaining required information. In the learning context,Hutt et al. (2016)used different gaze metrics to detect the occurrence of mind wandering, an unintentional shift of attention from task-related to task-unrelated thoughts, which can be deleterious to the learning process. Participants self-reported mind wandering episodes by responding to thought-probes (“yes” or “no” based on whether they were mind wandering at the time of the probe). Their eye movements were monitored and a supervised machine learning technique was then used to try to dis-criminate between positive and negative responses to the probes. By studying several eye movement metrics (fixation duration, saccade duration, fixation to saccade ratio etc.), they were able to automatically classify mind wandering events, which may help to re-engage learners and thus improve learning.
In the automobile domain,Doshi and Trivedi (2009)explored the possibility of developing an intelligent driver assistance system capable of predicting drivers’ intent to change lanes. They used a combination of eye gaze position (among nine possible locations) and head motions to feed a discriminative classifier. Head motions, together with lane and vehicle data, served as a very good indicator of lane-change intent. However, eye gaze was less informative than head motions in their study. According to the authors, the driver has a premeditated gaze target when planning to change lanes, and thus prepares the gaze shift with a preliminary head movement. Thus, the intention of the driver is captured earlier with head monitoring than waiting for the subsequent eye-gaze shift. However, such results certainly do not apply to systems displayed on a classical computer screen, as they do not require large head movements. In the same domain,Fletcher and Zelinsky (2009) used eye movements for the online detection of inattention in drivers. They showed that correlating eye gaze with the road scene allowed to detect missed road events and to warn the driver, providing them the time to react before an impeding accident. More recently, Tremblay et al. (2018)proposed to explore the possibility of using
eye-tracking to optimize the visual circuits of surveillance operators who must monitor a large number of screens. One objective is to provide alerts when ocular behavior is considered sub-optimal (e.g. too much focused on a single screen), in order to avoid attentional tunneling or inattentional blindness. Importantly, several studies showed that it is possible to use eye movement to better understand the operator's de-cision-making (Morrison et al., 1997; Wilson et al., 2012) and up-coming choices (Peysakhovich et al., 2015), which would allow pro-viding personal information to users (Majaranta and Bulling, 2014) and to capture their preferences and/or expertise.
1.3. Objectives and hypotheses
DSS with learning capabilities are developed since several years (e.g.Gultepe et al., 2014; Piramuthu et al., 1993) but to the authors’ knowledge, very few integrate objective measures of the operator such as eye movements. Some studies on DSS employed eye-tracking, but this was done to evaluate the display (Morrison et al., 1997), or to examine how the information presentation facilitates or affects deci-sion-making (Kuo et al., 2009). These studies did not attempt to im-prove suggestions from the DSS on the basis of the eye movements, which is the core of the current paper. The recording of the visual scans can contribute not only to an evaluation of the design of a DSS but also to our understanding of how information was acquired and used for decision-making tasks. Enabling the understanding of the ATCo's deci-sion with eye-tracking can be useful to improve the adaptation of a system to user preferences, knowledge, or expertise. Indeed, when the number of parameters that differentiate two situations is high, the learning phase of the CBR system can be long and sub-optimal if it is only based on the previous user choices and the indistinctive analysis of all parameter values (high combinatorial possibilities).
In this paper, we describe the technical development and the testing of a DSS, integrating objective measurements from the user. We com-puted a route suggestion algorithm that can integrate both previous route choices from the ATCo's and the total dwell times on each para-meter. The measure of the time spent gazing at the parameters enabled
to specify higher weights to the parameters that were likely important for the decision. The objective of this study was twofold. First, we ex-plored the performance of our DSS according to several levels of au-tomatic adaptation during an ATC ground taxiing operation simulation. Second, we explored more deeply the dynamics of visual attention during decision-making. We hypothesized that 1) the use of the pre-vious decisions will allow an improvement of the performance of the adaptive route suggestion, and that 2) parameters that are relevant for the decision will be gazed for a longer period of time, and therefore specifying higher weights to parameters subjected to longer fixation will help to further enhance the performance of the adaptive route suggestion. Finally, 3) we hypothesized that fixations on relevant parameters should be longer and/or more frequent, more specifically in the last moments of the decision-making process.
2. Materials and methods
2.1. Participants
Twenty-two healthy volunteers (7 women and 15 men, mean age = 25.0 years, SD = 4.56) were recruited for this study. All were French undergraduate students or researchers familiar with the aero-nautical domain. None of them had a history of neurological disease, psychiatric disturbance, substance abuse, or taking psychoactive med-ications. All participants gave written informed consent in accordance with the local ethical board committee. The study complied with the Declaration of Helsinki for human experimentation.
2.2. Procedure
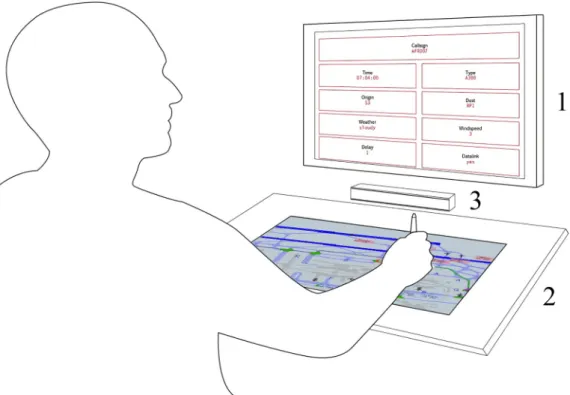
Participants were seated in front of two screens placed on top of each other with their respective interfaces, seeFig. 1. Several para-meters with associated values were displayed on the upper screen. The lower touchscreen provided an interactive interface (developed during the Modern Taxiing project, MoTa) representing the south part of Roissy-Charles-de-Gaulle airport (Paris, France) and showed DSS
Fig. 1. Experimental set-up. 1) The upper screen with all parameters. 2) The lower touch screen with the interactive ATC interface. 3) The eye-tracking system,
routing suggestions. On this latter interface, route suggestions can be either accepted or modified, by adding a waypoint or changing the destination using a stylus.
2.3. ATC task
Participants performed a task simulating airport taxiing operations. We designed an ATC-like synthetic environment that provides an op-timal balance between ecological validity and experimental control. Such microworld simulates key features of dynamic systems within a controlled setting. The generic design and the underlying tasks make it applicable beyond the ATC domain to a range of surveillance/mon-itoring activity (Imbert et al., 2014). Another advantage of using syn-thetic microworld is that it allows recruiting participants that are not necessarily qualified professionals. Several studies employing synthetic ATC simulations involved novices in the ATC domain or students with some ATC knowledge (Hou et al., 2017; Salden et al., 2006). For ex-ample, in the current experiment, a fully realistic simulation would have required numerous qualified controllers with a specific training for the Roissy-Charles-de-Gaulle airport.
Concretely, at the beginning of each trial, the call sign of a new aircraft was presented on the upper screen. The participant selected the corresponding aircraft in the lower screen with the stylus (the call sign of each aircraft was displayed on its radar label). Once selected, a set of parameters with associated values, including time, type, origin, desti-nation, weather, wind speed, delay, and datalink availability, were displayed on the upper screen, below the call sign; and a route sug-gestion was simultaneously displayed (a grey line) on the lower screen, seeFig. 2. The participant had to accept or modify the suggested tra-jectory, basing the decision on the parameter values displayed on the upper screen.
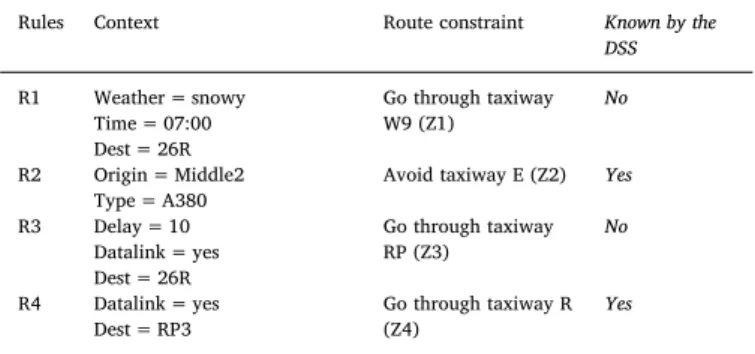
All possible values of the parameters are synthesized inTable 1. After having visualized the parameters and the suggested route, the participant had to accept or modify it according to a set of rules.
Participants had to apply four basic rules during the experiment (Table 2). Each of the four rules was defined by a combination of two (R2 and R4) or three (R1 and R3) parameter values, associated to an aircraft route constraint. A rule was applicable during a given trial when all of the parameter values (context) were present. The objective of the participants was to identify if a rule was applicable, and in that case, to ensure that the trajectory of the aircraft respected the route constraint. For example, if “Middle2” and “A380” values were
displayed for the parameters “Origin” and “Type”, respectively, rule R2 had to be applied. In this case, the participant had to ensure that the aircraft did not use taxiway E (seeTable 2, Rule R2), otherwise the participant had to reject the DSS trajectory suggestion and modify the path of the aircraft (in order to avoid taxiway E) by adding waypoints or by changing the route with the stylus, before the validation. If the route suggestion respected the route constraint of the applicable rule, or if no rules were applicable, the participant simply had to validate the route suggestion. A printed document with all four rules was made available to the participants during the entire experiment.
Fig. 3shows the lower screen with the four taxiways that were
in-volved in the four rules. According to the route constraint of a given rule, the indicated taxiway should be followed (Z1, Z3, or Z4) or avoided (Z2) by the aircraft under control during the current trial. The order of rules varied across participants to avoid an order effect. In each trial, zero or one rule was applicable. Two rules were known by the route suggestion algorithm (R2, R4) and two others were unknown (R1, R3). Consequently, the system always provided a correct suggestion for R2 and R4 and had to learn the two other rules. The information con-cerning the fact whether the rule was known or unknown by the system was not provided to the participants.
2.4. Eye-tracking measurements
During the experiment, eye fixations on the upper screen were re-corded with a remote SMI RED eye tracker (SensoMotoric Instruments GmbH, Germany) at a 60 Hz sampling rate. For all eye movement analyses, the detection threshold that defined a fixation was set to 80 ms (Causse et al., 2016; Quétard et al., 2016; Salvucci and Goldberg, 2000). Eight areas of interest (AOIs) were defined, one for each para-meter (red rectangles around the parapara-meters inFig. 2, call sign was not included in the analysis as this parameter was never involved in a rule). For each trial, the total dwell times on each of the eight AOIs was re-corded, and these values were used by the routing suggestion algorithm in order to weight the parameter, i.e. a longer total dwell time on an AOI will result in a higher weight for the corresponding parameter. It is important to note that the algorithm was never aware about the re-levance (i.e. involved in a rule or not in the current trial) of the different AOIs. The algorithm determined the importance (weight) of each AOI
Fig. 2. Focus on the two interfaces used for the airport routing task: 1) Upper
screen displaying the call sign of the aircraft currently under control and its 8 associated parameter values (time, type etc.). Each red rectangle (except the call sign) represents an area of interest used in the eye-tracking analysis to estimate the time spent gazing at each parameter; 2) lower screen displaying the airport and the DSS route suggestions (the path was displayed in grey, and then it turned to yellow, as shown in the illustration, when participants mod-ified it). (For interpretation of the references to color in this figure legend, the reader is referred to the web version of this article.)
Table 1
All possible parameter values of the simulation.
Type A319, A320, A321, A330, A380, B767, B772, E190
Origin G, RP2, RP5, GE9, P3, J, S1, S2, S3, MIDDLE2
Destination RP1, RP3, KL4, GE3, RP6, UC4, P2, 26R, 27L
Datalink yes, no
Delay (min) 0, 1, 5, 10
Weather sunny, cloudy, snowy
Time 07:00, 12:00, 15:00, 18:00
Wind speed 0, 8, 16, 22
Table 2
The four rules given to the participants, indicating the relevant context and the associated route constraints.
Rules Context Route constraint Known by the
DSS
R1 Weather = snowy Go through taxiway
W9 (Z1) No
Time = 07:00 Dest = 26R R2 Origin = Middle2
Type = A380 Avoid taxiway E (Z2) Yes
R3 Delay = 10 Go through taxiway
RP (Z3) No
Datalink = yes Dest = 26R
R4 Datalink = yes Go through taxiway R
(Z4) Yes
(Rvalidated) or refused otherwise:
=
y 1, graph basedsuggestion accepted
0, graph based suggestion modified (3)
One validated route suggestion is represented by:
= T C W y R R ^ suggested validated (4)
The distance between a new context C and one previous validated route suggestion T (trial) was computed by summing the product of the difference between each feature of the two contexts and its corre-sponding weight from the weight vectorEq. (5) and ((6)):
= = C T, W^T (c , c )i T i 1 n i i (5) = = a b a b a b ( , ) 1, 0, (6)
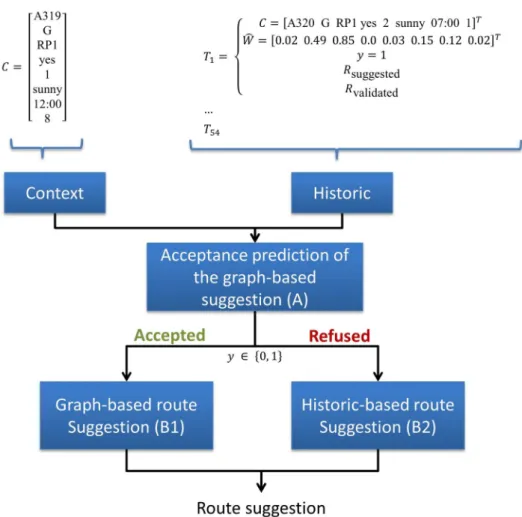
For each new context, component (A) predicted if the graph-based shortest path would be accepted or refused using the knn algorithm. If (A) predicted that the graph-based route suggestion will be accepted, then this route was used. If (A) predicted that the graph-based route suggestion will be refused, then the validated route from the previous decisions with the shortest distance context from the current context (based on the similarity of the eight parameter values) was used (noted as Rhistoric). As this route was not necessarily going through the actual vehicle position, a new route was computed by finding the shortest path between the current vehicle position and one point of the Rhistoricroute. Instances were chosen to ensure that using only previous decisions
Fig. 4. Timeline of the experiment (the 32 training trials were not used by the algorithm during the testing phase).
Fig. 5. Route suggestion process. The classifier
(A) uses the current context and the historic of the previous routes validated by the partici-pant to predict if the graph-based route sug-gestion (B1) will be accepted or refused. If acceptation was predicted, the graph-based route suggestion (B1) was displayed to the user, and in the other case, the historic-based route suggestion (B2) was displayed.
would not allow the algorithm to reach 100% accuracy. Indeed, several trials shared several common parameter values but they did belong to different rules (e.g., several trials are highly similar and shared six parameter values but they still correspond to different rules, whereas other trials shared few common parameter values but correspond to the same rule). Thus, the maximal performance of the algorithm using only previous decisions (in case the participants accepted or modified all the suggestions appropriately) was 85.71% (36 out of 42 trials), as different rules had to be followed in these very similar instances.
3. Results
The results of this study were divided in two parts: First, we ana-lyzed the performance of the routing suggestion algorithm according to the three levels of adaptation: 1) No adaptation (the same route sug-gestions as during the learning phase), 2) using previous decisions of the learning phase, and 3) using previous decisions plus the total dwell times on each AOI of the learning phase. As previously mentioned, the algorithm was not given the input regarding the relevance of the parameters, and this information was never used during the training phase. For each of the 24 trials, we predetermined (during the experi-mental design) whether a rule was applicable or not (i.e. according to the parameter values). In case it was applicable, the parameters in-volved in this rule were labeled as relevant, whereas the others were considered as irrelevant for the decision. This information was available to us for post-hoc analysis purposes only (comparison of the weight values for relevant vs. irrelevant parameters and all exploratory eye-tracking analyses). Second, we conducted exploratory eye-eye-tracking analysis to better understand the behavior underlying the decision process, in particular, the mean dwell times on the relevant and irre-levant parameters, and the probability to dwell on a reirre-levant parameter according to specific periods of the decision-making process. Two participants were excluded from the analysis, one due to incorrect re-cording of the data and the other for eye-tracking signal loss during the acquisition.
3.1. Performance of the route suggestion algorithm
Fig. 6presents the results of the testing phase: The mean percentage of correct suggestions for each level of adaptation. ANOVA showed a significant effect of the level of adaptation (F(1, 19) = 191.76,
p < 0.001, η²p= 0.90) and Tukey's post-hoc test revealed that accuracy
increased across each of these levels (p < 0.001). As previously men-tioned, the route suggestion algorithm was not informed on R1 and R3, and consequently all trials in which R1 or R3 were applicable required a modification from the user. Thus the route suggestion accuracy without adaptation was necessarily 66.67%, corresponding to 28 trials out of 42 with correct suggestions, 14 correct suggestions because the algorithm knew two rules (R2 + R4 = 14 trials) plus 12 trials were no rule was applicable (thus any trajectory was correct). Using previous validation decisions, the route suggestions were accurate at an average of 82.62% (SD = 4.37%) and the performance again improved when the total dwell times on each AOI was used to weigh the distance function, with an average of 89.17% of correct suggestions (SD = 6.06%). Weights were significantly impacted by the relevance (t(19) = 16.82,
p < 0.001): The use of total dwell times spent on parameters in our
algorithm resulted in higher mean weights for relevant (M = 0.43,
SD = 0.05) vs. irrelevant parameters (M = 0.18, SD = 0.03). This result
indicates that participants gazed more in the direction of the relevant parameters (because weights are directly computed on the basis of this eye metric).
3.2. Exploratory eye-tracking analysis
All following exploratory eye-tracking analyses were performed only on the 24 trials of the learning phase in which a rule was
applicable. We present how visual behavior evolved according to the relevance of the parameters (known only to the experimenter, never used by the algorithm) in each trial.
3.2.1. Total fixation time on parameters according to their relevance for the decision
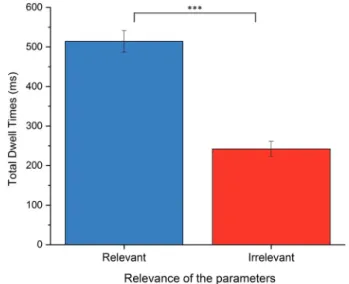
We examined how fixations were distributed between the relevant and irrelevant parameters (total dwell time on each type). Logically, and as suggested by the higher mean weights for relevant parameters, the total dwell times spent by participants on relevant parameters was significantly higher than the one spent on the irrelevant parameters (M = 514.30 ms, SD = 122.83 ms; M = 242.21 ms, SD = 85.16 ms, re-spectively) (t(19) = 13.01, p < 0.001), as presented inFig. 7. Triple Asterisks indicates p < 0.001.
3.2.2. Temporal dynamics of the fixations during decision-making
In order to examine how participants’ visual attention evolved
Fig. 6. Percentage of correct route suggestions reached by the algorithm as a
function of the level of adaptation. The existing data variability in the previous decisions and previous decisions plus total dwell times condition was due to variations in the route modification (e.g. participants could erroneously vali-date route suggestions that did not respect the rule constraints) and in the in-dividual eye fixation patterns over the interface. Error bars represent the standard error of the mean, triple Asterisks indicates p < 0.001.
Fig. 7. Total dwell times (i.e. the average sum of all dwell times) on relevant
and irrelevant parameters during the decision-making process. Error bars re-present the standard error of the mean, triple Asterisks indicates p < 0.001. M. Causse et al.
during the decision time course, we explored the mean dwell times on the relevant and irrelevant parameters and the frequency of the dwells on relevant parameters during the first dwells and the revisit dwells, and in a more detailed manner during the first three dwells and the last three dwells before choice (note that a dwell can be categorized in several serial positions in the few trials in which less than six fixations were performed. For example, when only three fixations were observed, the three dwells were labeled as first/−3, 2/−2, and 3/last, respec-tively).
3.2.3. Mean fixation time for first versus revisit dwells according to the parameter relevance
We conducted a 2 × 2 ANOVA crossing the relevance (whether the dwell was in a relevant or an irrelevant parameter) and the position of dwells (first dwells = dwells prior to the first refixation on a given parameter, and revisit dwells = all others). We found higher mean dwell times for the relevant (M = 330.35 ms, SD = 80.43 ms) vs. irre-levant parameters (M = 280.42 ms, SD = 49.60 ms) (F(1, 19) = 39.52,
p < 0.001, η²p= 0.68; Tukey's HSD post hoc test, p < 0.001 in both
comparisons). However, no main effect of the dwell position (F (1,19) = 1.25, p = 0.28) neither Relevance × Position interaction (F (1,19) = 1.34, p = 0.26) was found on mean dwell times, seeFig. 8. These results showed that there was a bias in dwell duration towards relevant parameters all throughout the decision-making process.
3.2.4. Probability to gaze at a relevant parameter in first versus revisit dwells
The probability to dwell relevant items was higher during the re-visits (M = 0.57, SD = 0.09) compared to the first dwells (M = 0.40,
SD = 0.07) (t(19) = 8.10, p < 0.001), as shown in Fig. 9. Taken to-gether, the two latter results suggest the existence of two biases: A bias in dwell duration occurring during the entire decision making process and a bias in dwell frequency mainly occurring in revisit dwells.
3.2.5. Mean dwell times and dwell frequency in the early and late moments of the decision
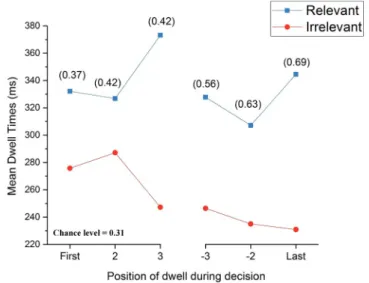
We conducted a 2 × 6 ANOVA crossing the relevance (relevant or irrelevant) and the position of dwells (the first three or last three dwells) for the dwell times. As expected, higher mean dwell times were found for relevant (M = 335.25 ms, SD = 90.97 ms) vs. irrelevant
parameters (M = 253.75 ms, SD = 72.26 ms) (F(1,19) = 48.44,
p < 0.001, η²p= 0.72). There was also a significant
relevance × position interaction (F(5,95) = 4.67, p < 0.01,
η²p= 0.20). Participants demonstrated higher dwell times on relevant
vs. irrelevant parameters (p < 0.001 in all comparisons), except for the second dwell position (p > 0.05), as seen inFig. 10.
The frequency of dwells on relevant parameters, presented in par-entheses above each serial position, was above chance level at each of the six dwell positions. The chance level was 31.25%, for an average of 2.5 relevant parameters among the eight parameters per trial (in fact two or three relevant parameters per trial, representing 60 relevant parameters on a total of 192 parameters that contained the 24 trials that were associated with a rule). At the beginning of the decision-making process, 37% of the first dwells were oriented towards a re-levant parameter. After that, the probability to gaze a rere-levant para-meter increased considerably, in particular during the last three dwells, reaching 69% for the last dwell, seeFig. 10. We conducted a one-way repeated measure ANOVA, using the position of dwells as the in-dependent variable and the probability to dwell a relevant parameter as the dependent variable. The ANOVA confirmed a significant main effect
Fig. 8. Mean dwell times (i.e. average dwell time of each unique consultation)
on relevant and irrelevant parameters for the first dwells and the revisit dwells. Error bars represent the standard error of the mean, triple Asterisks indicates
p < 0.001.
Fig. 9. Probability to dwell a relevant parameter for the first dwells and the
revisit dwells. Error bars represent the standard error of the mean, triple Asterisks indicates p < 0.001.
Fig. 10. Dwell sequence analysis for the first three dwells and the last three
dwells prior decision. Lines represent mean dwell times (i.e. average dwell time of each unique consultation) on relevant and irrelevant parameters. The dwell frequency is presented in parentheses above each position. It represents the proportion of trials (among the 24 trials in which a rule was applicable) in which a relevant parameter was gazed at this dwell position (chance level = 0.31).
of the serial position of dwell on the probability to dwell a relevant parameter (F(5,95) = 22.20, p < 0.001, η²p= 0.54). The Tukey's HSD
post hoc test revealed a higher probability to dwell a relevant para-meter during the last three dwells compared to the first three dwells (all
p < 0.01), and during the last dwell compared to the third last (−3)
(p = 0.01). No difference between the second last (−2) and the last dwell was found.
4. Discussion
4.1. General discussion
In dynamic environments such as ATC, human operators must constantly monitor and integrate incoming information in order to make optimal decisions. Today's increase of aircraft traffic challenges not only airport infrastructure but also the operators’ cognitive ca-pacities. However, developing a fully automatic system to support humans can be sub-optimal without integrating human expertise, knowledge of unknown rules, preferences, and situation awareness. We proposed an ATC route suggestion system that takes into account both the participant's decisions and fixation times on crucial para-meters displayed at the screen. As expected, the suggestions were improved by the integration and weighing of the user's previous decisions. Importantly, determining the critical information for the decision-maker with eye-tracking helped to further improve the DSS suggestions. The key point of the introduction of eye data in the al-gorithm was the capacity to automatically discriminate relevant (i.e. relevant for the decision because involved in a given rule) from ir-relevant parameters on the basis of the total dwell duration. This result is related with past studies that showed systematic “gaze bias” toward the chosen or preferred item (Glaholt and Reingold, 2009;
Schotter et al., 2010). Parameters that were subjected to longer
fixations received higher weights, which allowed the system to un-derstand the operator's decisions quicker in comparison to the sole integration of previous decisions. Since the operator was confronted with numerous parameters, the number of possibilities that could explain a decision was high. Therefore, the learning phase of the algorithm is much more complex when considering all parameters uniformly. Eye-tracking data helped reducing the amount of data required for the training of the classifier and the historic based route suggestion. In the distance function, useful parameters received a higher weight than parameters that were not/less gazed. As a con-sequence, it allows reducing the number of situations to explore before reaching an acceptable classification performance. To the authors’ knowledge, this study is amongst the first research that as-sessed the possibility to increase suggestion relevance from a DSS with eye-tracking. Previous studies did use ocular data to read de-cision-making with a real-time perspective, but this was done to modify the participant's decisions, and not to better adapt a system (Pärnamets et al., 2015).
In order to better understand the dynamics of decision-making, we also examined how the fixations evolved over time. Our results re-vealed that mean dwell times on relevant parameters remained sig-nificantly higher during almost the entire decision process, whereas the probability to dwell relevant parameters was particularly im-portant during the few last dwells prior to choice. These results sup-port the idea that the decision-making process can be partitioned into distinct stages, i.e. an initial screening stage followed by a more thorough evaluation of the few remaining alternatives (Biehal and
Chakravarti, 1986; Lussier and Olshavsky, 1979). In this sense,
Russo and Leclerc (1994) reported longer mean dwell times on the
chosen item all throughout the entire decision-making process (from the first dwell to the last dwell prior to the choice) whereas the probability to dwell on a chosen item was higher only in revisit dwells vs. first dwells. Despite the difference in paradigm, our results fol-lowed a similar trend with relevant items being gazed at for a longer
duration throughout the entire decision-making process and with higher frequency of visits especially for the final dwells. More gen-erally, the number of fixations reflects the importance of an interface object to the participant (Bednarik, 2005), and the eye-mind as-sumption (Just and Carpenter, 1980) posits that there is no lag be-tween what the observer is fixating on and what the mind is proces-sing. This latter theory also posits that fixation duration reflects the time to execute comprehension processes. Even if the link between the gaze and cognitive process may not be so strong, for example, the
mind may be sometimes “ahead” of the eyes (Everatt and
Underwood, 1992), or fixations does not necessarily indicate that
in-formation is processed (Simons and Chabris, 1999), it is reasonable to state that eye movements are not random and that there is an im-portant relationship between eye movements and visual attention. Thus, we suggest that the combination of dwell times during the entire decision-making process, with dwell frequencies in the last moments of the decision, seems to be a promising metric to better read the decision process in the human's eye and could be very useful to im-prove system adaptation.
4.2. Limitations
While the designed experiment reproduced several ATCO opera-tions, there were limitations in its ecological validity. First, the nature of the sample, consisting of 22 participants who were not qualified ATCOs; second, the fact that the experimental paradigm was simpli-fied and not identical to a real ground traffic management environ-ment. We integrated eight key parameters whereas real life settings take into account many more variables. Moreover, we did not in-tegrate other vehicles in the route suggestions, i.e. conflict between aircraft was not considered. Equally though, the simulation lasted less than 30 minutes while operator performance may decrease over longer period due to a vigilance decrement, and these may be inter-esting points for future research. Our ATC-like synthetic environment was designed to provide an optimal balance between ecological va-lidity and experimental control. This simplified context allowed re-cruiting participants without professional ATC qualification. Indeed, with only a basic ATC knowledge, our participants were all able to understand and perform the simulation without much difficulty. At a more advanced stage, it would be necessary to confirm our results using a more complex and realistic simulation and with ATCOs par-ticipants. Such an experiment will more closely assess the benefit of exploiting behavioral and eye-tracking measures with a specialized population that has developed heuristics and expert strategies. Despite these limitations, we believe that our experiment constitutes a valu-able proof of concept of the use of eye-tracking as input for system adaptation.
4.3. Perspectives and conclusion
The aim of this research was to implement an adaptive system that takes into account both previous actions and eye fixations on the in-terface. We explored the use of real-time eye-tracking to understand decisions and cognitive processes to enhance an adaptive system. Eye-tracking shed light on features of the interface that were visually in-spected, and on the strategies exhibited by the user (Bednarik, 2005). Indeed, objects under visual investigation are most likely located on the top of the cognitive processing stack, thus giving a reliable indication on features of the interface that are currently interesting and important for the user. By giving more importance (higher weights) to the para-meters that were fixated during a longer period of time during the decisions, the system was able to enhance its capacity to understand human decisions, after which it could improve the accuracy of its future suggestions. Our results also support the idea that the dynamics of the decision-making process generates two types of visual behavior, with a first “screening” stage in which relevant stimuli are subjected to longer M. Causse et al.
dwell times, and a later “scrutinizing stage” resulting in more frequent fixations on relevant items. Using gaze behavior as a real-time adap-tation source is promising. Our work offers a preliminary basis, arguing in favor of the need to develop new adaptive systems that integrate human actions and objective measures such as eye data. Lastly, con-trary to more cumbersome and invasive tools that are often used to evaluate the mental state of the operator (e.g. electroencephalography, electrocardiography, etc.), “Eye-Computer Interfaces” (ECI) do not ne-cessarily require the user to wear a device, at least in the case of remote eye-tracking, and has the advantage of offering a direct access to visual attention processes.
Acknowledgments
We thank Zarrin Chua and Shahrzad Hosseini for their helpful comments. This work was conducted in the frame of the MoTa (Modern Taxiing) project, supported by Eurocontrol acting on behalf of the SESAR Joint Undertaking (the SJU) and the EUROPEAN UNION as part of Work Package E in the SESAR Programme. Opinions ex-pressed in this work reflect the authors' views only and Eurocontrol and/or the SJU shall not be considered liable for it or for any use that may be made of the information contained herein. This work was supported by a chair grant from Dassault Aviation (“CASAC”, holder: Prof. Mickaël Causse).
References
Atkin, J.A., Burke, E.K., Ravizza, S., 2010. The airport ground movement problem: Past and current research and future directions. In: Proceedings of the 4th International Conference on Research in Air Transportation (ICRAT). Budapest, Hungary. pp. 131–138. Retrieved from. http://www.cs.nott.ac.uk/∼pszja/papers/ICRAT2010. pdf.
Bednarik, R., 2005. Potentials of eye-movement tracking in adaptive systems. In: Presented at the 4th Workshop on the Evaluation of Adaptive Systems.
Biehal, G., Chakravarti, D., 1986. Consumers’ use of memory and external information in choice: macro and micro perspectives. J. Consum. Res. 12 (4), 382–405. Bonzano, A., Cunningham, P., Meckiff, C., 1996. ISAC: a CBR system for decision support
in air traffic control. In: European Workshop on Advances in Case-Based Reasoning. Springer, pp. 44–57. Retrieved from. http://link.springer.com/chapter/10.1007/ BFb0020601.
Carrasco, M., 2011. Visual attention: the past 25 years. Vis. Res. 51 (13), 1484–1525.
https://doi.org/10.1016/j.visres.2011.04.012.
Causse, M., Imbert, J.-P., Giraudet, L., Jouffrais, C., Tremblay, S., 2016. The role of cognitive and perceptual loads in inattentional deafness. Front. Hum. Neurosci. 10.
https://doi.org/10.3389/fnhum.2016.00344.
Dehais, F., Behrend, J., Peysakhovich, V., Causse, M., Wickens, C.D., 2017. Pilot flying and pilot monitoring's aircraft state awareness during go-around execution in avia-tion: a behavioral and eye tracking study. Int. J. Aerosp. Psychol. 27 (1–2), 15–28.
https://doi.org/10.1080/10508414.2017.1366269.
Dehais, F., Peysakhovich, V., Scannella, S., Fongue, J., Gateau, T., 2015. Automation surprise in aviation: real-time solutions. In: Presented at the Proceedings of the 33rd annual ACM Conference on Human Factors in Computing Systems. ACM, pp. 2525–2534.https://doi.org/10.1145/2702123.2702521.
Deubel, H., Schneider, W.X., 1996. Saccade target selection and object recognition: evi-dence for a common attentional mechanism. Vis. Res. 36 (12), 1827–1837.https:// doi.org/10.1016/0042-6989(95)00294-4.
Doshi, A., Trivedi, M.M., 2009. On the roles of eye gaze and head dynamics in predicting driver's intent to change lanes. IEEE Trans. Intell. Transp. Syst. 10 (3), 453–462.
https://doi.org/10.1109/TITS.2009.2026675.
Duchowski, A.T., 2002. A breadth-first survey of eye-tracking applications. Behav. Res. Methods Instrum. Comput. 34 (4), 455–470.https://doi.org/10.3758/BF03195475. Eurocontrol, 2016. Annual Report. Retrieved from. http://www.eurocontrol.int/
publications/eurocontrol-annual-report-2015.
Everatt, J., Underwood, G., 1992. Parafoveal guidance and priming effects during reading: a special case of the mind being ahead of the eyes. Conscious. Cognit. 1 (2), 186–197.https://doi.org/10.1016/1053-8100(92)90060-N.
Fletcher, L., Zelinsky, A., 2009. Driver inattention detection based on eye gaze—road event correlation. Int. J. Robot. Res. 28 (6), 774–801.
Giannopoulos, I., Schöning, J., Krüger, A., Raubal, M., 2016. Attention as an input modality for Post-WIMP interfaces using the viGaze eye tracking framework. Multimedia Tools Appl. 75 (6), 2913–2929.
Glaholt, M.G., Reingold, E.M., 2009. The time course of gaze bias in visual decision tasks. Vis. Cognit. 17 (8), 1228–1243.https://doi.org/10.1080/13506280802362962.
Glöckner, A., Herbold, A., 2011. An eye‐tracking study on information processing in risky decisions: evidence for compensatory strategies based on automatic processes. J. Behav. Decis. Mak. 24 (1), 71–98.
Goldberg, J.H., Kotval, X.P., 1999. Computer interface evaluation using eye movements:
methods and constructs. Int. J. Ind. Ergon. 24 (6), 631–645.https://doi.org/10. 1016/S0169-8141(98)00068-7.
Gultepe, E., Green, J.P., Nguyen, H., Adams, J., Albertson, T., Tagkopoulos, I., 2014. From vital signs to clinical outcomes for patients with sepsis: a machine learning basis for a clinical decision support system. J. Am. Med. Inf. Assoc. 315–325.
Hoffman, J.E., Subramaniam, B., 1995. The role of visual attention in saccadic eye movements. Percept. Psychophys. 57 (6), 787–795.
Hou, X., Trapsilawati, F., Liu, Y., Sourina, O., Chen, C.-H., Mueller-Wittig, W., Ang, W.T., 2017. EEG-based human factors evaluation of conflict resolution aid and tactile user interface in future Air Traffic Control systems. Advances in Human Aspects of Transportation. Springer, pp. 885–897.
Hutt, S., Mills, C., White, S., Donnelly, P.J., D'Mello, S.K., 2016. The eyes have it: gaze-based detection of mind wandering during learning with an intelligent tutoring system. In: Presented at the 9th International Conference on Educational Data Mining. International Educational Data Mining Society, pp. 86–93.
Imbert, J.-P., Hodgetts, H.M., Parise, R., Vachon, F., Dehais, F., Tremblay, S., 2014. Attentional costs and failures in air traffic control notifications. Ergonomics 57 (12), 1817–1832.https://doi.org/10.1080/00140139.2014.952680.
Ingle, D., 1967. Two visual mechanisms underlying the behavior of fish. Psychol. Forsch. 31 (1), 44–51.https://doi.org/10.1007/BF00422385.
Jiang, Y., Xu, X., Zhang, H., Luo, Y., 2015. Taxiing route scheduling between taxiway and runway in hub airport. Math. Prob. Eng. 2015, 1–14.https://doi.org/10.1155/2015/ 925139.
Just, M.A., Carpenter, P.A., 1980. A theory of reading: from eye fixations to compre-hension. Psychol. Rev. 87 (4), 329.
Kajan, R., Herout, A., Bednarik, R., Povolný, F., 2016. PeepList: adapting ex-post inter-action with pervasive display content using eye tracking. Pervasive Mob. Comput. 30, 71–83.
Kowler, E., Anderson, E., Dosher, B., Blaser, E., 1995. The role of attention in the pro-gramming of saccades. Vis. Res. 35 (13), 1897–1916.
Kuo, F.-Y., Hsu, C.-W., Day, R.-F., 2009. An exploratory study of cognitive effort involved in decision under framing—an application of the eye-tracking technology. Decis. Support Syst. 48 (1), 81–91.
Kustov, A.A., Lee Robinson, D., 1996. Shared neural control of attentional shifts and eye movements. Nature 384 (6604), 74–77.https://doi.org/10.1038/384074a0.
Liang, M., 2015. Case-based reasoning for flight conflicts resolution in En-route short term conflict alert situation. Open Autom. Control Syst. J. 7, 84–92.
Lohmeyer, Q., Meboldt, M., 2015. How we understand engineering drawings: an eye tracking study investigating skimming and scrutinizing sequences. In: Presented at the International conference on engineering design ICED. 15.
Lussier, D.A., Olshavsky, R.W., 1979. Task complexity and contingent processing in brand choice. J. Consum. Res. 6 (2), 154–165.
Majaranta, P., Bulling, A., 2014. Eye tracking and eye-based human–computer interac-tion. In: Fairclough, S.H., Gilleade, K. (Eds.), Advances in Physiological Computing. Springer London, London, pp. 39–65. https://doi.org/10.1007/978-1-4471-6392-3_3.
Mohler, C., Wurtz, R., 1976. Organization of monkey superior colliculus: intermediate layer cells discharging before eye. J. Neurophysiol. 39 (4), 722–744.
Morrison, J.G., Marshall, S.P., Kelly, R.T., Moore, R.A., 1997. Eye tracking in tactical decision making environments: implications for decision support evaluation (vol. 20, p. 1997). In: Presented at the Third International Command and Control Research and Technology Symposium. National Defense University June 17.
Orquin, J.L., Loose, S.M., 2013. Attention and choice: a review on eye movements in decision making. Acta Psychol. (Amst) 144 (1), 190–206.
Pärnamets, P., Johansson, P., Hall, L., Balkenius, C., Spivey, M.J., Richardson, D.C., 2015. Biasing moral decisions by exploiting the dynamics of eye gaze. Proc. Natl. Acad. Sci. 112 (13), 4170–4175.
Peysakhovich, V., Vachon, F., Vallières, B.R., Dehais, F., Tremblay, S., 2015. Pupil dila-tion and eye movements can reveal upcoming choice in dynamic decision-making. In: Proceedings of the Human Factors and Ergonomics Society Annual Meeting. 59. pp. 210–214.https://doi.org/10.1177/1541931215591043.
Piramuthu, S., Raman, N., Shaw, M.J., Park, S.C., 1993. Integration of simulation mod-eling and inductive learning in an adaptive decision support system. Decis. Support Syst. 9 (1), 127–142.
Quétard, B., Quinton, J.C., Mermillod, M., Barca, L., Pezzulo, G., Colomb, M., Izaute, M., 2016. Differential effects of visual uncertainty and contextual guidance on perceptual decisions: evidence from eye and mouse tracking in visual search. J. Vis. 16 (11), 28.
https://doi.org/10.1167/16.11.28.
Russo, J.E., Leclerc, F., 1994. An eye-fixation analysis of choice processes for consumer nondurables. J. Consum. Res. 21 (2), 274–290.
Salden, R.J., Paas, F., Van Merriënboer, J.J., 2006. Personalised adaptive task selection in air traffic control: effects on training efficiency and transfer. Learn. Instr. 16 (4), 350–362.https://doi.org/10.1016/j.learninstruc.2006.07.007.
Salvucci, D.D., Goldberg, J.H., 2000. Identifying Fixations and Saccades in Eye-Tracking Protocols. ACM Press, pp. 71–78.https://doi.org/10.1145/355017.355028. Schotter, E.R., Berry, R.W., McKenzie, C.R.M., Rayner, K., 2010. Gaze bias: selective
encoding and liking effects. Vis. Cognit. 18 (8), 1113–1132.https://doi.org/10. 1080/13506281003668900.
Simons, D.J., Chabris, C.F., 1999. Gorillas in our midst: sustained inattentional blindness for dynamic events. Perception 28 (9), 1059–1074.
Tremblay, S., Lafond, D., Chamberland, C., Hodgetts, H.M., Vachon, F., 2018. Gaze-aware cognitive assistant for multiscreen surveillance. In: Presented at the International Conference on Intelligent Human Systems Integration. Springer, pp. 230–236.
Trevarthen, C.B., 1968. Two mechanisms of vision in primates. Psychol. Forsch. 31 (4), 299–337.
information processing during scene perception: the relationship between saccade amplitude and fixation duration. Vis. Cognit. 12 (3), 473–494.https://doi.org/10. 1080/13506280444000409.
Velichkovsky, B.M., Joos, M., Helmert, J.R., Pannasch, S., 2005. Two visual systems and their eye movements: evidence from static and dynamic scene perception. In: Presented at the Proceedings of the XXVII Conference of the Cognitive Science Society. Citeseer, pp. 2283–2288.
Wedell, D.H., Senter, S.M., 1997. Looking and weighting in judgment and choice. Organ. Behav. Hum. Decis. Process. 70 (1), 41–64.https://doi.org/10.1006/obhd.1997.
on attention and information processing speed reflected in auditory P300. Ear Hear. 33 (4), 480–488.
Yarbus, A.L., 1967. Eye movements during perception of complex objects. Eye Movements and Vision. Springer, pp. 171–211.
2692.
Weiskrantz, L., 1972. Review Lecture-Behavioural analysis of the monkey's visual nervous system. In: Presented at the Proc. R. Soc. Lond. B. 182. The Royal Society, pp. 427–455.
Wilson, M.J., Harkrider, A.W., King, K.A., 2012. Effects of complexity of visual distracters