INTERNATIONAL JOURNAL OF MICROSIMULATION (2014) 7(1) 158-193 INTERNATIONAL MICROSIMULATION ASSOCIATION
Microsimulation Model Projecting Small Area Populations Using Contextual Variables:
An Application to the Montreal Metropolitan Area, 2006-2031
Guillaume Marois
INRS – Centre Urbanisation Culture Société 385 rue Sherbrooke Est
Montréal QC H2X 1E3 Canada
Alain Bélanger
INRS – Centre Urbanisation Culture Société 385 rue Sherbrooke Est
Montréal QC H2X 1E3
ABSTRACT: A common difficulty faced when projecting small area populations has to do with
the implementation of local factors which highly influence local population growth. This problem is particularly important when simulating events that have a strong geographic component, such as internal migration, and destination choice of external migrants. This paper is part of a larger research program that aims at developing a dynamic time-based microsimulation projection model of the population of the Montreal metropolitan area and its 79 municipalities, by age, sex, and language. It presents an innovative treatment of migration by taking into consideration previous changes in local conditions when determining mobility and destination choices. Municipalities are first divided into two categories, suburban and the central city, to compute location-specific probabilities of moving by age, language and place of birth. Then, the destination choice of movers is based on a utility function that accounts for five important determinants of residential choice: (1) the distance from the central city, (2) the current size of the population of each municipality, (3) the municipality development potential, (4) the linguistic
INTERNATIONAL JOURNAL OF MICROSIMULATION (2014) 7(1) 158-193 159
MAROIS, BÉLANGER Microsimulation Model Projecting Small Area Populations Using Contextual Variables: An Application to the Montreal Metropolitan Area, 2006-2031.
composition of its population, and (5) the geographical location. A similar function is estimated to allocate a place of residence to external migrants. Parameters are estimated using conditional logistic regressions and are implemented into the microsimulation model. The model is validated over the 2006-2011 period and results of the reference scenario presented for 2031.
KEYWORDS: Small Area Population Projections, Microsimulation, Urban and Regional
Planning, Montreal Canada
INTERNATIONAL JOURNAL OF MICROSIMULATION (2014) 7(1) 158-193 160
MAROIS, BÉLANGER Microsimulation Model Projecting Small Area Populations Using Contextual Variables: An Application to the Montreal Metropolitan Area, 2006-2031.
1. INTRODUCTION
Most demographic projections are realized at the national or regional levels and are mainly used for planning of public policies at this broader level. Using cohort-component or multi-state approaches these models are not adequate for planning of local services and needs, such as places in childcare or services for the elderly because they are unable to account for all the spatial interactions (Harding, Vidyattama et al. 2011). Yet, local and municipal governments also need tools for planning, in particular to ensure public services under their responsibility (aqueducts, parks, waste collection, etc.) and urban planning (Isserman 1984, Foss 2002, Swanson and Pol 2008). Small area population projections have unquestionable value: they can be used for planning purposes, but also in a prospective approach such as measuring the impact of a change in public policy, such as zoning, on the spatial distribution of the population (Ballas, Clarke et al. 2005a, Wilson 2011).
In addition, population projections at the local and municipal level have to account for the dynamic of residential segregation (Yin 2009). While in many North American cities residential segregation is related to ethnic or racial groups, Montreal differs from other North American cities by the presence of two main linguistic groups: the francophone majority, descendants of the first colonists who came from France and founders of the city, and a wealthier English-speaking minority which gradually developed after the British conquest of New France (Brunet 1955, Vaillancourt 1985, Séguin 1987). Montreal is also the port of entry of a large majority of immigrants landing in the province of Québec and recent high levels of increasingly diverse immigration has favored the emergence of another, more heterogeneous, linguistic group: the allophones, a term which in Canada defines those who speak another language than French or English at home. While racial or ethnical spatial segregation doesn’t appear to be important in the Montreal area, a spatial pattern is clearly apparent in the residential choice of linguistic groups (Marois and Bélanger 2014, Marois and Bélanger 2014, Forthcoming).
The aim of this paper is to present the small area population projection model that we developed to project the population of municipalities of the Montreal Metropolitan Community (MMC). The model is innovative in its treatment of migration, the most technically and conceptually difficult component of change to model in small area population projections. To meet these challenges, we build a dynamic time-based microsimulation projection model in which the choice of municipality of residence is determined by a utility function that considers municipality-specific contextual factors. The time horizon of the projection is from 2006 to 2031. This model
INTERNATIONAL JOURNAL OF MICROSIMULATION (2014) 7(1) 158-193 161
MAROIS, BÉLANGER Microsimulation Model Projecting Small Area Populations Using Contextual Variables: An Application to the Montreal Metropolitan Area, 2006-2031.
has an additional objective: assess the evolution of linguistic groups at a local level.
2. SPECIFIC CHALLENGES OF SMALL AREA POPULATION PROJECTIONS
Small area population projection models are subject to specific methodological challenges that are less important for national population projections. Given the small size of the population, it is more difficult to accurately estimate the component of changes for small areas (Keyfitz 1972, Ballas, Rossiter et al. 2005b, Lutz 2009, Cameron and Poot 2011). This problem is particularly important for events that have a strong geographic dimension, such as internal migration and destination choice of external migrants (Ballas, Rossiter et al. 2005b). Furthermore, because for several destination flows, the number of migrants is small to non-existent, a robust origin-destination matrix to determine the migration pattern can hardly be built.
Given the importance of migration on population growth and change at the local level and given the instability of migration patterns over time, the accuracy of the projection can be greatly affected by mobility assumptions (Sanderson, Dal et al. 2010, Cameron and Poot 2011). At this level, individual decisions regarding choice of a place of residence depends on the changes over time in each potential location relative to all other alternatives. Thus, another difficulty faced when projecting small area populations is related to the implementation of contextual factors which may highly influence individual decision-making and local population growth. A rigorous small area population projections model must also take into account those contextual variables that can be determining factors in the migrants’ decision-making, such as the distance from a central point, the socio-demographic composition or physical characteristics of the territory (Murdock, Hamm et al. 1991; Chi, Zhou et al. 2011). Similarly, urban planning can sometimes affect the projection since it has a major role in housing supply (Murdock, Hamm et al. 1991, Dittgen 2008, Bergouignan 2010). Geographical and contextual variables should thus be implemented as parameters to avoid the self-fulfilling effect of projections (e.g., when the urban plan is modified to integrate previous projection results). However, most small area projection models ignore contextual and environmental factors. Accordingly, traditional demographic methods such as the Hamilton-Perry method, the top-down method or the iterative proportional fitting method are generally used (Hamilton and Perry 1962, Birkin and Clarke 1989, Rees 1994, Rees, Norman et al. 2004, Simpson and Tranmer 2005, Ballas, Clarke et al. 2005a, Institut de la statistique du Québec 2010, Menthonnex 2010, Swanson, Schlottmann et al. 2010).
INTERNATIONAL JOURNAL OF MICROSIMULATION (2014) 7(1) 158-193 162
MAROIS, BÉLANGER Microsimulation Model Projecting Small Area Populations Using Contextual Variables: An Application to the Montreal Metropolitan Area, 2006-2031.
3. MODELING INTERNAL MIGRATION AND RESIDENTIAL LOCATION
The method proposed in this paper to model internal migration and residential-choice combines elements from the life cycle approach and the random utility model. Most studies seeking to explain individual decisions regarding residential mobility are based on the life cycle approach (Glick 1947, Rossi 1955, Landale and Guest 1985, South and Crowder 1997, Kim, Horner et al. 2005, Æro 2006, Marois and Bélanger 2014). This approach suggests that events that mark the life cycle, such as union formations and dissolutions, births of children, or the departures of children from parental house, are determinants of residential mobility, because the residential needs of the family are changing after the occurrences of these events. Since they are generally correlated with age, this variable is therefore a key determinant of residential mobility.
The literature distinguishes two main urban forms in North American metropolitan areas: the inner city, which for conceptual and methodological reasons is often defined as the central municipality, and the suburb. The inner city can be seen as a place of transition, especially for young people who study or are in search for a first job and a partner (Kasarda, Appold et al. 1997, Glaeser, Kolko et al. 2001, Fréchette, Desmarais et al. 2004, Turcotte and Vézina 2010, Marois and Bélanger 2013). According to the life cycle perspective, when they will be professionally stable and will be ready to have children, their preferences will be for larger housing and a quieter environment rather than for employment accessibility. They will therefore leave for the suburbs, if they can. (Frey and Kobrin 1982, Feijten and Mulder 2002, Karsten 2007, Marois and Bélanger 2014).
Because of the large number of municipalities in the Montreal metropolitan area, it is not possible to estimate an origin-destination matrix, especially when the population is disaggregated by age and language groups. But, if the determinants of the decision to move from the central city to the suburb differ from those of a reciprocal move from suburbs’ residents, we can assume that they are similar for residents of all suburban municipalities. Thus, we propose, as a first step in the modeling of internal migration, to stratify migrants according to the type of move rather than by municipality of origin. In the Montreal metropolitan area, the inner city consists of only one municipality (the municipality of Montreal, which is the central city). Residential moves within the central municipality are therefore not considered as a migration event. We can therefore define three types of internal mobility:
INTERNATIONAL JOURNAL OF MICROSIMULATION (2014) 7(1) 158-193 163
MAROIS, BÉLANGER Microsimulation Model Projecting Small Area Populations Using Contextual Variables: An Application to the Montreal Metropolitan Area, 2006-2031.
2. From the central municipality to a suburb; 3. From a suburb to another suburb.
In a second step, a new municipality of residence has to be assigned to those internal migrants. In addition, a large number of external migrants also arrive each year in the metropolitan area, some from abroad (international immigrants), some from elsewhere in Canada (interprovincial migrants) and others from other regions of Quebec (intraprovincial migrants) and a municipality has to be assigned to these newcomers too. To account for the various profiles and preferences of these migrants in their location-decision, we regroup them into three additional groups of migrants:
4. International immigrants; 5. Interprovincial migrants; 6. Intraprovincial migrants.
For those who move from a suburb to the central municipality, the model does not need to be more complex, since there is only one possible destination by definition. For the other five groups of migrants, the model must assign a municipality of residence and this is done using the following random utility approach.
Assuming that migrants want to maximize the utility of attributes of the municipality they choose as destination, this approach can be defined as follow. Let Ut
j be a utility function for each possible alternative j for individual of type t, where t is the type of migrants (from the central municipality, from another suburb, from another country, from another province and from the rest of Quebec) and j the number of municipalities which has a set of zn characteristics. Thus, we
have: nj n j j z z z t j
e
U
1 1 2 2 ... where Utj = Utility of a municipality j for a migrant type t, j=1…J; t=1…n
INTERNATIONAL JOURNAL OF MICROSIMULATION (2014) 7(1) 158-193 164
MAROIS, BÉLANGER Microsimulation Model Projecting Small Area Populations Using Contextual Variables: An Application to the Montreal Metropolitan Area, 2006-2031.
βk = Parameter of the independent variable k, k=1…n
Parameters βk are estimated by a maximum likelihood method and are constant for each
alternative. They estimate the net impact of municipalities’ characteristics. We seek to estimate the probability that an individual i of type t chooses the municipality j with Ut
j utility function. Thus, we have:
J h t h t j t jU
U
P
1In this way, contextual variables can be included as explanatory variables of migrants’ decision for a municipality of destination. In the context of Montreal, previous analysis has shown the importance of the municipality’s accessibility and housing offer, as well as of the linguistic composition of the municipality (Marois and Bélanger 2014, Forthcoming). Additional variables such as the average value of housing and the socio-economic composition of the municipality also became apparent from the analysis, but since reliable long-term assumptions for them are not available, they are not included in the population projection. Therefore, five municipality-specific variables are included in the model:
1. Distance from the downtown area; 2. Population size;
3. Number of new housings; 4. Linguistic composition; 5. Geographical position.
4. MODEL DEFINITION, ASSUMPTIONS AND DATA SOURCES
The proposed method for residential location modeling focuses on individual preferences which vary according to personal characteristics. The projection model must therefore use a micro approach and microsimulation is the preferred method. Microsimulation simulates processes and life events (e.g., mortality, fertility, residential mobility, etc.) of individuals following behavioral assumptions which parameters are derived from empirical data (Orcutt 1957). The probability that each type of events occurs is calculated for each individual and the occurrence of a particular event is determined using a Monte Carlo process. Following the event, characteristics of the
INTERNATIONAL JOURNAL OF MICROSIMULATION (2014) 7(1) 158-193 165
MAROIS, BÉLANGER Microsimulation Model Projecting Small Area Populations Using Contextual Variables: An Application to the Montreal Metropolitan Area, 2006-2031.
simulated individual may change (life status is changed to dead, number of births is incremented, place of residence changes, etc.). Statistical indicators, such as population size, age structure, socio-demographic composition, etc. can then be computed from the aggregation of individual data. Post and Van Imhoff (1998) argue that microsimulation is particularly appropriate when “the problem requires a large state space” (p.107). The possibility of including a large number of individual attributes is another major advantage of microsimulation compared to a component-cohort method. This method is then appropriate for local projections because of the large number of municipalities and individual characteristics that are simultaneously projected.
Montreal is the second most populous metropolitan area of Canada after Toronto. The Montreal
Metropolitan Community (MMC)1 regroups 82 municipalities into a supra-municipal entity2. The
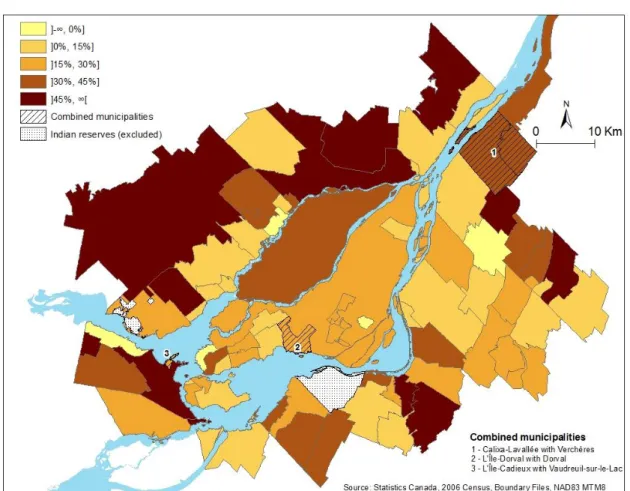
population of the MMC is estimated to 3.7 million residents in 2010. The MMC is active in land use planning and economic development, public transit and metropolitan arterial road network developments, waste management planning and social housing. With more than 1.6 million people, the municipality of Montreal is the central city, while the rest of the MMC compose the suburb (78 municipalities). Map 1 spatially illustrates the municipalities under study and shows their grouping into regional county municipality (RCM)3, a spatial aggregation used for some
INTERNATIONAL JOURNAL OF MICROSIMULATION (2014) 7(1) 158-193 166
MAROIS, BÉLANGER Microsimulation Model Projecting Small Area Populations Using Contextual Variables: An Application to the Montreal Metropolitan Area, 2006-2031.
Figure 1 The central municipality of the MMC and municipalities included in the suburb
Our dynamic time-based microsimulation model is called LDS (Local Demographic Simulations) and is built using SAS Software. The starting population is extracted from the 2006 Census and the projection’s horizon is 2031. The 20% microdata file of the 2006 Canadian Census4 provides a
large database (682 000 respondents in the MMC territory) with all the individual characteristics necessary for our model. It makes up our starting population. Its large sample size is useful to ensure robust estimates of relatively rare events and to reduce the Monte Carlo error inherent to microsimulation. The following characteristics are extracted from the database:
1. Age (0 to 119); 2. Sex (male or female);
3. Municipality of residence (79 municipalities of the Montreal Metropolitan Community); 4. Place of birth (in Canada, foreign-born);
5. Year of arrival in Canada (specific to foreign-born); 6. Language spoken at home (English, French or other).
INTERNATIONAL JOURNAL OF MICROSIMULATION (2014) 7(1) 158-193 167
MAROIS, BÉLANGER Microsimulation Model Projecting Small Area Populations Using Contextual Variables: An Application to the Montreal Metropolitan Area, 2006-2031.
7. Age at immigration (specific to foreign-born);
8. Number of years since arrival (specific to foreign-born); 9. Regional county municipality of residence;
10. Type of municipality (central municipality or suburb).
To account for the net census undercount (2.07% in Quebec), we reweighted the population using the 2006 population estimate by age groups and municipalities (Institut de la statistique du Québec 2013). Each individual weight is corrected using an age group-municipality-specific factor.
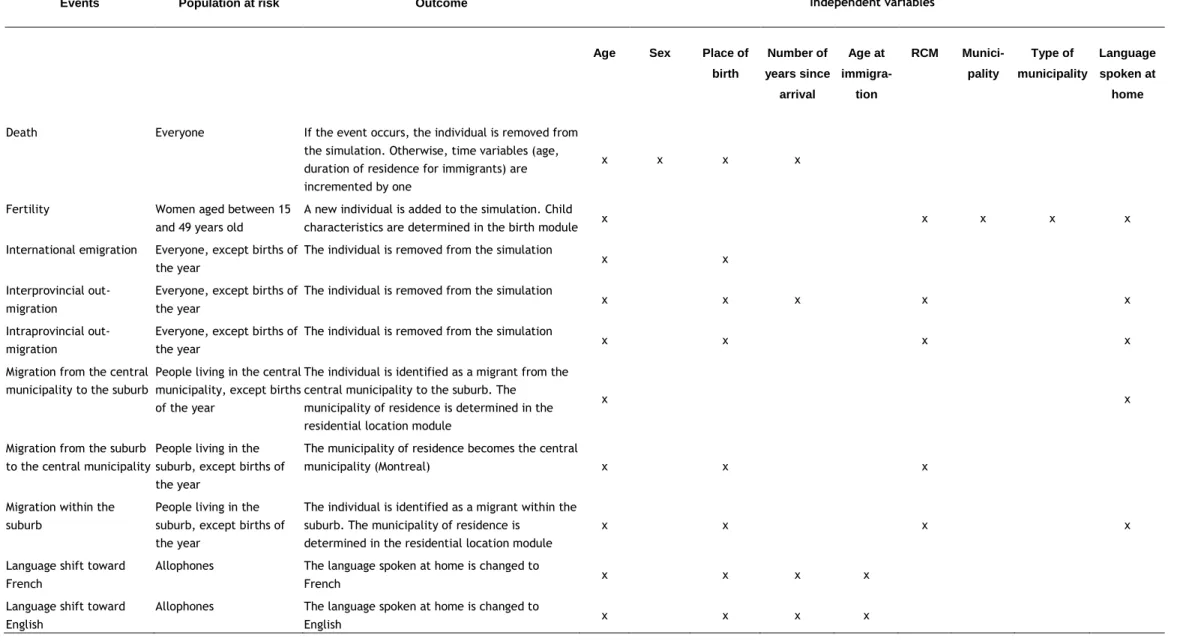
Modeled events are represented schematically in Table 1, with the independent variables where appropriate:
INTERNATIONAL JOURNAL OF MICROSIMULATION (2014) 7(1) 158-193 INTERNATIONAL MICROSIMULATION ASSOCIATION
Table 1 Summary of events
Events Population at risk Outcome Independent variables
Age Sex Place of birth Number of years since arrival Age at immigra-tion RCM Munici-pality Type of municipality Language spoken at home
Death Everyone If the event occurs, the individual is removed from the simulation. Otherwise, time variables (age, duration of residence for immigrants) are incremented by one
x x x x
Fertility Women aged between 15 and 49 years old
A new individual is added to the simulation. Child
characteristics are determined in the birth module x x x x x
International emigration Everyone, except births of the year
The individual is removed from the simulation
x x
Interprovincial out-migration
Everyone, except births of the year
The individual is removed from the simulation
x x x x x
Intraprovincial out-migration
Everyone, except births of the year
The individual is removed from the simulation
x x x x
Migration from the central municipality to the suburb
People living in the central municipality, except births of the year
The individual is identified as a migrant from the central municipality to the suburb. The
municipality of residence is determined in the residential location module
x x
Migration from the suburb to the central municipality
People living in the suburb, except births of the year
The municipality of residence becomes the central
municipality (Montreal) x x x
Migration within the suburb
People living in the suburb, except births of the year
The individual is identified as a migrant within the suburb. The municipality of residence is
determined in the residential location module
x x x x
Language shift toward French
Allophones The language spoken at home is changed to
French x x x x
Language shift toward English
Allophones The language spoken at home is changed to
INTERNATIONAL JOURNAL OF MICROSIMULATION (2014) 7(1) 158-193 INTERNATIONAL MICROSIMULATION ASSOCIATION
Characteristics at the beginning of the period are used to estimate the likelihood of each event. For example, a 20 year old woman living in a given municipality at the beginning of the year who migrates to another municipality during the year has the probability of giving birth of women aged 20 living in the initial municipality for all the period. Only in the following year, when she will be 21 at the beginning of the year, will her probability of giving birth change.
4.1. Death event
Mortality has less impact on projected local population counts than other demographic components and varies less between regions (Termote, Payeur et al. 2011). Therefore, we assume that probabilities of dying do not vary by municipality of residence. Provincial age and sex prospective probabilities of dying from the reference scenario of the population projections published by the provincial statistical agency (Institut de la statistique du Québec 2009) are used as input. Life expectancy at birth increases from 78.3 years in 2006 to 82.9 years in 2031 and from 83.0 years to 86.6 years for males and females, respectively. To take into account the healthy immigrant effect (Chen, Ng et al. 1996, Bourbeau 2002, McDonald and Kennedy 2004), we adjust the probabilities of dying using relative risks of mortality for Canadian-born, established immigrants (admitted 10 years earlier or more) and recent immigrants (admitted in last 10 years) estimated in a previous study (Bélanger and Malenfant 2005). These relative risks are 0.354 for recent immigrants, 0.96 for established immigrants and 1.029 for Canadian-born.
4.2. Fertility and birth modules
The fertility module is applied to women aged 15 to 49. Fertility rates are estimated in two steps. First, we estimated fertility rates by age, language spoken at home and type of municipality (central municipality or suburb) using the own children method applied to 2006 Census data. As expected, our results show that fertility is lower among women living in the central city than those living in the suburbs for francophones (1.33 vs 1.66) and anglophones (1.47 vs 1.75), but not for allophones (2.35 vs 1.87). One reason that can explain this last finding is that fertility tends to be higher among recent immigrants (Bélanger and Gilbert 2002) who are more likely to be allophones. Since most immigrants first settle in the central municipality, it can inflate the
INTERNATIONAL JOURNAL OF MICROSIMULATION (2014) 7(1) 158-193 170
MAROIS, BÉLANGER Microsimulation Model Projecting Small Area Populations Using Contextual Variables: An Application to the Montreal Metropolitan Area, 2006-2031.
estimate. As the duration of residence in Canada increases, immigrants’ fertility converges towards the level of the native-born population and at the same time immigrants tend also to move to other areas of the metropolitan area. Using these rates as input, we performed a first simulation from 2006 to 2011 and we compared the projected number of births by municipality with the observed numbers. We then calibrated municipality’s fertility rates so that the total number of simulated births for each municipality matches the recorded data while the relative differences between population groups were maintained5.
When a birth occurs, a new individual is added to the simulation and the birth module assigns characteristics to newborns. Age is set to 0, the sex ratio at birth is used to randomly allocate the sex of the newborn, the place of residence is set equal to the residence of the mother at the end of the projected year and a probability of surviving to the end of the year is applied to the newborn. The language group of the child can be different from the language of the mother due to the possibility of intergenerational language shifts and is randomly allocated following rules described in the next section.
4.3. Linguistic mobility events
They are two types of language shifts. Language shifts over the life course concern change in the language used at home by the individual over his own life and intergenerational language shifts concerns the non-transmission of the mother’s mother tongue to the child at birth. Although Canada is rich of linguistic questions in censuses and surveys, there is no data set that can provide direct estimates of linguistic mobility. It is therefore necessary to use alternative methods to estimate language shifts over the lifetime. From analysis comparing cohort data from two censuses, we know that linguistic mobility is very low for both anglophones and francophones (Termote, Payeur et al. 2011). In Quebec, language changes over the life course mainly concern allophones and even among them such transitions are rare past a given age. We adapted the census based cross-sectional method developed by Sabourin and Bélanger (2011) to estimate these transitions. First, those who answered speaking more than one language at home are randomly recoded into the three main categories: francophones, anglophones and allophones. Allophones are then stratified into four groups to take into account specific experiences that may affect their linguistic behavior: Canadian-born allophones, foreign-born allophones arrived at age 15 or younger, foreign-born allophones arrived between age 16 and 35 and foreign-born allophones arrived after the age of 35. Using the number of respondents declaring a non-official language as mother tongue as denominators and the number of those speaking English or French
INTERNATIONAL JOURNAL OF MICROSIMULATION (2014) 7(1) 158-193 171
MAROIS, BÉLANGER Microsimulation Model Projecting Small Area Populations Using Contextual Variables: An Application to the Montreal Metropolitan Area, 2006-2031.
at home as numerators, we computed age-specific (in the case of Canadian-born) or duration-specific (in the case of immigrants) lifetime linguistic shift rates for each group of allophones. Language shifts over the lifetime were rare among foreign-born allophones who arrived at an age older than 16 and, for simplicity, language shifts over the lifetime are assumed to be null for allophone immigrants who landed in Canada at age16 and over. For the other two groups, the following equations, where y is the shift rate and x is the age or the duration (in years) since immigration, provided the best fit to the observed data:
o Canadian-born allophones to French: y = -0.0003x2 + 0.0135x + 0.1334, x = 0 to 14;
o Foreign-born allophones arrived at age 15 or less to French: y = -0.0002x2 + 0.0129x +
0.2188, x = 0 to 29;
o Canadian-born allophones to English: y = 0.0155x + 0.084, x = 0 to 34;
o Foreign-born allophones arrived at age 15 or less to English: y = 0.0055x + 0.0438, x = 0 to 29;
These equations yield estimates of the probability of language shift toward French and English by age (duration). We have limited the length to 35 years for the Canadian-born allophones transition to English, not only because the event is rare after that age, but also because of a cohort effect due to the linguistic policy6.
In addition to lifetime language shifts, there is another kind of language shift called intergenerational language shift. Previous estimates show that a certain proportion of allophones already have another language spoken at home at age 0. Since we don’t have more specific data on this event, we assume that this represents intergenerational shifts. From the regressions’ intercepts, intergenerational language shift are estimated to 13.3% and 8.4% for French and English respectively. These rates are used to allocate a language characteristic to children from allophone mothers in the birth module.
4.4. International emigration event
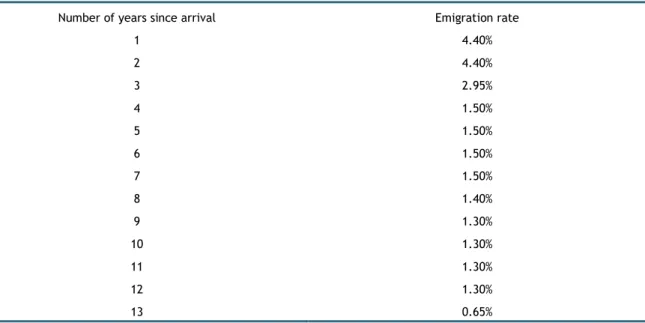
In Canada, international migration is estimated from linked tax files. Although there exist scarce data on this component of population change, we know that it is a rare event and that it concerns mostly recent immigrants. In fact, the number of returning Canadians compensates for the number of Canadian-born emigrants (Michalowski and Tran 2008, Termote, Payeur et al. 2011). Thus, assuming that the net emigration of Canadian-born is null, emigration depends only on the propensity of recent immigrants to leave the country. We thus apply to each cohort of
INTERNATIONAL JOURNAL OF MICROSIMULATION (2014) 7(1) 158-193 172
MAROIS, BÉLANGER Microsimulation Model Projecting Small Area Populations Using Contextual Variables: An Application to the Montreal Metropolitan Area, 2006-2031.
immigrants the emigration rate estimated by Termote, Payeur et al. (2011) (Table 2). Emigration rates are further calibrated using the observed number of international emigrants between 2006 and 2011.
Table 2 Estimated emigration rates of immigrants by years since arrival
Number of years since arrival Emigration rate
1 4.40% 2 4.40% 3 2.95% 4 1.50% 5 1.50% 6 1.50% 7 1.50% 8 1.40% 9 1.30% 10 1.30% 11 1.30% 12 1.30% 13 0.65%
Source: Termote, Payeur et al. 2011. Annualized by authors
4.5. Interprovincial and intraprovincial out-migration events
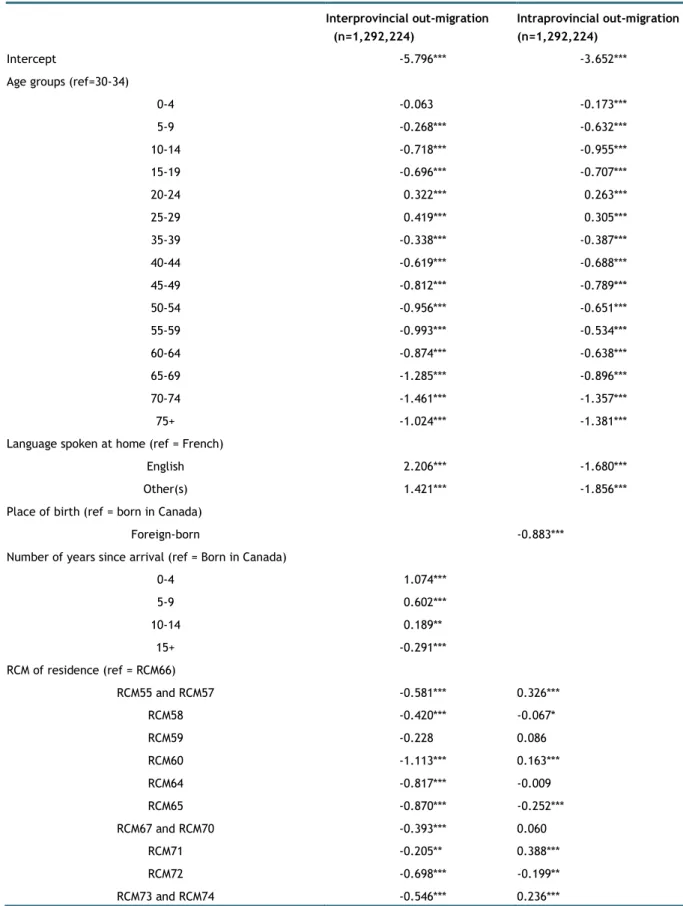
Probabilities for interprovincial and intraprovincial out-migration are calculated from parameters estimated by logistic regressions using the question on place of residence one year ago in the 2001 and 2006 censuses. The event is thus conditional to survive and to stay in Canada. Therefore, this module occurs after death and emigration modules in the model LDS. Results of the regressions are presented in table 3.
INTERNATIONAL JOURNAL OF MICROSIMULATION (2014) 7(1) 158-193 173
MAROIS, BÉLANGER Microsimulation Model Projecting Small Area Populations Using Contextual Variables: An Application to the Montreal Metropolitan Area, 2006-2031.
Table 3 Parameters of interprovincial and intraprovincial outmigration, Montreal Metropolitan Community, 2001 and 2006 Census
Interprovincial out-migration (n=1,292,224)
Intraprovincial out-migration (n=1,292,224)
Intercept -5.796*** -3.652***
Age groups (ref=30-34)
0-4 -0.063 -0.173*** 5-9 -0.268*** -0.632*** 10-14 -0.718*** -0.955*** 15-19 -0.696*** -0.707*** 20-24 0.322*** 0.263*** 25-29 0.419*** 0.305*** 35-39 -0.338*** -0.387*** 40-44 -0.619*** -0.688*** 45-49 -0.812*** -0.789*** 50-54 -0.956*** -0.651*** 55-59 -0.993*** -0.534*** 60-64 -0.874*** -0.638*** 65-69 -1.285*** -0.896*** 70-74 -1.461*** -1.357*** 75+ -1.024*** -1.381***
Language spoken at home (ref = French)
English 2.206*** -1.680***
Other(s) 1.421*** -1.856***
Place of birth (ref = born in Canada)
Foreign-born -0.883***
Number of years since arrival (ref = Born in Canada)
0-4 1.074*** 5-9 0.602*** 10-14 0.189** 15+ -0.291*** RCM of residence (ref = RCM66) RCM55 and RCM57 -0.581*** 0.326*** RCM58 -0.420*** -0.067* RCM59 -0.228 0.086 RCM60 -1.113*** 0.163*** RCM64 -0.817*** -0.009 RCM65 -0.870*** -0.252*** RCM67 and RCM70 -0.393*** 0.060 RCM71 -0.205** 0.388*** RCM72 -0.698*** -0.199** RCM73 and RCM74 -0.546*** 0.236*** * p<0.05. ** p<0.01; *** p<0.0001.
INTERNATIONAL JOURNAL OF MICROSIMULATION (2014) 7(1) 158-193 174
MAROIS, BÉLANGER Microsimulation Model Projecting Small Area Populations Using Contextual Variables: An Application to the Montreal Metropolitan Area, 2006-2031.
To validate the model, we compared the number of out-migrants observed by municipality in the 2001 and 2006 Census separately with the number resulting from the average of five probabilistic simulations using the estimated parameters. The projected numbers are usually close to the observed numbers for both interprovincial and intraprovincial out-migrants. Relative differences can be important for small municipalities with few observed out-migrants, but expected numbers are in the same range.
In a first step, we use these parameters in a simulation for the period 2006-2011. Probabilities were then calibrated to ensure that the number of out-migrants simulated for the MMC corresponds to the observed numbers. The calibration factor is 0.761 and 1.162 for interprovincial and intraprovincial out-migrants, respectively. Those factors are then maintained for the rest of the projection.
4.6. Internal migration events
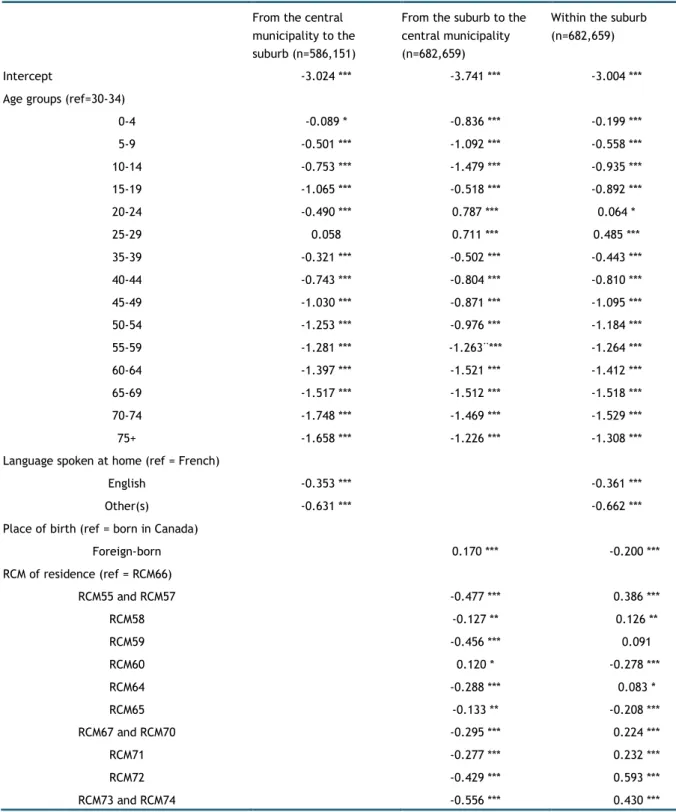
Probabilities to move from the central municipality to a suburban municipality, between suburbs or from a suburban municipality to the central municipality are estimated using logistic regressions on pooled data of the 2001 and 2006 censuses. Table 4 presents the estimated parameters from these models.
INTERNATIONAL JOURNAL OF MICROSIMULATION (2014) 7(1) 158-193 175
MAROIS, BÉLANGER Microsimulation Model Projecting Small Area Populations Using Contextual Variables: An Application to the Montreal Metropolitan Area, 2006-2031.
Table 4 Parameters of logistic regressions modeling internal outmigration between municipalities of the Montreal Metropolitan Community, 2001 and 2006
From the central municipality to the suburb (n=586,151)
From the suburb to the central municipality (n=682,659)
Within the suburb (n=682,659)
Intercept -3.024 *** -3.741 *** -3.004 ***
Age groups (ref=30-34)
0-4 -0.089 * -0.836 *** -0.199 *** 5-9 -0.501 *** -1.092 *** -0.558 *** 10-14 -0.753 *** -1.479 *** -0.935 *** 15-19 -1.065 *** -0.518 *** -0.892 *** 20-24 -0.490 *** 0.787 *** 0.064 * 25-29 0.058 0.711 *** 0.485 *** 35-39 -0.321 *** -0.502 *** -0.443 *** 40-44 -0.743 *** -0.804 *** -0.810 *** 45-49 -1.030 *** -0.871 *** -1.095 *** 50-54 -1.253 *** -0.976 *** -1.184 *** 55-59 -1.281 *** -1.263¨*** -1.264 *** 60-64 -1.397 *** -1.521 *** -1.412 *** 65-69 -1.517 *** -1.512 *** -1.518 *** 70-74 -1.748 *** -1.469 *** -1.529 *** 75+ -1.658 *** -1.226 *** -1.308 ***
Language spoken at home (ref = French)
English -0.353 *** -0.361 ***
Other(s) -0.631 *** -0.662 ***
Place of birth (ref = born in Canada)
Foreign-born 0.170 *** -0.200 *** RCM of residence (ref = RCM66) RCM55 and RCM57 -0.477 *** 0.386 *** RCM58 -0.127 ** 0.126 ** RCM59 -0.456 *** 0.091 RCM60 0.120 * -0.278 *** RCM64 -0.288 *** 0.083 * RCM65 -0.133 ** -0.208 *** RCM67 and RCM70 -0.295 *** 0.224 *** RCM71 -0.277 *** 0.232 *** RCM72 -0.429 *** 0.593 *** RCM73 and RCM74 -0.556 *** 0.430 *** * p<0.05. ** p<0.01; *** p<0.0001.
Estimated parameters are consistent with previous theoretical and empirical studies on intrametropolitain mobility (Glick 1947, Rossi 1955, Landale and Guest 1985, South and Crowder 1997, Kim, Horner et al. 2005, Æro 2006, Turcotte and Vézina 2010, Marois and Bélanger 2013, Marois and Bélanger 2014). They highlight the importance of age and ethnocultural variables as determinants of intrametropolitain mobility. The variable about the
INTERNATIONAL JOURNAL OF MICROSIMULATION (2014) 7(1) 158-193 176
MAROIS, BÉLANGER Microsimulation Model Projecting Small Area Populations Using Contextual Variables: An Application to the Montreal Metropolitan Area, 2006-2031.
RCM of residence shows that, even when controlling for population composition, some differences still remain between regions, meaning that a specific geographical component exists. As we did for modeling interprovincial and intraprovincial out-migrations, we also validated our model for internal migration by comparing the number of migrants observed by municipality in the 2001 and 2006 Census separately with the average number resulting from five probabilistic simulations for the same years using those parameters. Simulated numbers are in most cases in the same range as the observed and when the relative differences are large, it is for small municipalities with few migrants.
In the microsimulation, internal migration occurs after the events "death", "interprovincial and intraprovincial out-migration" and "emigration". Eventual co-occurrence of events "migration to the central municipality" and "migration to another suburb" are dealt with randomly. The municipality of residence for those who move to or within the suburb is subsequently determined by the residential location module.
4.7. External migrants modules
External migrants, meaning international immigrants, interprovincial in-migrants and intraprovincial in-migrants are not modeled as events because the population at risk is not simulated. For each of these types of in-migrants, a separate database of potential newcomers with their characteristics was created. Assumptions on the annual number for each of these types of in-migrants comes from the official population projection from the Institut de la statistique du
Québec, themselves determined from observations for 2006 to 2011 and from recent trends for
the following years (Institut de la statistique du Québec 2009). The assumption is that the number of new entries in the model is about 96,500 per year which is about 40,000 international immigrants, 10,500 interprovincial in-migrants and 46,000 intraprovincial in-migrants moving on the MMC territory. Characteristics of these in-migrants are randomly imputed using a cold deck procedure based on a database of potential in-migrants created from the population living in the MMC at the 2006 Census, but elsewhere five years before. Assuming that external migrants arrive in the middle of the period, they are subject to half the risks of experiencing the other events during the year of their arrival. Finally, the residential location module (described below) assigns their municipality of residence.
4.8. Residential location modules
INTERNATIONAL JOURNAL OF MICROSIMULATION (2014) 7(1) 158-193 177
MAROIS, BÉLANGER Microsimulation Model Projecting Small Area Populations Using Contextual Variables: An Application to the Montreal Metropolitan Area, 2006-2031.
settling in the suburb and to external migrants settling in the whole metropolitan area. Since migrants have different preferences according to their origin, five separate modules are required, one for each of the categories of individuals to relocate: (1) people moving from the central municipality (2) people moving from another suburb (3) international immigrants (4) interprovincial in-migrants and (5) intraprovincial in-migrants. These modules are a practical application of the random utility approach that we applied in a previous study of residential location in the Montreal metropolitan area (Marois and Bélanger 2014, Forthcoming), which includes contextual variables as determinants of the choice of the municipality of residence. For each of the municipality’s characteristics, parameters are estimated using conditional logistic regressions. The municipality of destination is then probabilistically allocated as a function of these parameters.
We estimate the regression parameters using data from the question on the place of residence one year ago of the 2001 and 2006 censuses. Independent variables of the regression model are: the distance between the municipality and the downtown, the population size, the type of municipality (either village, town or city), the annual number of new housings7, the main linguistic
group defined as a binary variable (either francophone or not) and the regional county municipality (RCM) of the municipality. This last variable is used to take into account certain individual choices, such as the preference of international immigrants to first locate on the Montreal island. Table 5 shows parameters resulting from our regressions.
INTERNATIONAL JOURNAL OF MICROSIMULATION (2014) 7(1) 158-193 178
MAROIS, BÉLANGER Microsimulation Model Projecting Small Area Populations Using Contextual Variables: An Application to the Montreal Metropolitan Area, 2006-2031.
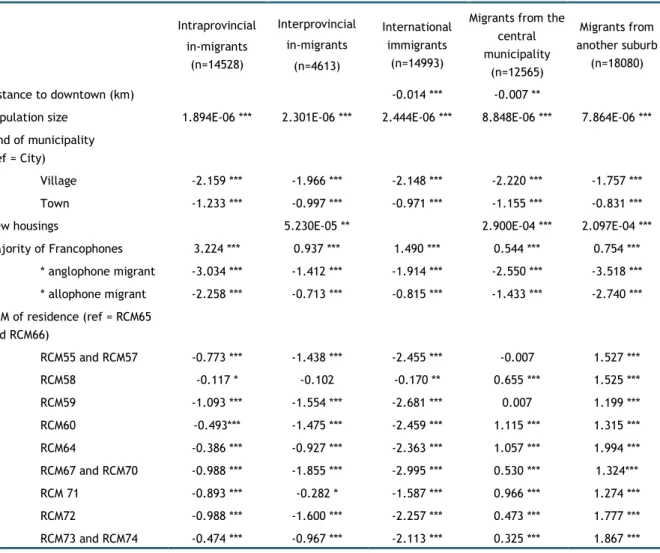
Table 5 Parameters of conditional logistic regressions modeling the municipality of destination for internal and external migrants, Montreal Metropolitan Community,
2001 and 2006 Censuses Intraprovincial in-migrants (n=14528) Interprovincial in-migrants (n=4613) International immigrants (n=14993)
Migrants from the central municipality (n=12565) Migrants from another suburb (n=18080) Distance to downtown (km) -0.014 *** -0.007 **
Population size 1.894E-06 *** 2.301E-06 *** 2.444E-06 *** 8.848E-06 *** 7.864E-06 *** Kind of municipality
(ref = City)
Village -2.159 *** -1.966 *** -2.148 *** -2.220 *** -1.757 *** Town -1.233 *** -0.997 *** -0.971 *** -1.155 *** -0.831 ***
New housings 5.230E-05 ** 2.900E-04 *** 2.097E-04 ***
Majority of Francophones 3.224 *** 0.937 *** 1.490 *** 0.544 *** 0.754 *** * anglophone migrant -3.034 *** -1.412 *** -1.914 *** -2.550 *** -3.518 *** * allophone migrant -2.258 *** -0.713 *** -0.815 *** -1.433 *** -2.740 *** RCM of residence (ref = RCM65 and RCM66) RCM55 and RCM57 -0.773 *** -1.438 *** -2.455 *** -0.007 1.527 *** RCM58 -0.117 * -0.102 -0.170 ** 0.655 *** 1.525 *** RCM59 -1.093 *** -1.554 *** -2.681 *** 0.007 1.199 *** RCM60 -0.493*** -1.475 *** -2.459 *** 1.115 *** 1.315 *** RCM64 -0.386 *** -0.927 *** -2.363 *** 1.057 *** 1.994 *** RCM67 and RCM70 -0.988 *** -1.855 *** -2.995 *** 0.530 *** 1.324*** RCM 71 -0.893 *** -0.282 * -1.587 *** 0.966 *** 1.274 *** RCM72 -0.988 *** -1.600 *** -2.257 *** 0.473 *** 1.777 *** RCM73 and RCM74 -0.474 *** -0.967 *** -2.113 *** 0.325 *** 1.867 *** * p<0.05. ** p<0.01; *** p<0.0001.
Results show the importance of accessibility, housing supply and linguistic composition of the municipality in the choice of the municipality of residence. For each in-migrants category, we compared the expected number of in-migrants using these parameters with the observed number in the 2001 and 2006 censuses. In most cases, expected numbers are in the same range than observed numbers, meaning that our regression models are good predictors of the migrants’ municipality of destination. Accordingly, we use these parameters as projection assumption. However, for some municipalities, the difference between the expected and observed in-migrants can be important, probably because some unobserved variables can influence municipalities’ attractiveness. In these particular cases, we added an adjustment factor to calibrate the model, which highlights the difficulty of conceiving a model that can be applied in all contexts.
The residential location modules take into account municipality’s characteristic that can change over time, therefore LDS updates at the end of each projection year the population size and
INTERNATIONAL JOURNAL OF MICROSIMULATION (2014) 7(1) 158-193 179
MAROIS, BÉLANGER Microsimulation Model Projecting Small Area Populations Using Contextual Variables: An Application to the Montreal Metropolitan Area, 2006-2031.
percentage of francophones which will then be used in the following annual step. Concerning the number of new housings, we use the observed annual number of new housings for the 2006-2011 period (occupied or not) as reported in the 2006 and 2006-2011 censuses. For the years beyond 2011, the projected number of new housings is taken from the 2005 development plan of the MMC which provides estimates of housing development potential for each municipality until 2031.
5. USING THE 2006-2011 PERIOD TO VALIDATE AND CALIBRATE THE MODEL
Our projection starts with the 2006 population, but we have age-municipality specific population estimates for 2011. Therefore, we are using the period 2006-2011 to validate and calibrate the parameters of the model prior to the 2011-2031 projection.
5.1. Completion of assumptions
Out-migration probabilities and municipality-specific fertility rates have to be adjusted from a set of simulations for the period 2006-2011. The population resulting from the first simulation, without any correction, is presented in column 3 of annex 1. The second simulation calibrated the out-migrations probabilities and results are shown in column 4. At the third simulation, we calibrated for the municipality-specific fertility rates. Results are presented in column 5.
5.2. Validation of the model
The last simulation is based on our final and complete assumptions (column 5 of annex 1) and serves to validate our projection model by comparing the projected population with the 2011 population estimates (column 2). Table 6 presents the distribution of municipalities according to the absolute percent error.
Table 6 Distribution of municipalities according to the absolute percent error
[10%, ∞[ 4
[5%, 10%[ 15
[2.5%, 5%[ 21
[0, 2.5%[ 39
The absolute percent error for the whole population is quite low for most municipalities, 39 of the 79 municipalities have an error below 2.5% and 21 have an error between 2.5% and 5%.
INTERNATIONAL JOURNAL OF MICROSIMULATION (2014) 7(1) 158-193 180
MAROIS, BÉLANGER Microsimulation Model Projecting Small Area Populations Using Contextual Variables: An Application to the Montreal Metropolitan Area, 2006-2031.
Overall, the mean absolute percent error is 3.4% and it varies from 0% to 20%. Four municipalities have an error above 10%, but the most populous of them has a population of about 10,000 inhabitants.
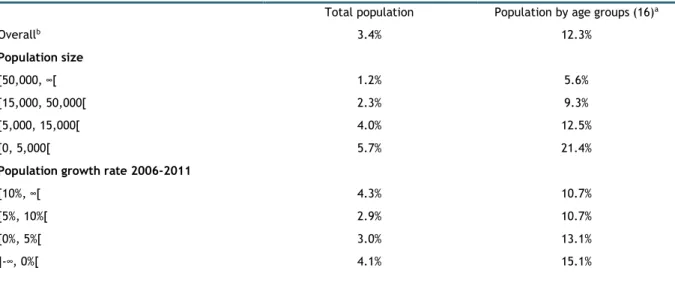
Table 7 Mean absolute percent error between population estimates in 2011 and the simulation by population size and growth rate of the municipality
Total population Population by age groups (16)a
Overallb 3.4% 12.3% Population size [50,000, ∞[ 1.2% 5.6% [15,000, 50,000[ 2.3% 9.3% [5,000, 15,000[ 4.0% 12.5% [0, 5,000[ 5.7% 21.4%
Population growth rate 2006-2011
[10%, ∞[ 4.3% 10.7%
[5%, 10%[ 2.9% 10.7%
[0%, 5%[ 3.0% 13.1%
]-∞, 0%[ 4.1% 15.1%
a: This is the arithmetic mean of the MAPE of 16 age groups; b: This is the arithmetic mean of the MAPE of the 79 municipalities.
As revealed in table 7, the absolute percent error decreases according to the population size, but there is no clear relation between error and population growth rate. The mean absolute percent error appears satisfying since Smith and Shahidullah (1995) found an absolute error range between 17% and 20% for projections over a 10 years period of Florida’s census tracts using different extrapolation technics.
Table 7 also revealed that the absolute percent error is higher when the population is detailed by age groups. Overall, the mean absolute percent error by age groups is 12.3%. Again, it is lower for largest municipalities, but higher than average for the smallest municipalities. Those with a population below 5,000 have a mean absolute percent error of 21.4%, but it concerns very small population groups.
5.3. Calibration of the population
The only database available detailing the population by age, sex, language, immigrant status and municipality of residence is the 2006 Census. The 2011 Census is not yet available to researchers and, moreover, methodological changes make the data less reliable8 and not comparable with
2006 data for statistics related to language (Statistique Canada 2012) or other characteristics. We must therefore exclude this source for calibration. Population estimates from the Institut de la
INTERNATIONAL JOURNAL OF MICROSIMULATION (2014) 7(1) 158-193 181
MAROIS, BÉLANGER Microsimulation Model Projecting Small Area Populations Using Contextual Variables: An Application to the Montreal Metropolitan Area, 2006-2031.
statistique du Québec used to correct the net undercount of the initial census population of 2006
may still serve here, this time taking the 2011 estimates. It provides a complete and reliable source of population estimates by age groups and municipalities which we use to reweight the 2011 resulting population. The average of this weighting variable is 1.02, meaning that the model underestimates the population of the MMC by about 2% before this correction.
6. SIMULATION 2011-2031
Once the 2011 population resulting from the simulation is calibrated with the 2011 population estimates, we can run the 2011-2031 population projection. Results from this simulation are presented in the column 6 of annex 1. Map 2 presents population growth rates by municipality and Table 8 presents a synthesis of the results.
INTERNATIONAL JOURNAL OF MICROSIMULATION (2014) 7(1) 158-193 182
MAROIS, BÉLANGER Microsimulation Model Projecting Small Area Populations Using Contextual Variables: An Application to the Montreal Metropolitan Area, 2006-2031.
Table 8 Synthesis of population projection results, MMC, 2006-2031
Distribution of municipalities by population growth between 2006-2031
[50%, ∞[ 10
[25%, 50%[ 23
[10% , 25%[ 28
[0%, 10%[ 13
]-∞, 0%[ 5
Mean relative growth by initial municipality's population size
[50,000, ∞[ 33.4%
[15,000, 50,000[ 25.9%
[5,000, 15,000[ 23.5%
[0, 5,000[ 26.2%
The projected growth between 2006 and 2031 for the whole MMC is 27.5%, which is consistent with the official population projection (Institut de la statistique du Québec 2010). The projected growth varies widely between municipalities from -38.1% to 82.9%. Municipalities that will have the fastest expected relative growth are located on the North Shore, mostly those which are at the limit of the MMC. These municipalities are new suburbs where the development potential is the largest according to urban plans. Our model predicts low growth for most municipalities on the island of Montreal (RCM66, see Map 1) and in oldest suburbs (RCM58, RCM72 and RCM73), where housing potential development are much lower because the land is already occupied. This shows the importance of this variable in small area population projections. Urban sprawl, however, could be limited by protecting agricultural land and increasing residential density in other parts of the MMC to absorb projected population growth, but this would necessitate major policy changes, which are clearly not in the assumptions of the authors of the urban plans.
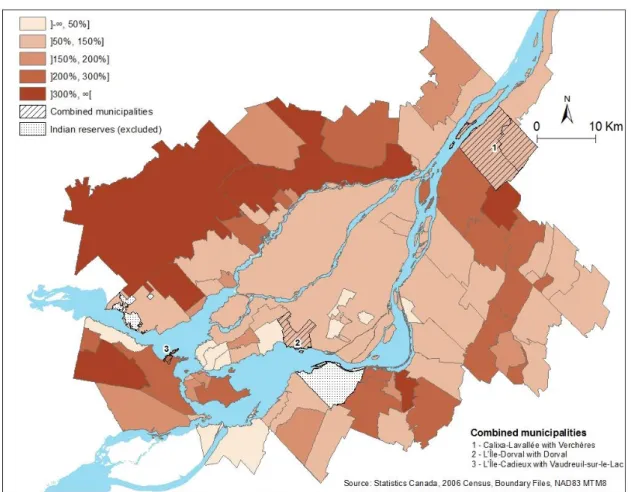
As for the rest of the country, an important population aging is expected in the MMC. Our results show that the proportion of people aged 65 and over will grow from 13.2% in 2006 to 19.2% in 2031. Overall, this age group will increase from about 475,000 people to 893,000 people, or by 88.1%. However, population aging won’t affect all municipalities in the same way. Map 3 displays the projected growth of the population aged 65 and over by municipality and clearly shows rapid population aging in several suburban municipalities. Actually, municipalities that currently or in the near future show fast population growth and are attractive to young families, will see faster population aging. In the future, parents of these families will age in place, while their children will more likely migrate to the central municipalities or elsewhere. As a result, the population aged 65 and over can quadruple in some of them between 2006 and 2031. At the opposite end, because this process of aging-in-place and migration of the youths is already much
INTERNATIONAL JOURNAL OF MICROSIMULATION (2014) 7(1) 158-193 183
MAROIS, BÉLANGER Microsimulation Model Projecting Small Area Populations Using Contextual Variables: An Application to the Montreal Metropolitan Area, 2006-2031.
completed in the central municipality and in the oldest suburbs of the inner ring, the future growth of the elderly population will be relatively much smaller.
Figure 3 Projected growth of the population aged 65 and over by municipality, MMC, 2006 to 2031
The main advantage of microsimulation is that it can generate results along several dimensions, such as linguistic characteristics in this case. In the Montreal context, where the spatial distribution of population by language groups is the subject of constant debates (Termote, Payeur
et al. 2011), it should be of interest to look at projected results by language.
Table 9 presents the distribution of municipalities according to the relative rate of change in the proportion of francophones from 2006 to 2031. Overall, for the whole MMC, the proportion of francophones declines from 69.7% in 2006 to 63.8% in 2031, a loss of 6 percentage points, which is consistent with a similar projection for the Montreal metropolitan area (Termote, Payeur
et al. 2011). The range of the variation varies from -28.3 to 17.1 percentage points. Our results
show that the proportion of francophones will decline in 65 of the 79 municipalities. This is mainly caused by the low fertility of Canadian-born population and high immigration of non-francophones. At the opposite, our projection predicts an increase of the proportion of
INTERNATIONAL JOURNAL OF MICROSIMULATION (2014) 7(1) 158-193 184
MAROIS, BÉLANGER Microsimulation Model Projecting Small Area Populations Using Contextual Variables: An Application to the Montreal Metropolitan Area, 2006-2031.
francophones in 14 municipalities.
Table 9 Distribution of municipalities according to the relative rate change in the proportion of francophones (percentage points), 2006 to 2031
Distribution of municipalities according to the relative rate change in the proportion of francophones (percentage points), 2006 to 2031 [0, ∞[ 14 [-5, 0[ 12 [-10, -5[ 11 [-15, -10[ 33 ]-∞, -15[ 9 7. CONCLUSION
Small area population projections are subject to particular challenges. One of them is to take into account local conditions that may affect future population growth, particularly through residential moblity. In this study, we present a dynamic time-based microsimulation model, called LDS, that includes, among others variables, the planned number of new houses and the distance from downtown as determinants of residential location for internal and external migrants to project the population of the Montreal Metropolitan Community’s municipalities. Furthermore, it takes into account the particular context of Montreal as the only metropolis in North America that is the home of a large francophone community and is receiving a large influx of immigrants from diverse origins and languages. We thus add to our model differential behaviors according to linguistic groups for mobility, residential location and reproduction, so the model can also project population at a local level by language groups.
Many small area projection models exist, but the one developed in this paper innovates in its treatment of mobility. We used conditional logistic regressions to estimate parameters used as assumptions of the residential location module. The method allowed for the implementation of the effect of contextual variables such as planned new housings from urban development plans, socio-demographic composition and of geographical location as determinants of future residential location process. Moreover, concerning the socio-demographic composition of the population, we develop LDS with a specific interest to linguistic variable which is an important issue in the Montreal metropolitan area context, but its methodology could be transposed to other variables, such as family composition, race or ethnicity which are also parameters that determinate mobility.
INTERNATIONAL JOURNAL OF MICROSIMULATION (2014) 7(1) 158-193 185
MAROIS, BÉLANGER Microsimulation Model Projecting Small Area Populations Using Contextual Variables: An Application to the Montreal Metropolitan Area, 2006-2031.
Like all models, our model has some limits. The parameters used to model residential location performs generally well, but for some municipalities, the discrepancy can be important and parameters were subject to some calibration. Another limit concerns the geographic scale. For a large city like Montreal, projections at the neighbourhood level might be useful, but the Census question on place of residence one year ago does not allow the analysis of mobility at a finer geographical scale than the municipality.
This small area population projection model reveals some trends that could challenge public policies. One of them is the continuous urban sprawl implied mostly by the urban development plans used as assumptions. Municipalities with the fastest expected growth are located far from the core, where farm and forest lands still exist. The second challenge concerns the investment in local infrastructure to face the aging of the population. Municipalities where the elderly population is expected to grow the fastest are those that nowadays attract young families. In the next decades, their infrastructure might need to be adapted for this changing population. Another result from our projections which can be of concern to policy-makers is the relative decline of the French community, which will be generalized in most of the MMC. As the language most commonly spoken in the neighbourhood is an important determinant of linguistic integration of allophones (Carpentier 2004), the relative decline of French in most municipalities could therefore be an obstacle to the adoption of French by the fast-growing foreign-born population.
INTERNATIONAL JOURNAL OF MICROSIMULATION (2014) 7(1) 158-193 186
MAROIS, BÉLANGER Microsimulation Model Projecting Small Area Populations Using Contextual Variables: An Application to the Montreal Metropolitan Area, 2006-2031.
ANNEX 1
Table Results from simulations and population estimates
Population estimates Results from 2006-2011 pre-simulations 2006 2011 No adjustment Out-migration assumption adjusted Fertility assumption adjusted Results from 2011-2031 simulation (1) (2) (3) (4) (5) (6) Montréal 3,570,100 3,791,100 3,758,132 3,781,745 3,783,223 4,553,217 Baie-D'Urfé 3,900 3,930 3,828 3,620 3,850 4,151 Beaconsfield 19,255 20,330 19,557 20,269 20,332 24,016 Beauharnois 12,000 12,235 11,117 11,145 11,186 12,523 Beloeil 19,135 20,465 20,944 20,852 20,581 25,210 Blainville 47,025 53,165 52,059 51,757 51,568 63,538 Boisbriand 26,700 26,485 26,791 26,823 26,855 29,541 Bois-des-Filion 8,455 9,450 9,591 9,540 9,321 12,165 Boucherville 39,275 41,570 41,073 41,176 41,254 46,811 Brossard 71,765 80,235 79,763 80,580 79,432 95,579 Candiac 16,145 19,575 18,691 18,739 19,259 28,188 Carignan 7,545 8,020 7,989 7,637 8,009 9,414 Chambly 22,880 25,440 23,549 23,677 23,673 27,527 Charlemagne 5,670 5,775 5,621 5,697 5,965 6,480 Châteauguay 43,140 46,330 45,417 46,167 45,391 55,330 Contrecoeur 5,740 6,290 6,081 6,190 6,050 7,531 Côte-Saint-Luc 31,450 33,550 31,945 32,539 32,228 36,989 Delson 7,410 7,555 7,591 7,828 7,942 9,348 Deux-Montagnes 17,615 17,545 18,025 17,946 17,902 19,191 Dollard-Des Ormeaux 49,240 50,825 47,372 48,929 49,166 50,313 Dorval and L'Île-Dorval 18,185 19,250 19,197 19,253 18,999 23,112
Hampstead 6,995 7,500 7,382 7,179 7,531 8,585 Hudson 5,120 4,890 4,532 4,882 5,411 3,169 Kirkland 20,575 21,215 21,043 21,251 20,973 23,788 La Prairie 22,040 23,975 23,569 23,364 23,098 28,357 L'Assomption 16,940 19,755 19,531 20,132 19,993 29,545 Laval 372,415 404,110 403,016 400,079 401,717 521,664 Léry 2,420 2,325 2,622 2,456 2,793 3,265 Les Cèdres 5,810 5,960 5,959 6,009 5,546 6,765 L'Île-Perrot 10,105 10,595 10,774 10,460 10,708 13,003 Longueuil 231,585 236,755 236,858 235,889 235,395 249,684 Lorraine 9,685 9,420 9,437 9,461 9,439 9,780 Mascouche 34,305 40,960 41,288 40,776 41,969 59,383 McMasterville 5,290 5,520 5,459 5,784 5,429 6,656 Mercier 10,250 11,585 10,346 10,309 10,201 13,789 Mirabel 35,310 41,165 41,083 40,087 41,053 56,790 Montréal 1,638,870 1,723,940 1,704,182 1,734,634 1,733,374 2,070,328
INTERNATIONAL JOURNAL OF MICROSIMULATION (2014) 7(1) 158-193 187
MAROIS, BÉLANGER Microsimulation Model Projecting Small Area Populations Using Contextual Variables: An Application to the Montreal Metropolitan Area, 2006-2031. Montréal-Est 3,865 4,010 3,963 3,910 3,903 4,088 Montréal-Ouest 5,225 5,395 5,095 5,171 5,250 6,143 Mont-Royal 18,995 20,225 20,156 20,462 19,720 21,950 Mont-Saint-Hilaire 15,865 17,410 18,671 18,438 18,194 23,341 Notre-Dame-de-l'Île-Perrot 10,030 10,430 9,826 10,153 10,099 10,910 Oka 3,310 3,700 3,373 3,510 3,252 4,031 Otterburn Park 8,580 8,470 8,613 8,502 8,260 9,527 Pincourt 11,375 13,690 12,928 12,456 12,793 13,812 Pointe-Calumet 6,645 6,455 7,148 6,425 6,754 7,386 Pointe-Claire 30,275 31,875 30,383 30,974 29,832 34,251 Pointe-des-Cascades 1,045 1,195 1,204 1,200 1,240 1,745 Repentigny 77,035 81,275 82,040 80,413 80,882 88,566 Richelieu 5,240 5,335 5,477 5,359 5,617 6,336 Rosemère 14,290 14,070 14,244 13,741 13,989 13,993 Saint-Amable 8,510 10,620 9,799 9,531 9,968 14,756 Saint-Basile-le-Grand 15,825 16,550 17,025 16,027 16,511 19,267 Saint-Bruno-de-Montarville 24,515 25,965 25,842 25,518 24,908 27,933 Saint-Constant 24,250 24,990 25,173 24,929 25,065 27,644 Sainte-Anne-de-Bellevue 5,235 5,425 5,415 5,743 5,408 7,110 Sainte-Anne-des-Plaines 13,165 13,730 12,769 12,909 12,888 13,204 Sainte-Catherine 16,405 16,885 17,435 17,620 17,383 22,110 Sainte-Julie 29,380 29,095 28,180 28,296 28,318 27,663 Sainte-Marthe-sur-le-Lac 11,485 14,840 13,341 12,841 13,595 12,816 Sainte-Thérèse 25,490 26,140 27,346 27,774 27,067 34,930 Saint-Eustache 42,610 43,525 44,060 42,886 43,773 48,375 Saint-Isidore 2,520 2,640 2,765 2,662 2,821 3,332 Saint-Jean-Baptiste 3,060 3,090 3,017 3,127 3,047 3,286 Saint-Joseph-du-Lac 5,035 6,245 6,437 6,730 6,490 9,209 Saint-Lambert 21,660 22,015 23,242 23,040 22,953 22,794 Saint-Lazare 17,260 18,980 19,040 19,279 19,452 24,881 Saint-Mathias-sur-Richelieu 4,570 4,465 4,376 4,579 4,523 4,691 Saint-Mathieu 1,890 1,990 1,929 1,823 1,827 2,173 Saint-Mathieu-de-Beloeil 2,315 2,545 2,398 2,524 2,763 3,327 Saint-Philippe 5,180 5,630 6,015 6,073 5,921 8,717 Saint-Sulpice 3,355 3,290 3,441 3,414 3,244 3,818 Senneville 980 985 897 1,107 974 967 Terrasse-Vaudreuil 2,000 1,925 2,034 1,895 1,958 2,031 Terrebonne 96,175 106,310 106,699 104,761 106,534 171,084 Varennes 21,175 20,680 22,028 21,518 21,476 23,841 Vaudreuil-Dorion 26,195 32,555 32,178 32,107 32,080 47,454 Vaudreuil-sur-le-Lac and L'Île-Cadieux 1,425 1,490 1,551 1,630 1,426 1,768
Verchères and
Calixa-Lavallée 5,835 5,995 6,161 6,332 6,313 8,022
Westmount 20,580 21,280 21,136 21,240 21,159 18,427
INTERNATIONAL JOURNAL OF MICROSIMULATION (2014) 7(1) 158-193 188
MAROIS, BÉLANGER Microsimulation Model Projecting Small Area Populations Using Contextual Variables: An Application to the Montreal Metropolitan Area, 2006-2031.
REFERENCES
Æro, T. (2006). 'Residential Choice from a Lifestyle Perspective.' Housing, Theory and Society 23(2): 109-130.
Ballas, D., G. P. Clarke and E. Wiemers (2005a). 'Building a dynamic spatial microsimulation model for Ireland.' Population, Space and Place 11(3): 157-172.
Ballas, D., D. Rossiter, B. Thomas, G. Clarke and D. Dorling (2005b). 'Geography Matters: Simulating the Local Impacts of National Social Policies'. J. R. Foundation. York, University of Leeds: 132.
Bélanger, A. and S. Gilbert (2002). 'La fécondité des immigrantes et de leurs filles au Canada'.
Rapport sur l’état de la population du Canada. Ottawa, Statistique Canada: 135-161.
Bélanger, A. and É. C. Malenfant (2005). 'Projecting the ethnocultural composition of the population using a microsimulation model'. Social Statistics Speakers Series Montreal, University McGill.
Bergouignan, C. (2010). 'Projections démographiques localisées: une réflexion sur la compatibilité des démarches.' Cahiers de démographie locale: 9-32.
Birkin, M. and M. Clarke (1989). 'The Generation of Individual and Household Incomes at the Small Area Level using Synthesis.' Regional Studies 23(6): 535-548.
Bourbeau, R. (2002). 'L’effet de la « sélection d’immigrants en bonne santé » sur la mortalité canadienne aux grands âges.' Cahiers québécois de démographie 31(2): 249-274.
Brunet, M. (1955). Canadians et Canadiens. Étude sur l’histoire et la pensée des deux Canadas. Montréal et Paris, Fides.
Cameron, M. P. and J. Poot (2011). 'Lessons from stochastic small-area population projections: the case of Waikato subregions in New Zealand.' Journal of Population Research 28(2-3): 245-265. Carpentier, A. (2004). 'Tout est-il joué avant l’arrivée? Étude de facteurs associés à un usage
prédominant du français ou de l’anglais chez les immigrants allophones arrivés au Québec adultes', Conseil supérieur de la langue française.
INTERNATIONAL JOURNAL OF MICROSIMULATION (2014) 7(1) 158-193 189
MAROIS, BÉLANGER Microsimulation Model Projecting Small Area Populations Using Contextual Variables: An Application to the Montreal Metropolitan Area, 2006-2031.
sur la santé 7(4): 37-50.
Chi G, Zhou X and Voss P (2011) ‘Small-area population forecasting in an urban setting: a spatial regression approach’. Journal of Population Research, 28(2-3) pp 185-201.
Dittgen, A. (2008). 'Pourquoi et comment tenir compte du logement dans les projections de populations locales.' Cahiers de démographie locale: 99-114.
Feijten, P. and C. H. Mulder (2002). 'The Timing of Household Events and Housing Events in the Netherlands: A Longitudinal Perspective.' Housing Studies 17(5): 773-792.
Foss, W. (2002). 'Small area population forecasting.' Appraisal Journal 70(2): 163-172.
Fréchette, L., D. Desmarais, Y. Assogba and J.-L. Paré (2004). 'L’intégration des jeunes à la ville : une dynamique de repérage spatial et social'. La migration des jeunes. Aux frontières de l’espace et du
temps. L. P. and M. Molgat. Québec, es Presses de l’Université Laval: 81-105.
Frey, W. H. and F. E. Kobrin (1982). 'Changing families and changing mobility: Their impact on the central city.' Demography 19(3): 261-277.
Glaeser, E. L., J. Kolko and A. Saiz (2001). 'Consumer city.' Journal of Economic Geography 1(1): 27-50.
Glick, P. C. (1947). 'The Family Cycle.' American Sociological Review 12(2): 164-174.
Hamilton, C. H. and J. Perry (1962). 'A Short Method for Projecting Population By Age from One Decennial Census to Another.' Social Forces 41(2): 163-170.
Harding, A., Y. Vidyattama and R. Tanton (2011). 'Demographic change and the needs-based planning of government services: projecting small area populations using spatial microsimulation.' Journal of Population Research 28(2-3): 203-224.
Institut de la statistique du Québec (2009). 'Perspectives démographiques du Québec et des régions, 2006-2056, Édition 2009'. Québec, Institut de la statistique du Québec.
Institut de la statistique du Québec (2010). 'Projection de la population des municipalités, 2009-2024'.