HAL Id: hal-01769836
https://hal.archives-ouvertes.fr/hal-01769836
Submitted on 6 Nov 2018HAL is a multi-disciplinary open access archive for the deposit and dissemination of sci-entific research documents, whether they are pub-lished or not. The documents may come from teaching and research institutions in France or abroad, or from public or private research centers.
L’archive ouverte pluridisciplinaire HAL, est destinée au dépôt et à la diffusion de documents scientifiques de niveau recherche, publiés ou non, émanant des établissements d’enseignement et de recherche français ou étrangers, des laboratoires publics ou privés.
Amorphous magnesium silicate synthesized by
precipitation
Marie Dietemann, Fabien Baillon, Fabienne Espitalier, Philippe Accart,
Rachel Calvet, Mike Greenhill Hooper
To cite this version:
Marie Dietemann, Fabien Baillon, Fabienne Espitalier, Philippe Accart, Rachel Calvet, et al.. Amor-phous magnesium silicate synthesized by precipitation. SFGP 2011 -13ème Congrès de la Société Française de Génie des Procédés, Nov 2011, Lille, France. 7 p. �hal-01769836�
Synthèse de silicate de magnésium amorphe par précipitation.
Amorphous magnesium silicate synthesized by precipitation.
DIETEMANN Mariea*, BAILLON Fabiena, ESPITALIER Fabiennea, ACCART Philippea, CALVET Rachela et GREENHILL-HOOPER Mikeb
aUniversité de Toulouse, Mines Albi, CNRS, Centre RAPSODEE
Campus Jarlard, F-81013 Albi cedex 09, France
bRio Tinto Minerals
2 Place E. Bouillères, 31036 TOULOUSE, France
Résumé
L’objectif de l’étude est de développer un procédé de synthèse de silicate de magnésium par précipitation. Ce procédé sera une alternative au procédé de broyage du talc naturel. Il devra permettre de synthétiser un produit présentant des propriétés impossibles à obtenir, à ce jour, avec le procédé de broyage, notamment une taille de particule inférieure au micron. L’influence de différents paramètres du procédé (mode et ordre d’addition des réactifs, concentrations des réactifs et ultrasons) sur les propriétés du produit est étudiée. Le produit synthétisé est très aggloméré et sensible aux ultrasons. L’addition des réactifs par l’intermédiaire d’un prémélangeur, associée aux ultrasons et à des réactifs peu concentrés, permet de synthétiser le produit le plus fin.
Abstract
This study objective is to develop a process of magnesium silicate synthesis made by precipitation. This is the first step in the synthesis of synthetic talc by a process that will be an alternative to the milling of natural talc. The resultant product will have properties that are not possible to obtain with the milling process, in particular particle size smaller than one micrometer. The influence of different process parameters (reactants’ addition mode and order, reactants’ concentrations and ultrasound) on product properties is studied. Reactants’ addition by the mixing system, with ultrasound and low reactants’ concentrations resulted in a product with the smallest particles.
Mots-clés: silicate de magnésium, talc, précipitation, taille, agglomération. Key-words: magnesium silicate, talc, precipitation, size, agglomeration.
1. Introduction
The plastic and rubber industries are very interested in natural talc because it can be used as a high performance filler in polymers. According to Ciesielczyk et al. (2010), it improves their properties by delivering excellent mechanical reinforcement and barrier effects. In order to get a good dispersion in a polymer matrix, particles should be, in an ideal case, nano-sized (Martin et al., 2006). But with conventional milling processes, it’s difficult and expensive to obtain particles smaller than one micrometer. The aim of this work is to develop a process that would be an alternative to milling. This process is a synthesis of nano-sized magnesium silicate particles. These amorphous particles can be used as directly as filler particles or converted in a separate second step into crystalline lamellar nano-sized particles with a talc-like structure.
2. Experimental
2.1 MaterialsThe product is synthesized by a precipitation, according to the following equation (Martin et al., 2006): 4 Na2OSiO2, 5 H2O + 3 MgCl2, 6 H2O + 2 HCl → Si4Mg3O11n(H2O) + 8 NaCl + H2O
In this study, 4.6<n<4.85. Aqueous solutions of magnesium chloride, called reactant 2, and of sodium metasilicate, called reactant 1, are used (supplier Prolabo). Different concentrations are tested for both solutions, but molar ratio Mg/Si is always 0.75, corresponding to that of natural talc. Hydrochloric acid 1M is added in aqueous solution of magnesium chloride in order to maintain stoichiometry of reaction (supplier Prolabo). The used water is demineralised.
2.2 Procedures and methods
2.2.1 Synthesis of magnesium silicate
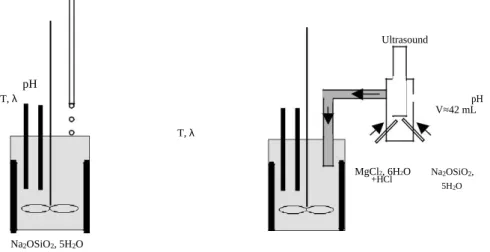
The synthesis is made in a 1L tank with a top stirrer and four baffles. All experiments are conducted at room temperature and at a stirring speed of 500 rpm. Three addition modes are tested (Fig.1). The first mode, called slow addition, involves drop by drop addition of magnesium chloride solution to sodium metasilicate solution already introduced in the tank. The second mode, called fast addition, involves fast addition of one reactant to the other which is already in the tank. Fast addition is not depicted in Figure 1 because materials are the same as slow addition. The only difference is that magnesium chloride solution is added instantaneously. In the third mode, both solutions are added in parallel to the tank by a Y-shaped mixing system (H≈6 cm, D≈4 cm). Solutions are fed to the mixing system using peristaltic pumps. Rates and speed of flow are 125.25 g.min-1 and 0.30 m.s-1 for sodium metasilicate solution and 81.30 g.min-1 and 0.19 m.s-1 for magnesium chloride solution. Mixing occurs inside the system at the exit of pipes which come from pumps. An ultrasound probe can be added to the mixing system in order to destroy flocs formed during the contact of reactants. The tank is before filled with 100 mL of demineralised water.
The influence of reactants’ addition mode, addition order and reactants’ concentrations on product properties is studied. MgCl2, 6H2O+HCl Ultrasound pH T, λ pH V≈42 mL T, λ MgCl2, 6H2O Na2OSiO2, +HCl 5H2O Na2OSiO2, 5H2O
Figure 1: Experimental schemes of slow addition (on the left) and of parallel addition by a mixing system (on the right).
At the end of the synthesis, the suspension is filtered with a Büchner-membrane system and the cake is washed four times with water in order to eliminate salt formed during the synthesis. Then the product is dried at 100°C during 12 hours. As the dried product is very agglomerated, it’s then milled.
2.2.2. Properties of synthetic magnesium silicate
During the synthesis, conductivity, temperature and pH of the suspension are measured. The suspension and the synthesized powder are submitted for physical chemistry analysis. Particle size distribution of
samples of the suspension is determined using Malvern Mastersizer 2000 with the dynamic light scattering technique. This enables particle size distribution to be followed during the synthesis.
Samples of dried products are examined by scanning electron microscopy (SEM-FEG, Philips XL 30) in order to define surface morphology and agglomeration state of particles.
BET specific surface area is estimated using nitrogen adsorption/desorption isotherms and a Micrometrics ASAP 2010 K2 apparatus. Meso-porous volume is calculated by using the Barret, Joyner and Halenda method (B.J.H. method) on the desorption field of the adsorption/desorption isotherm. Micro-porous volume is calculated by using the Horvath-Kawazoe method (H. –K. method) with split pore geometry on the adsorption field of the adsorption/desorption isotherm.
Density of dried products is measured using a Micrometrics AccuPyc 1330 helium pycnometer.
Disaggregation tests are made to study product behaviour dispersed in different solvents and to simulate its behaviour in a polymer matrix. This test, made in the granulometer, is described in the US patent (US 6,610,261 B1) deposited by the Compagnie Générale des Etablissements Michelin in 2003. A dried synthetic magnesium silicate is dispersed in a solvent. Four solvents are tested: water, sunflower oil, squalane and dodecane. During this test, the evolution of the median diameter is measured as a function of time. At the beginning of the test, three consecutive measurements are made without ultrasound to determine the initial diameter. Then the ultrasound generation is set at a power of 100%. (around 3 mW) The median diameter is measured every 10 seconds during 8 minutes.
3. Results and discussion
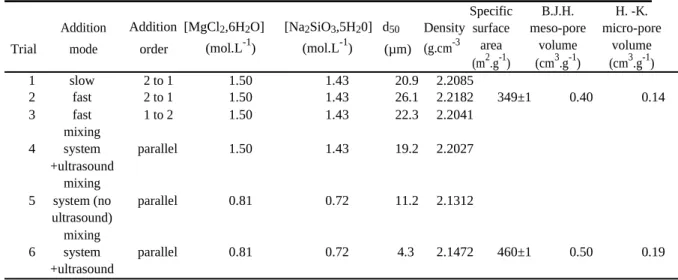
The Table 1 summarizes solid properties (d50, density, specific surface area and pore volumes) as a
function of operating conditions. The product densities seem to be independent of studied operating conditions: 2.1853±0.0365 g.cm-3.
Table 1: Physical properties of synthetic magnesium silicates.
Trial
Addition Addition [MgCl2,6H2O] [Na2SiO3,5H20] d50 Density
mode order (mol.L-1) (mol.L-1) (µm) (g.cm-3
Specific B.J.H. H. -K. surface meso-pore micro-pore
area volume volume
(m2.g-1) (cm3.g-1) (cm3.g-1) 1 slow 2 to 1 1.50 1.43 20.9 2.2085 2 fast 2 to 1 1.50 1.43 26.1 2.2182 349±1 0.40 0.14 3 fast 1 to 2 1.50 1.43 22.3 2.2041 mixing 4 system parallel 1.50 1.43 19.2 2.2027 +ultrasound mixing
5 system (no parallel 0.81 0.72 11.2 2.1312
ultrasound) mixing
6 system parallel 0.81 0.72 4.3 2.1472 460±1 0.50 0.19
+ultrasound
All synthesized solids are amorphous, whatever studied process parameters. Diffractograms (Fig. 2) don’t present any real peack, only a large initiation of a peak at 46.5°2θ . It’s difficult to exploit it because of its low density.
Figure 2: Diffractogram of a product (addition
mode: parallel with mixing system, CMgCl2,6H2O=0.81 mol/L) get by X-Ray diffraction at 0.154 nm (Cu)
(measurement step=0.0334 °2theta; duration measurement=50 secondes).
3.1 Agglomeration state of the powder
Synthetic magnesium silicate is made up of agglomerates (Fig. 3): the powder is very agglomerated. Amorphous magnesium silicate may be made up of secondary agglomerates (Fig. 3A) made up of primary spherical agglomerates made up of primary particles (Fig. 3B-C-D). The dynamic light scattering measures primary and secondary agglomerates sizes. Measured d50 isn’t the size of primary particles.
SEM analysis would show that primary particles size is about 100 nm but this measure is very approximate. This structure is not influenced a lot by process parameters: whatever reactants’ addition mode and order and reactants’ concentrations, the product is made up of these two kinds of agglomerates. Therefore, primary particles might be smaller with mixing system and ultrasound (Fig. 3D). With the mixing system, the product seems to be more compact.
A B C D
7
1 µm
Figure 3: SEM analysis of products synthesized by slow addition (A and B), fast addition (C) and with mixing system and ultrasound (D).
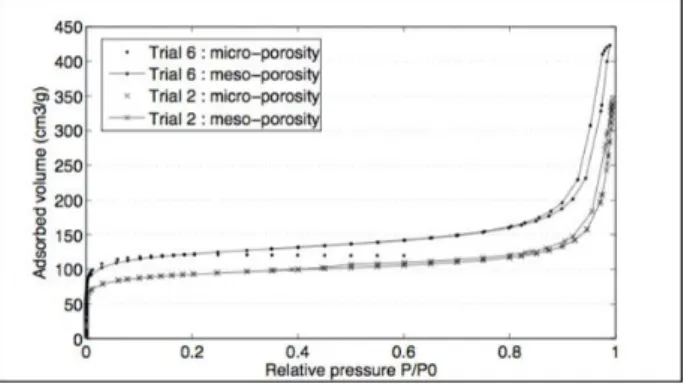
Figure 4 shows that both products have micro-pores: gas is absorbed at very low relative pressures. The mean diameter of micro-pore is about 0.5 nm. Both products present only an inter primary agglomerates meso-porosity. Meso-pores might be inside secondary agglomerates, between primary agglomerates whereas micro-pores might be inside primary agglomerates, between primary particles. The meso-pore diameter is 3.5 nm for sample 2 and 24.16 nm for sample 6. The structure of secondary agglomerates is deformed under capillary condensation of nitrogen. The hysteresis observed for the sample 6 is probably due to this inter-granular porosity. Secondary agglomerates of sample 6 present a more rigid structure than those of sample 2.
Figure 4: Adsorption/desorption isotherms of products 2 and 6 (Table 1).
Figure 5 shows that ultrasound, applied during the size measurement, influences particle size distribution of the product. The sizes distributions are shifted towards fine particle sizes after ultrasound use. Ultrasound causes disaggregation of the solid. Over two minutes of ultrasound use, agglomerate size distribution doesn't change any more. Every sample, presented in this paper, is subjected to ultrasound in the granulometer during two minutes.
Whatever process parameters, particle size distribution doesn’t seem to be influenced by the time. In all experiments, a weak shift of size distributions towards large particle sizes is observed (Fig. 6). It would be due to agglomeration of solid particles in the synthesis vessel.
Figure 5 (on the left): Ultrasound influence on particle size distribution (addition mode: slow addition,
CMgCl2,6H2O=1.50 mol/L).
Figure 6 (on the right): Sampling time influence on particle size distribution (addition mode: parallel addition with
mixing system, CMgCl2,6H2O=0.81 mol/L). Samples are taken of every 2 minutes and, after the end of reactant’addition,
every 15 minutes
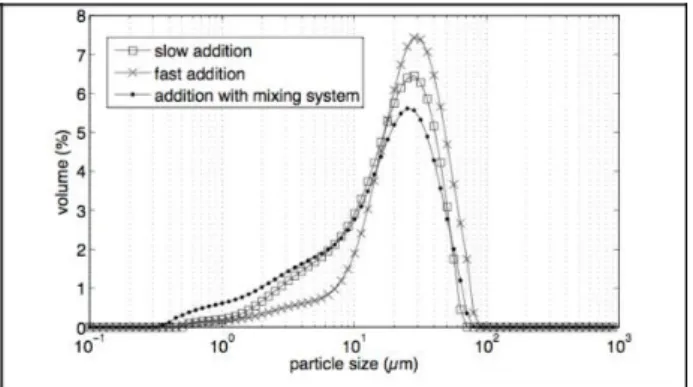
3.2 Influence of reactants’ addition mode
The smallest particles seem to be synthesized by addition with the mixing system (Fig. 7). The three particle size distributions have the same width (700 nm-80 µm) but with the addition with mixing system, particle size distribution is composed of smaller particles under 7 µm. With the fast addition, the particle size distribution shows less agglomerates under 10 µm but more agglomerates between 10 and 100 µm. These differences may be due to the micromixing effect.
Figure 7: Particle size distributions as a function of the addition modes (CMgCl2, 6H2O=1.50 mol/L, samples taken of
after 90 minutes).
3.3 Influence of ultrasound used during the synthesis
At low reactants’ concentrations, particles made by parallel addition with mixing system are smaller when ultrasound are used during the synthesis (Fig. 8). Particle size distributions are very different. With ultrasound during the pre-mixing, particles are smaller than 20 µm as against 100 µm without ultrasound.
Figure 8: Particle size distributions as a function of ultrasound used during the synthesis (addition mode: parallel with mixing system, CMgCl2, 6H2O=0.81 mol/L, samples taken of after 90 minutes).
3.4 Influence of reactants’ concentrations
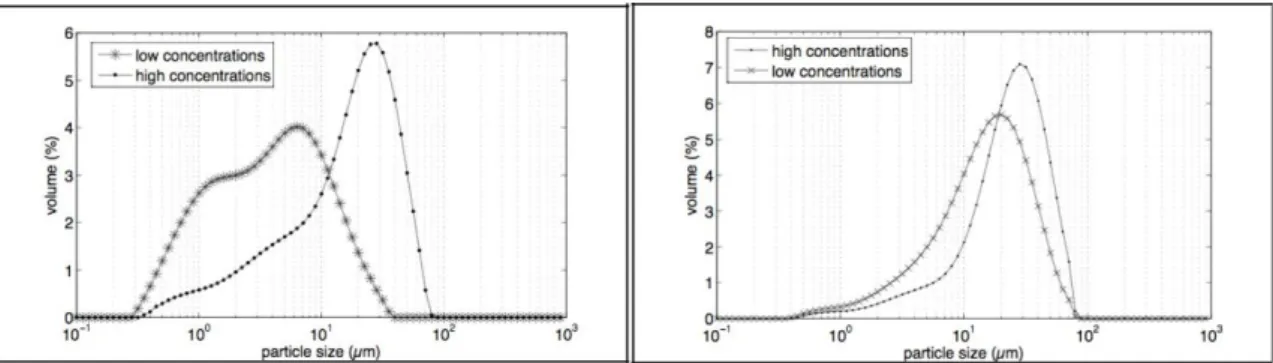
At high reactants’ concentrations, the particle size distribution obtained with the mixing system and ultrasound is almost the same as distribution got with no mixing system (Fig. 9, on the left). Smaller agglomerates are synthesized with low reactants’ concentrations. The same tendency is observed with the fast addition (Fig. 9, on the right). With the highest concentrations, the supersaturation is higher, so the number of synthesized particles increases, agglomeration phenomena is more important and agglomerates are bigger. Therefore by increasing concentrations and so supersaturation, primary particles may be smaller. This result has been observed by Zauner et al. (2000) and confirmed by Baldyga and Jones (2007). So with the highest concentrations, synthesized particles may be more agglomerated but smaller.
Figure 9: Particle size distributions as a function of reactants’ concentrations (On the left: addition mode: parallel with mixing system and ultrasound, CMgCl2,6H2O=0.81 mol/L and 1.50 mol/L, samples taken of after 210 minutes; on the right: addition mode: fast addition, CMgCl2,6H2O=0.78 mol/L and 1.50 mol/L, samples taken of after 210 minutes).
3.5 Influence of reactants’ addition order
Reactants’ addition order has a weak influence on particle size distribution: a weak shift of size distribution towards large particles sizes is visible with addition of reactant 2 to reactant 1.
3.6 Disaggregation of the powder
Synthetic magnesium silicate disperses better in water than in the other solvents (Fig. 10). In water, at the end of the dispersion test, agglomerates size is almost the same than agglomerates size in suspension at the end of the synthesis (Table 1). So the synthesized product disperses well in water, that is to say in a polar solvent. On the contrary, its disaggregation is poor in non-polar solvents and virtually impossible in dodecane: an aggregation is observed instead of dispersion.
Figure 10: Disaggregation tests of a magnesium silicate (addition mode: slow addition, CMgCl2, 6H2O=1.50 mol/L) in
different solvents (water, sunflower oil, squalane, dodecane).
Secondary agglomerates might be fragile because of meso-pores that would exist inside them, that would explain easy disaggregation of powder in polar solvents. Adsorption analysis are in progress in order to confirm this hypothesis.
4. Conclusions
The formation of magnesium silicate is instantaneous. The synthesis length depends on the addition mode (from few minutes with the mixing system to one hour and half with the slow addition). The amorphous solid obtained is made up of two kinds of agglomerates (primary and secondary). The size distributions are very dependent on mixing conditions and reactants’ concentrations. The parallel addition with mixing system would enable to synthesize the product made up of smaller particles and agglomerates. Moreover, low concentrations and ultrasound used during the synthesis would enable to synthesize smaller particles too. The measured smallest size is about 4 µm but it should be agglomerates size. Primary particles size is difficult to estimate but it would be about 100 nm. A study perspective is to make product disaggregation in the polymer easy and to “release” small primary particles in order to reach the objective size. Moreover by decreasing reactants’ concentrations, synthetic product is less compact. The dried product disperses best in polar solvents. The product appears to be hydrophilic.
References
Baldyga J., Makowski L., Orciuch W., Double-feed semibatch precipitation – Effects of mixing, Trans IchemE 85, 745-752 (2007).
Ciesielczyk F., Krysztafkiewicz A., Bula K., Jesionowski T., Evaluation of synthetic magnesium silicate as a new polymer filler, Composite Interfaces 17, 481-494 (2010).
Custodero E., Simonot L., Tardivat J.-C. – United States Patent (US 6,610,261 B1 – 2003) - Reinforcing aluminum-based filler and rubber composition comprising such a filter.
Martin F., Ferret J., Lebre C., Petit S., Grauby O., Bonino J.-P., Arseguel D., Decarreau A., Ferrage E. – Brevet industriel Français (FR 2 903 682 A1 – 2006) – Procédé de préparation d’une composition de talc synthétique à partir d’une composition de kerolites.
Zauner R., Jones A.G., Mixing effects on product particle characteristics from semi-batch crystal precipitation, IchemE 78, 894-902 (2000).
Acknowledgements
The authors acknowledge the Agence Nationale de la Recherche for the financial support of ANR-09-MAPR-0017 project. The authors also thank Ms S. Del Confetto, Ms C. Rolland and Ms S. Patry for specific surface area measurements, microscopy analysis and X-Ray diffraction analysis.