UNIVERSITÉ DE LILLE
FACULTÉ DE MÉDECINE HENRI WAREMBOURG
Année :2020T H È S E P O U R L E D I P L Ô M E D ' É T A T D E D O C T E U R E N M É D E C I N E
Facteurs prédictifs de pathologie Alzheimer, inférée d’après le profil des biomarqueurs du liquide cérébro-spinal, chez des patients porteurs de troubles
neurocognitifs vasculaires au centre mémoire de Lille.
Présentée et soutenue publiquement le 23 septembre 2020 à 16h00
Au Pôle Recherche
Par Aymeric WITTWER
_______________
JURY
Présidente:
Madame le Professeur Florence PASQUIER
Assesseurs :
Madame le Professeur Charlotte CORDONNIER
Monsieur le Docteur Gregory KUCHCINSKI
Directrice de thèse :
Madame le Docteur Marie-Anne MACKOWIAK-CORDOLIANI
- 1 -
La Faculté n'entend donner aucune approbation aux opinions émises
dans les thèses : celles-ci sont propres à leurs auteurs.
- 2 -
Table of contents
Glossary ... 3 Abstract... 6 Introduction ... 7 Methods ... 14Cerebrospinal fluid analysis ... 16
Baseline characteristics ... 17
Neuropsychological assessment ... 18
MRI evaluation ... 19
1. Large vessel infarcts and intracerebral hemorrhage ... 20
2. Cerebral small vessel diseases biomarkers ... 21
3. Strategic lesions ... 22 4. Pattern of atrophy ... 22 Results ... 24 Flow chart ... 24 Baseline characteristics ... 25 Neuropsychological data ... 26 MRI data ... 28
1. Large vessel infarcts and intracerebral hemorrage ... 28
2. Cerebral small vessel diseases biomarkers ... 29
3. Strategic lesions ... 29
4. Pattern of atrophy ... 31
Focus on a specific etiology: the cerebral amyloid angiopathy ... 32
Discussion ... 33
Conclusion ... 38
References ... 39
- 3 -
GLOSSARY
AD: Alzheimer’s disease
CAA: Cerebral amyloid angiopathy
CADASIL: Cerebral Autosomal Dominant Arteriopathy with Subcortical infarcts and Leukoencephalopathy
CMB: Cerebral microbleed
CSF: Cerebrospinal fluid
CSS: Cortical superficial siderosis
DRS: Dementia rating scale
DWH: Deep white matter hyperintensities
FAB: Frontal assessment battery
ICH: Intracerebral Hemorrhage
MMSE: Mini Mental State Examination
MRI: Magnetic Resonance Imagery
PVH: Periventricular hyperintensities
RL-RI 16: Rappel libre-rappel indicé 16 items
VaD: Vascular dementia
VAT: Visual association test
- 4 -
ABSTRACT
Background: Vascular cognitive impairment (VCI) represents the second cause of
dementia after Alzheimer’s Disease (AD). These two pathologies are frequently associated, defining mixed dementias (MD). In France, in 2020, the clinician currently relies on the cerebro-spinal fluid (CSF) biomarkers to prove in vivo the pathological process of AD in clinical routine. However, lumbar puncture is not always easily available and may be contra-indicated by frequent ongoing antithombotic treatments in those population. The aim of our study was to identify, in patients diagnosed with VCI, which clinical, neuropsychological and radiological features are correlated to associated AD lesions, inferred from the CSF
biomarkers profile.
Methods: In a monocentric cohort from the Lille memory clinic, we included patients with
last diagnosis retained of MD or VCI, and whose the CSF biomarkers were available. Then we defined 2 profiles of CSF based on the analysis of biomarkers: VCI-CSF and MD-CSF. We used bivariate analysis to compare clinical, neuropsychological, and MRI features (with a rigorous analysis of cerebrovascular diseases biomarkers and atrophy pattern) between patients with VCI-CSF and MD-CSF.
Results: 76 patients have been included, 45 (59%) with MD-CSF profile et 31 (41%) with
VCI-CSF. Those with VCI-CSF presented lower Frontal Assessment Battery (FAB) raw scores (p = 0.003) and had a higher proportion of pathologic scores at the Dementia Rating Scale (DRS) conceptualization subscale (p = 0.0091). The distribution of cerebrovascular disorders markers did not differ between the two groups. Patients with VCI-CSF were likely to harbor global cerebral atrophy (p = 0.01) whereas those with MD-CSF presented a significantly right-sided parietal atrophy (p = 0.04).
Conclusion: Our results suggest that patients with VCI present worse dysexcutive
impairment than those with MD, and that the pattern of atrophy differs between the two pathologies. Prospective cohorts with standardized batteries of test and MRI reading plan are mandatory to answer this major diagnostic and therapeutic issue and maybe establish clinico-radiological scores predictive of the CSF profile when the sample is not possible.
- 5 -
INTRODUCTION
Because the risk of dementia increases with age, as life expectancy has improved, dementia has become an important public health problem and a major social and economic burden. According to current estimates, almost 36 million people are having dementia worldwide, and this number is expected to reach 66 million by 2030 and 115 million by 2050 (1).
Vascular dementia (VaD) and vascular cognitive impairment (VCI) result from cerebrovascular disorders responsible for brain parenchymal lesions
determining an impairment of cerebral functions. Vascular dementia represents the leading cause of dementia after Alzheimer’ disease (AD), accounting for about 15-20% of dementias in developed countries. The prevalence of VaD in the European population older than 65 years is estimated at 1.6%, versus 4.4% for AD. The prevalence of both VaD and AD rises exponentially with age, with the risk of VaD doubling every 5.3 years (2). The prevalence of VCI, which includes milder forms of cognitive impairment who do not met criteria of dementia (that is, without loss of functional independency), have been estimated by the Canadian Study of Health Aging at 5% in general population over 65 years (3).
Dementia related to cerebrovascular disorders has been first described by Mc Menemey in the early 1960’s, who labeled it “atherosclerotic dementia”, as it was originally conceived as an arteriosclerotic disorder arising from diffuse low cerebral perfusion (4).
Following the progresses of neuropathology studies, multiple large and small vessels lesions, parenchymal ischemic as well as hemorrhagic patterns have been
- 6 -
highlighted. The term “vascular cognitive disorders” encompasses multiple clinical and pathological entities:
Post stroke dementia or post stroke cognitive impairment refers to the cognitive disorders which are highlighted after stroke. Prevalence of post-stroke dementia approaches 15% to 30% of post-stroke survivors, and rises with age, and stroke recurrences (5, 6, 7)
Multiple infarct dementia: the occurrence of multiple small or large infarcts has long been recognized as a cause of dementia. Larger infarct volumes and a higher number of territorial infarcts are associated with worse cognitive performances and higher risks of dementia. However, there is no definite threshold for an overall volume of damaged parenchyma required for the occurrence of VCI or VaD (8, 9,10) .
Strategic infarct dementia: More important than the volume of the infarct is its location. A single small infarct may cause severe cognitive deficits when located in an eloquent functional region, (ie a lacunar infarct in the left
thalamus may lead to severe verbal episodic memory impairment). Results of clinical-pathological studies have been summarized by Jellinger (8, 9), who proposed in his neuropathological classification to define a strategic lesion when involving the thalamus, the caudate nucleus, the mesial temporal lobe, angular or cingulated gyri.
Subcortical vascular encephalopathy, sometimes referred as Biswanger’s disease, which associates extensive and confluent white matter
hyperintensities (WMH) and, in variable levels, other biomarkers of small vessel disease such as lacunar infarcts, cerebral micro infarcts, cerebral micro bleeds (CMB) or enlargement of perivascular spaces (EPVS). The nature and
- 7 -
the topography of those biomarkers may directly reflect the underlying microangiopathy (8, 9,10).
The two most frequent sporadic microangiopathies are:
The deep perforating vasculopathy, in which patients are more likely to harbor lacunar infarcts and EPVS in the deep white matter and basal ganglias (11)
And cerebral amyloid angiopathy (CAA), characterized by extensive WMH with a posterior predominance, EPVS in subcortical regions (11, 12) strictly cortico-subcortical CMB and /or the presence of cortical superficial siderosis (CSS). (11)
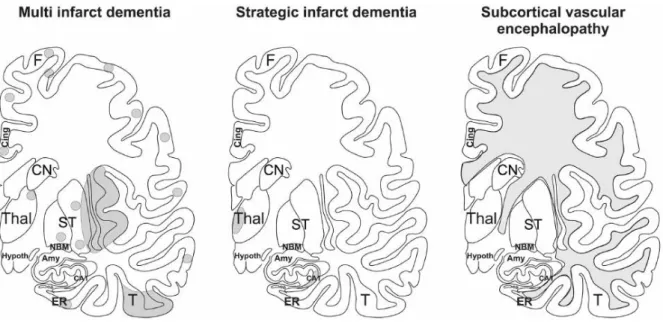
Other genetic microangiopathies, such as CADASIL (Cerebral Autosomal Dominant Arteriopathy with Subcortical Infarcts and Leukoencephalopathy) may be considered as the prototype of a subcortical vascular impairment (13). The 3 pathological patterns described above are schematized in Figure n°1.
Hemorrhagic dementia: Giving the high mortality rates at the acute phase of Intracerebral Hemorrhage (ICH), data were scarce about the occurrence of dementia in ICH survivors. Moulin & al (14) in 2016 first described, in a large monocentric cohort of ICH survivors without pre-existing dementia, a new onset dementia incidence of 14,2 and 28.3% at one year and 4 years of follow-up respectively. The occurrence of dementia was 2 times higher in patients who presented a lobar hemorrhage compared to those presenting with a deep hemorrhage, suggesting a role of CAA in cognitive decline.
- 8 -
Figure n°1: Mechanisms of VCI (extracted from Jellinger, 2013 9)
CN indicates caudate nucleus; Amy amygdala; CA1, Ammon’s horn sector CA1; Cing, cingulate gyrus; ER, entorhinal cortex, F, frontal neocortex; Hypoth, hypothalamus; NBM, basal nucleus; ST , striatum; Thal, thalamus; T, temporal neocortex; Thal, thalamus
VCI is a broad concept that covers mixed pathologies regardless of underlying mechanisms and irrespective of the occurrence of stroke symptoms. Thus, the diagnosis has highly benefited from the progress of cerebral imaging, particularly in patients with no clinical history of stroke.
The first diagnostic criteria edited by the NINDS-AIDRA report (National
Institute of Neurological Disorders and Stroke and the Association Internationale pour la Recherche et I’Enseignement en Neurosciences) (15)
in 1993 defined VaD when the following requirements were met: (1) the patient must be demented; (2) there must be evidence of cerebrovascular disease (history, clinical examination, or brain imaging) and (3) the two disorders must be reasonably related.
However, these guidelines only considered demented patients (thus excluding those with mild cognitive impairment) and required a temporal relation between the
- 9 -
symptoms onset and the occurrence of a stroke, or, in patients with subcortical vascular dementia, a stepwise progression of cognitive deficits.
Hachinski and al (16), for the NINDS and the Canadian Stroke Network, were the first to include mildest forms of cognitive impairment, and to standardize clinical,
neuropsychological and MRI patterns of VCI. The most recent diagnostic criteria developed by Sachdev and al for the VASCog statement, published in 2014 (17), no longer require the presence of memory impairment, a typical feature of AD. Hence, neuropsychological testing should cover at least 4 different cognitive domains. A diagnosis of VaD requires deficits in at least 2 domains, whereas deficits in a single domain are sufficient to diagnose vascular mild cognitive impairment.
The heterogeneity of pathology substratum in VCI suggests that the cognitive deficits will vary according to the brain regions affected and the type of onset of the lesions. For example, a patient who presented a so-called strategic infarction in the left posterior cerebral artery may brutally present deficits in verbal memory and speech disturbances, whereas a patient who harbors extensive white matter hyperintensities and multiple lacunes will be more likely to present an isolated dysexecutive and frontal profile with a progressive worsening.
Despite these heterogeneous presentations, there is substantial evidence to suggest that frontal-executive functions disturbances, rather than memory, is often the most specific feature of VCI and helps to differentiate VCI from AD, particularly in patients presenting with mild cognitive impairment (18, 19, 20).
As vascular lesions may disrupt thalamocortical, striatocortical, and prefrontal-basal ganglia pathways, and thus affect cortical and limbic brain circuits, VCI is often associated with behavioral and emotional disturbances (21). As these neuropsychiatric
- 10 -
features are not specific to vascular etiology, they are not considered as diagnostic items.
Moreover, the classic description of multi-infarct dementia and its acute stepwise or fluctuating decline in cognition is no longer retained in the VASCog statement, given that many patients with VCI do not harbor this clinical picture and show a gradual onset with slow progression, generally associated with small vessel disease.
A challenging issue for clinicians is to differentiate VCI from AD as the natural history and prognosis, as well as symptomatic treatments, are different.
However, several considerations make this distinction difficult:
VCI and AD share the same risk factors: age, hypertension (particularly in mid-life) (22), diabetes mellitus (23), atrial fibrillation (24), carry of the ApoE4 allele (25).
Vascular lesions such as “silent” brain infarctions, WMH, lacunes and CMB are common in the general population (26, 27, 28) and may not be considered straightaway in cause of a cognitive deficit.
A large part (about one third) of post-stroke dementia are associated with underlying unknown or misdiagnosed AD (5, 6, 29).
CAA, a common microangiopathy responsible for VCI in the elderly, found to be associated up to 96 % of subjects presenting AD pathological lesions
(30)
.
Moreover, the two processes (vascular and degenerative) are frequently associated in the elderly, defining mixed dementia (MD). In clinical pathological
- 11 -
studies, the proportion of MD cases clinically misclassified as VaD was up to 18 to 54%, particularly in the very old (31, 32, 33).
Then, how to differentiate VCI from MD in clinical practice?
Considering neuropsychological profiles, Bruandet and al (34) showed that patients with MD tended to be significantly older than those with VCI. The baseline scores of two global cognitive evaluations (Mini Mental State Examination and Dementia Rating Scale) were highest for VCI compared with MD. Cognitive decline during follow-up was also slowest for isolated VCI. Moreover, in a large autopsy cohort from the Rush Memory and Aging Project (33), after accounting for age, patients with mixed pathology were almost three times more likely to exhibit dementia (rather than no cognitive complain or mild cognitive impairment) compared to those with one pathologic diagnosis, suggesting a cumulative effect of the different lesions.
Another way to distinguish MD from isolated VCI is to look for typical radiological patterns of AD.
AD is typically associated with early medial temporal lobe atrophy (MTA). The presence of MTA on MR imaging improves the discrimination of AD from healthy controls and predicts progression to dementia in patients with mild cognitive impairment (MCI) (35, 36). However, MTA is not a specific pattern and is also present in other causes of dementias, particularly frontotemporal lobar degeneration, vascular cognitive impairment, major psychiatric issues such as bipolar disorder (37).
Occasionally, AD patients present with a striking posterior atrophy pattern, more generally with atrophy of the posterior cingulate gyrus, precuneus and
- 12 -
parietal lobes. Posterior atrophy appears to be characteristic of AD and may help in the distinction from frontotemporal lobar degeneration (37, 38).
¹⁸F-fluorodeoxyglucose (FDG) PET: a scan is suggestive of AD if the pattern of hypometabolism is temporoparietal and posterior cingulate. In a voxel-based multivariate analysis of 18FDG-PET, a hypometabolism in deep gray nuclei, cerebellum, primary cortex, middle temporal gyrus, and anterior cingulate cortex differentiated subcortical VCI from AD with a complete accuracy (39).
The amyloid PET is highly correlated to Aβ neuritis plaques in
radiolo-pathological studies (40) but is not available in daily routine in France, because of a lack of reimbursement from healthcare. Thus, it is mostly used in
diagnostic and therapeutic trials.
The TAU PET is highly correlated to DNF and to the pathologic Braak’s staging (41) but does not have marketing authorization in France yet.
The use of CSF biomarkers has strengthened the link between clinical dementia and AD pathology. Currently, cerebrospinal fluid (CSF) biomarkers are commonly used in memory clinics. The typical profile observed in AD consists in a striking diminution of Aβ142 level, which is correlated with the accumulation of neuritis
plaques and elevation of total Tau (t-Tau) and phosphau Tau (p-Tau) levels, which reflects the neurofibrillary degeneration (42).
The current guidelines of the IGW 2 (43) recommend the presence at least of one amyloid genesis marker, ie diminution of Aβ142 level, and a taupathy marker (ie
- 13 -
A more recent marker, the Aβ142-Aβ140 ratio has been proposed to better reflect the
brain amyloid production, and is useful in case of discrepancy of Aβ142 and t-Tau or
p-Tau levels (typically, a normal Aβ142 level with elevated t-Tau or p-Tau levels) (44) .
Therefore, in 2020, due to the non-availability in the common clinical setting of TAU and amyloid PET, French clinicians rely on the CSF biomarkers to prove the AD pathological process and differentiate MD from VCI.
However, in a population of elderly patients with vascular comorbidities, lumbar puncture may be at risk or contra-indicated because of ongoing antithrombotic therapies, such as dual antiplatelet or anticoagulant treatment. Furthermore, the sample may be technically difficult to obtain, or may be refused by the patient. In those cases, when the proof of the pathophysiological process cannot be obtained, how to differentiate patients with VCI from those with MD ?
The aim of our study was to determine in patients diagnosed with VCI, which clinical, neuropsychological and radiological factors were associated with an associated AD pathological process, inferred from the CSF biomarkers. As a second end point, we attempt to establish, based on those items, a clinic-radiological score that may be predictive of the CSF profile.
Given the strong correlation between AD and CAA, we focused especially on the analysis of the radiological biomarkers of ICH and cerebral small diseases.
- 14 -
METHODS
Our population was extracted from a large monocentric cohort from the Lille University Hospital memory clinic. In a commune database, were pooled consecutive patients of the memory clinic classified as AD, VCI or MD, from 2004 to January the 1st, 2020. Patients may have been referred to the memory clinic because of a
cognitive complaint (coming from themselves or from their relatives), or referred from another medical unit, especially stroke units for a systematic evaluation following a stroke.
All patients benefited at least of one medical evaluation at the memory clinic. If the long term follow-up was ensured at the memory clinic, patients may have variably undergone the following exams: neuropsychological assessment, cerebral MRI, cerebral scintigraphy or 18 FDG PET, CSF biomarkers analysis.
At every medical evaluation, clinical diagnosis was revised according to the clinical and neuropsychological evolution, CSF and imagery findings and was classified according to the current guidelines as:
Probable AD (in the absence of CSF biomarkers) when the patient fulfilled the Mc Kahn criteria for probable AD (45)
Probable AD post biomarkers (in the presence of CSF biomarkers) when the patient fulfilled the McKahn criteria for probable AD with evidence of the
pathophysiological process (45), or those of the IWG 2 for typical or atypical AD
(43).
Certain AD when an autosomal dominant mutation in the PSEN1, PSEN2, APP genes was highlighted or when the neuropathology (autopsy) confirmed the diagnosis.
- 15 -
Probable VCI when the patient fulfilled the current VASCog criteria and in the absence of arguments for an associated AD (17).
Certain VCI when the neuropathology (autopsy) confirmed the diagnosis. Probable MD if the patient met the criteria for probable AD or probable AD
post biomarkers and probable VCI. The current guidelines (43, 45) describes etiologically mixed presentations when they meet all core clinical criteria for AD dementia but has evidence of a concomitant cerebrovascular disease, defined by a history of stroke temporally related to the onset or worsening of cognitive impairment; or the presence of multiple or extensive infarcts or severe WMH burden.
Certain mixed dementia when the neuropathology (autopsy) confirmed the diagnosis.
We used in our study all the data collected in this cohort until the January 1st, 2020.
To be included in our study, all the patients must have fulfilled the following items:
Last diagnosis retained: VCI or MD Availability of the CSF biomarkers
Availability of a neuropsychological assessment and a 3T cerebral MRI
The three examinations above must have been achieved in a maximum period of two years.
- 16 - CSF analysis:
All CSF analysis were performed at the Lille University Hospital Neurobiology department. The parameters were the levels of t-Tau, p-Tau and Aβ142. The
techniques and thus the normative values used by the laboratory have changed over the years: since in 2004, the dosages were manually performed with ELISA
immunologic techniques. Since September 2010 we used the recipient file
SARSTEDT 62.610.201 then the technique of detection was secondarily automatized with acquisition of the Lumipulse technique since January 2019.
The cut-offs used by the Lille neurobiology department are summarized in the table n°1.
Table n° 1: Cut-offs for the CSF parameters at the Lille university Hospital neurobiology department
Period t-Tau (pg/mL) p-Tau
(pg/mL) Aβ1-42 (pg/mL) Aβ1 42-Aβ140 ratio
Before September the 1st, 2010
< 300 if aged 21 to 50 years < 400 if aged 51 to 70 years < 500 if aged ≥ 71 years
< 50 > 500 > 0. 06
Between September the 1st,2010 to December the 31th, 2018
< 400 < 60 > 700 > 0.06
Since January the 1st, 2019
< 525 < 73 > 615 > 5.6%
In our study, and conformingly to the IGW 2 criteria, we considered a CSF profile as evocative of AD if:
the level of Aβ142 was diminished, or if the Aβ142-Aβ140 ratio was under the
cut-off at the time the CSF was sampled
AND if the level of t-Tau and/or p-Tau was/were elevated beyond the cutoff at the time the CSF was sampled
- 17 -
In all other situations, the CSF profile was considered as non-evocative of AD.
By extension, in our study, patients presenting a CSF profile evocative of AD were referred as MD-CSF patients, the others were referred as VCI-CSF patients.
Baseline characteristics
We collected relevant clinical data that may have an impact on cognitive functions: demographics, vascular risk factors, history of stroke, sleep apnea syndrome, or epilepsy.
Concerning the demographics, the current age at which the CSF fluid sample was performed, the gender, and level of education (assessed by the number of years of education) were reported.
Vascular risk factors were reported. We defined:
Arterial hypertension (HTN) was defined as a blood pressure value > 140/90 mmHg measured at rest on two separate assessments, or current
antihypertensive therapy.
Diabetes mellitus (DM) as a fasting blood glucose level > 7 mmol/L on two separate measurements, or a current antidiabetic therapy.
Dyslipidemia as an LDL cholesterol elevation ≥ 1.6 g/L and/or a triglyceride level ≥ 1.5 g/L and/or current of a lipid-lowering treatment.
Obesity as a current body mass index (BMI) ≥ 30 kg/m². Tobacco intoxication as a current or past tobacco use.
Heavy alcohol intake as a current or past daily alcohol intake ≥ 30 g for men, ≥ 20 g for women.
- 18 -
Sleep apnea syndrome as an Apnea-Hypopnea Index ≥ 15/hour (thus
including the usual definition of moderate and severe sleep apnea syndrome).
Concerning the relevant medical history, we reported:
Atrial fibrillation (past or current)
Epilepsy as the presence of a current or past epileptic syndrome or disease Peripheral Arterial Disease and ischemic heart disease
Ischemic stroke and history of probable TIA, regardless of their etiologies Spontaneous ICH, ie, without traumatic of apparent malformative cause.
Neuropsychological assessment
Firstly, we collected the available scores for three simples scales used in daily routine for cognitive screening:
The Mini mental status examination (MMSE) score, a 30-points scale worldwide used to assess global cognitive efficiency at patient’s bedside (46)
. The Frontal Assessment Battery (FAB), originally known in French as the
Batterie Rapide d’Efficience Frontale) (47), a 18-points scale, used for
assessing frontal functions, such as lexical fluency and inhibitory control. The test of 5 mots de Dubois, which allows a rapid evaluation of verbal
memory, and has been validated as accurate to discriminate AD from other dementias. (48)
Secondly, we collected the available scores for three worldwide-used scales, the first for a global cognitive performance assessment, and the two followings evaluated episodic memory on its two facets (verbal and non-verbal).
- 19 -
The Mattis dementia rating scale (DRS), a global scale on 144 points, designed to assess global cognitive efficiency, divided in five sub-scales (49). The total score, and the scores in the attention, initiation, construction, conceptualization and memory subscales were reported. A score was considered pathologic under the 5th percentile.
The French version of 16-items free and Cued Recall procedure (Rappel Libre – Rappel Indicé 16 items/ RL-RI 16), developed by Grober and
Buschke (50) in 1987, adapted by Van der linden and al (51) which ensures semantic processing and coordinates encoding and retrieval has been shown to be very sensitive to an early diagnosis of AD. We used the French
normative data developed by Amieva and al (52) to assess the performance of each patient. A score was considered pathologic under the 5th percentile. The sensitivity to cueing was described as a percentage, and considered pathologic under the 10th percentile. When the patient was too demented to pass the test, leading to a precipitate abandon, he was considered to have a pathologic sensitivity to cueing.
The Visual Association Test (VAT), a brief learning task based on imagery mnemonics. The test materials consist of six line drawings of pairs of
interacting objects or animals. This test has been validated to distinguish patients with AD from other types of dementia, particularly VaD (53).A score was considered as pathologic under the 5th percentile.
MRI evaluation:
All patient underwent a cerebral 3T MRI. The protocol must have included at least 3 keys sequences: Fluid Attenuation Inversion Recovery (FLAIR), T2 weighed
- 20 -
gradient echo (GRE) and 3D T1 weighed. Given the retrospective design and differences in protocols of images acquisition, the thickness of the slices and the additional sequences may have varied from a patient to another.
We established a systematic reading plan of the cerebral MRI, following this four-part analysis: report of large vessel infarctions and ICH, analysis and profile of small vessel diseases biomarkers, assessment of strategic lesions, cerebral atrophy pattern. All images were evaluated by a neurologist blinded of the CSF profile.
1. Assessment of large vessel infarct and ICH:
We reported previous cerebral infarctions:
Previous supra-tentorial large vessel infarct, in the anterior cerebral artery (ACA), middle cerebral artery (MCA), posterior cerebral artery (PCA) and anterior Choroidal artery (AChoA) territory, regardless of their deep or superficial topography-
Previous infra-tentorial large vessel infarct, that we divided in two categories: those involving the PICA territory, the other involving other territories of large vessels : antero inferior cerebellar artery (AICA) and cerebellar superior artery (CSA)
Supratentorial ICH were classified as:
lobar when the main bulk of the hemorrhage was centered in the cortical grey matter and/or the underlying subcortical white matter
deep when the main bulk of the hemorrhage was centered in the basal ganglia and the deep white matter (internal and external capsules)
- 21 -
When the ICH was restricted to the cerebellum we classified them according the criteria proposed by Pasi and al (54):
lobar when the main bulk of the hemorrhage was centered in the superficial cerebellar cortex or at the junction of the cortex and the underlying white matter
deep when the main bulk of the hemorrhage was centered in the deep cerebellum, involving deep cerebellar grey nuclei and white matter
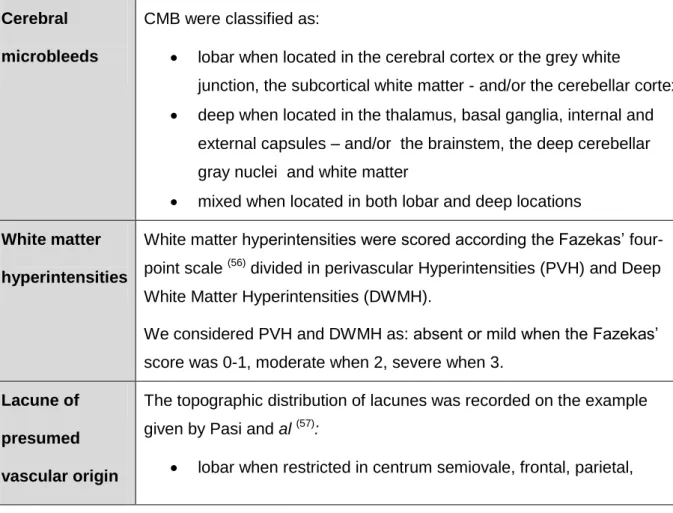
2. Assessment of cerebral small vessel diseases biomarkers
CMB, lacunes of presumed vascular origin, WMH were defined on the STRIVE consensus criteria by Wardlaw and al (55) (Shown in supplemental material n°1).
Table n° 2: Criteria of classification small vessel diseases biomarkers
Cerebral microbleeds
CMB were classified as:
lobar when located in the cerebral cortex or the grey white
junction, the subcortical white matter - and/or the cerebellar cortex
deep when located in the thalamus, basal ganglia, internal and external capsules – and/or the brainstem, the deep cerebellar gray nuclei and white matter
mixed when located in both lobar and deep locations
White matter hyperintensities
White matter hyperintensities were scored according the Fazekas’ four-point scale (56) divided in perivascular Hyperintensities (PVH) and Deep White Matter Hyperintensities (DWMH).
We considered PVH and DWMH as: absent or mild when the Fazekas’ score was 0-1, moderate when 2, severe when 3.
Lacune of presumed vascular origin
The topographic distribution of lacunes was recorded on the example given by Pasi and al (57):
- 22 -
insular, temporal, and occipital lobes
deep when restricted in thalamus, basal ganglia, internal and external capsule, infratentorial
mixed when located in both lobar and deep locations
CSS was defined according the criteria of Charidimou (58) and al and considered as focal when involving < 4 sulci, disseminated when involving ≥ 4 sulci
EPVS were not included in this assessment, given that a T2-weighed sequence was not available in most of the patients.
3. Assessment of strategic lesions:
We defined a strategic lesion according to the classification by Jellinger (8) as a cerebral infarction, intracerebral hemorrhage or lacune located or involving the thalamus, the caudate nucleus, the medial temporal lobe, the angular gyrus, the fronto cingulate gyrus. All strategic lesions were reported.
4. Assessment of cerebral atrophy:
The global and focal cerebral atrophy were all assessed on visual radiologic scales reported in Table n°3.
- 23 -
Table n° 3: Criteria of cerebral atrophy in our study
Global cerebral atrophy
The Evan’s index measures the ratio between the maximal diameter between frontal horns of lateral ventricles and maximal biparietal diameter on the same slice. Formerly used as a diagnostic criterion for ventriculomegaly in normal pressure hydrocephalus, it has been described has a robust reflect of global cerebral atrophy (59) .
A patient is considered to harbor global cerebral atrophy when Evans’ Index was > 0.3.
Medial temporal atrophy
The medial temporal atrophy was scored on the Scheltens’ score, a five-point scale worldwide used to assess hippocampal atrophy in clinical routine (60).
In our study, the medial temporal atrophy was defined as: absent when the Scheltens’ score was 0, moderate when 1-2, severe when 3-4.
Parietal atrophy We used the four-point scale developed by Koedam & al (61) to assess the posterior regions atrophy, particularly the parietal lobes (Shown in supplemental material n°2)
The parietal atrophy was considered as absent when the atrophy score was 0, minimal when 1, moderate when 2, severe when 3.
Statistical analysis
The quantitative variables have been described by the mean and the standard deviation (in case of normal distribution) or by the median and the interquartile interval (IQR) in the contrary case. The qualitative variables are presented as numbers and percentages. Patients have been compared in function of their CSF profile as MD-CSF or VCI-CSF. Qualitative variables have been studied by a Chi² test or a Fisher Exact test (when n < 5). A t – test of Student or a Mann-Whitney test was used for quantitative variables. The level of significance was fixed at p = 0.05. Statistical analysis were performed thanks to the software SAS institute version 9.4.
- 24 -
RESULTS
The flow chart of our study is represented on figure n°2.
Figure n°2: Flow chart
3948 patients recruited from 2004
to January 2020 at the Lille Memory
Clinic Hospital 451 were classified as AD (371 probable, 80 certain) 1808 were classified as MD (1806 probable, 2 certain) 240 had a CSF biomarkers analysis 50 underwent a 3T cerebral MRI and a neuropsychological assessment 1689 were classified as VCI (1676 probable, 13 certain) 150 had a CSF biomarkers analyis 26 underwent a 3T cerebral MRI and a neuropsychological
assessment
Application of the CSF profile criteria for those pooled 76 patients
45 patients with MD-CSF profile 31 patients with VCI-CSF profile
- 25 -
Our population is composed of 76 patients, of which 45 (59%) with MD-CSF profile, and 31 (41%) with VCI-CSF profile.
Baseline characteristics
The population was composed of 49% of women, with a median age of 72.6 years, with a median of 10.3 years of education. The comparison of baseline characteristics is shown in Table n° 4.
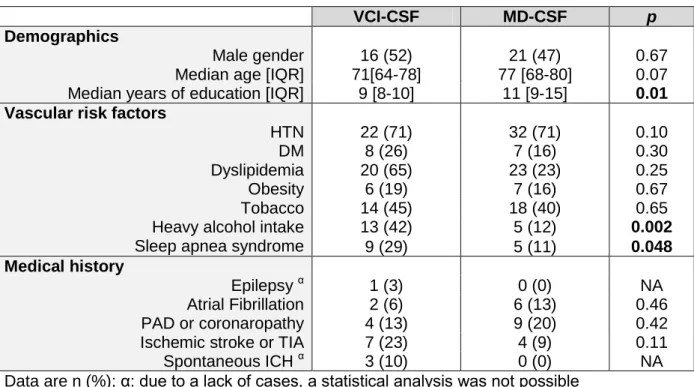
Table n°4: Baseline characteristics
VCI-CSF MD-CSF p
Demographics
Male gender 16 (52) 21 (47) 0.67
Median age [IQR] 71[64-78] 77 [68-80] 0.07 Median years of education [IQR] 9 [8-10] 11 [9-15] 0.01 Vascular risk factors
HTN 22 (71) 32 (71) 0.10
DM 8 (26) 7 (16) 0.30
Dyslipidemia 20 (65) 23 (23) 0.25
Obesity 6 (19) 7 (16) 0.67
Tobacco 14 (45) 18 (40) 0.65
Heavy alcohol intake Sleep apnea syndrome
13 (42) 5 (12) 0.002 9 (29) 5 (11) 0.048 Medical history Epilepsy α 1 (3) 0 (0) NA Atrial Fibrillation 2 (6) 6 (13) 0.46 PAD or coronaropathy 4 (13) 9 (20) 0.42 Ischemic stroke or TIA 7 (23) 4 (9) 0.11
Spontaneous ICH α 3 (10) 0 (0) NA
Data are n (%); α: due to a lack of cases, a statistical analysis was not possible
IQR indicates interquartile range; HTN, arterial hypertension; DM, diabetes mellitus; PAD, peripheral artery disease; TIA, transient ischemic attack; ICH, intracerebral hemorrhage; NA: non assessable
Patients with MD-CSF tended to be older (p = 0.07), and to have significantly higher level of education (median years of 11 vs 9, p = 0.01). Concerning the
vascular risk factors, HTN, DM and tobacco use were equally distributed in the two groups.
- 26 -
Patients with VCI-CSF were more likely to present dyslipidemia (65% vs 23%), but that difference was not significant.
Heavy alcohol intake and sleep apnea syndrome were significantly more frequent in patients with VCI-CSF: respectively: 42 % vs 12 % (p= 0.002), and 29 % vs 11 % (p= 0.048).
Neuropsychological data
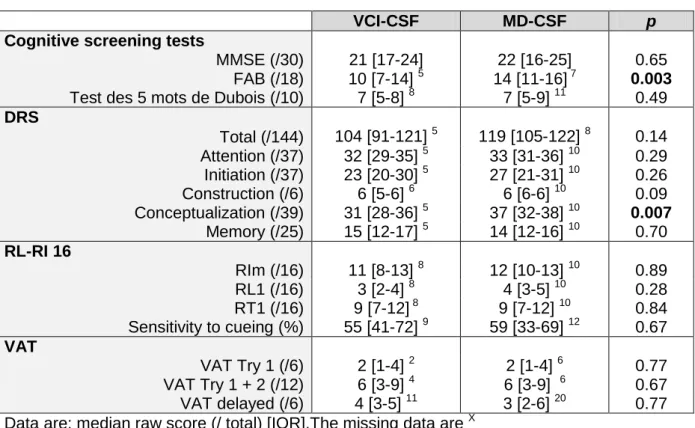
The median raw scores of the different tests and represented in Table n°5. Table n° 5: Median raw scores to the different tests
VCI-CSF MD-CSF p
Cognitive screening tests
MMSE (/30) FAB (/18) Test des 5 mots de Dubois (/10)
21 [17-24] 10 [7-14] 5 7 [5-8] 8 22 [16-25] 14 [11-16] 7 7 [5-9] 11 0.65 0.003 0.49 DRS 104 [91-121] 5 119 [105-122] 8 0.14 Total (/144) Attention (/37) 32 [29-35] 5 33 [31-36] 10 0.29 Initiation (/37) 23 [20-30] 5 27 [21-31] 10 0.26 Construction (/6) 6 [5-6] 6 6 [6-6] 10 0.09 Conceptualization (/39) 31 [28-36] 5 37 [32-38] 10 0.007 Memory (/25) 15 [12-17] 5 14 [12-16] 10 0.70 RL-RI 16 RIm (/16) 11 [8-13] 8 12 [10-13] 10 0.89 RL1 (/16) 3 [2-4] 8 4 [3-5] 10 0.28 RT1 (/16) Sensitivity to cueing (%) 9 [7-12] 8 55 [41-72] 9 9 [7-12] 10 59 [33-69] 12 0.84 0.67 VAT VAT Try 1 (/6) 2 [1-4] 2 2 [1-4] 6 0.77 VAT Try 1 + 2 (/12) 6 [3-9] 4 6 [3-9] 6 0.67 VAT delayed (/6) 4 [3-5] 11 3 [2-6] 20 0.77 Data are: median raw score (/ total) [IQR].The missing data are X
MMSE indicates Mini mental state evaluation; FAB, Frontal battery assessment; DRS,
Dementia rating scale; RIm : immediate recall phase; RL1: first free recall phase score; RT1: first free + cued recall score, VAT: visual association test
- 27 -
The global cognitive efficiency, assessed with the MMSE and the DRS total scores did not differ in the two groups. The performances were approximately the same in verbal (RL-RI 16) and visual (VAT) memory testing between the two groups.
However there was a striking difference in executive functions: patients with VCI-CSF presented a FAB score significantly lower (10 [7-14] vs 14 [11-16], p = 0.003), as well as the conceptualization subscale score was significantly lower in the same category of patients (31 [28-36] vs 37 [32-38], p = 0.007).
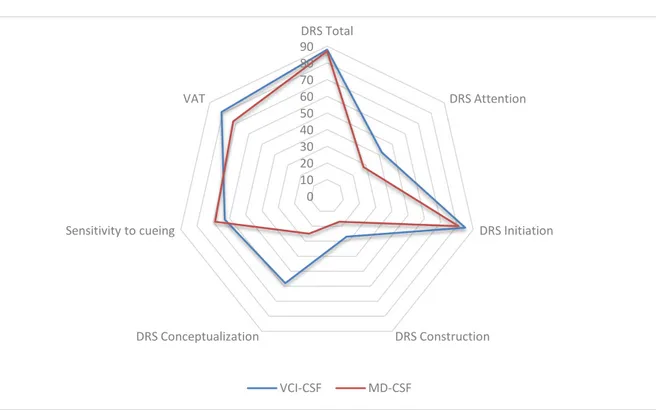
Figure n° 3: Proportions of patients presenting pathologic scores at the different tests
DRS indicates dementia rating scale; VAT: visual association test
The figure n°3 represents the percentages of patients who presented
pathologic scores in the neuropsychological testing (that is, under the 5th percentile for the DRS total score and its sub-scores, under the 10th percentile for the sensitivity to cueing). In our study the performances observed in neuropsychological test were mostly similar in the two groups. Only the proportion of pathologic scores at the DRS
0 10 20 30 40 50 60 70 80 90 DRS Total DRS Attention DRS Initiation DRS Construction DRS Conceptualization Sensitivity to cueing VAT VCI-CSF MD-CSF
- 28 -
conceptualization sub-score was significantly higher in patients with VCI –CSF (58% vs 25%, p = 0.0091).
Note: given a total of 97% pathologic scores at the DRS memory sub-score, this item was not include in the statistical analysis.
MRI data
1. Ischemic strokes and ICH
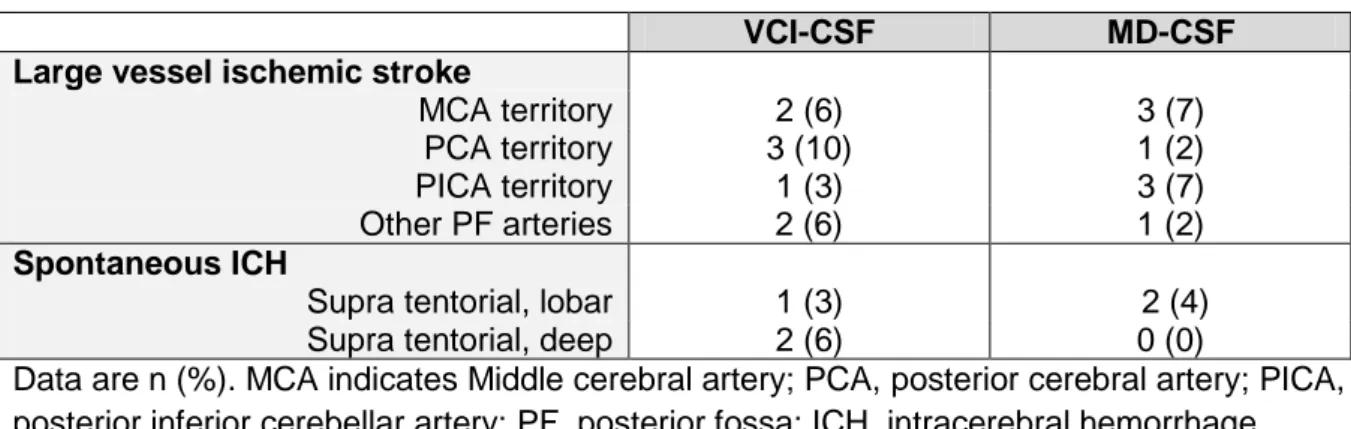
The numbers of large vessel ischemic strokes and ICH visualized on a 3T MRI evaluation are represented in the Table n°6.
Table n°6: Large vessel ischemic strokes and spontaneous ICH
VCI-CSF MD-CSF
Large vessel ischemic stroke
MCA territory 2 (6) 3 (7)
PCA territory 3 (10) 1 (2)
PICA territory 1 (3) 3 (7)
Other PF arteries 2 (6) 1 (2)
Spontaneous ICH
Supra tentorial, lobar 1 (3) 2 (4)
Supra tentorial, deep 2 (6) 0 (0)
Data are n (%). MCA indicates Middle cerebral artery; PCA, posterior cerebral artery; PICA, posterior inferior cerebellar artery; PF, posterior fossa; ICH, intracerebral hemorrhage
Due to a lack of cases, a statistical analysis could not be performed between the two groups. However, VCI-CSF patients presented more frequently infarctions in the PCA territory (10% vs 2%) and deep ICH (6 % vs 0%).
Note thatnone of our patients has presented any infarction in the ACA or of the AChoA territories, nor any posterior fossa hemorrhage. One patient presented a spontaneous intraventricular hemorrhage without parenchymal involvement (not represented in table n°6).
- 29 - 2. Small vessel diseases biomarkers
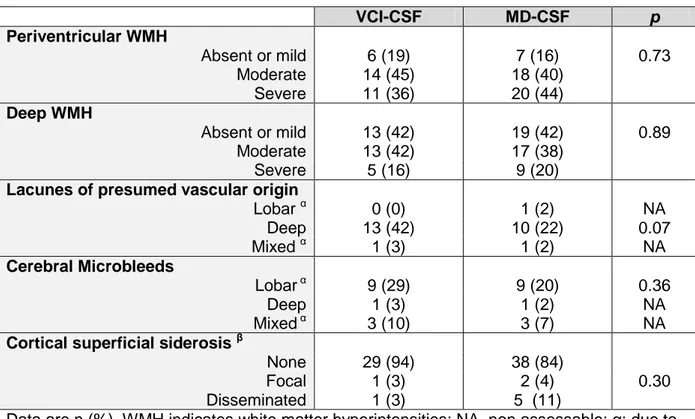
The repartition of small vessel diseases biomarkers in the two groups is represented in Table n°7.
Table n°7: Small vessel disease biomarkers
VCI-CSF MD-CSF p Periventricular WMH Absent or mild 6 (19) 7 (16) 0.73 Moderate 14 (45) 18 (40) Severe 11 (36) 20 (44) Deep WMH Absent or mild 13 (42) 19 (42) 0.89 Moderate 13 (42) 17 (38) Severe 5 (16) 9 (20)
Lacunes of presumed vascular origin
Lobar α 0 (0) 1 (2) NA Deep 13 (42) 10 (22) 0.07 Mixed α 1 (3) 1 (2) NA Cerebral Microbleeds Lobar α 9 (29) 9 (20) 0.36 Deep 1 (3) 1 (2) NA Mixed α 3 (10) 3 (7) NA
Cortical superficial siderosis β
None 29 (94) 38 (84)
Focal 1 (3) 2 (4) 0.30
Disseminated 1 (3) 5 (11)
Data are n (%). WMH indicates white matter hyperintensities; NA, non assessable; α: due to a lack of cases, a statistical analysis was not possible; β : due to a lack of events, patient with focal and disseminated cortical superficial siderosis were regrouped to allow statistical analysis.
Severity of PVH and DWMH did not differ between the two groups. Likewise, the topographic distribution of CMB was approximately the same between the two groups. However, patient with VCI-CSF tend to present more frequently deep lacunes (42 % vs 22%, p = 0.07), and patients with MD-CSF tend to have more disseminated CSS (11% vs 3%, p = 0.30).
3. Strategic lesions
- 30 - Figure n°4: Strategic vascular lesions
More than one third of patients with VCI-CSF presented at least one strategic vascular lesion: 9 (29 %) and 2 (6%) harbored respectively one and more than one lesion. In the other group, strategic lesions were slightly less frequent: 8 (18%) and 2 (4%) harbored respectively one and more than one lesion. However, that difference was non-significant (p = 0.20). Remark: due to a lack of events, patient presenting one and more than strategic lesion were regrouped to allow statistical analysis.
Figure n° 5: Examples of strategic vascular lesions in our cohort 65 78 29 18 6 4 0% 10% 20% 30% 40% 50% 60% 70% 80% 90% 100% VCI-CSF MD-CSF
- 31 -
On the left: Cerebral T2 weighed MRI, axial plan passing through the basal ganglia. Note the bithalamic lacunar lesions and the EPVS in the head of caudate nuclei, the extensive periventricular WMH and the global cortico-subcortical atrophy that can fit in deep perforating vasculopathy. This patient aged 68 indeed presented multiple vascular risk factors.
On the right: Cerebral MRI, axial FLAIR sequence, passing through the temporal horns of lateral ventricles. Note the hypersignal involving the right medial temporal lobe. This patient has presented a cerebral infarction in the superficial territory of the right posterior cerebral artery.
4. Pattern of cerebral atrophy
The pattern of cerebral atrophy in our study is represented in Table n°8.
Table n°8: Pattern of cerebral atrophy
VCI-CSF MD-CSF p
Median Evans’ index [IQR] 0.31 [0.28-0.35] 0.29 [0.28- 0.32] 0.01 Left medial temporal atrophy α β
1 (3) 15 (49) 15 (49) 0 (0) 25 (55) 19 (42) 0.66 Absent or mild Moderate Severe
Right medial temporal atrophy α β
2 (6) 21 (68) 8 (26) 2 (4) 23 (51) 19 (42) 0.12 Absent or mild Moderate Severe
Left parietal atrophy
8 (26) 15 (48) 5 (16) 3 (10) 5 (11) 22 (49) 11 (24) 7 (16) 0.33 Absent Mild Moderate Severe
Right parietal atrophy
8 (26) 14 (45) 5 (16) 4 (13) 2 (4) 21(47) 14 (31) 8 (18) 0.04 Absent Mild Moderate Severe
Data are n (%); IQR indicates interquartile range; α = due to a lack of events, patient with absent or mild and moderate MTA were regrouped to allow statistical analysis; β = data were missing for one patient due to movement artefacts.
In our study, the Evan’s index was significantly higher in patients with VCI-CSF (0.31 [0.28-0.35] vs 0.29 [0.28- 0.32], p = 0.01).
The MTA did not differ between the two groups. However, the parietal atrophy presented an asymmetric repartition: patients with MD-CSF were more likely to
- 32 -
harbor moderate (31% vs 16%) to severe (18% vs 13) right parietal atrophy (p = 0.04). A similar pattern was observed with the left parietal atrophy but that difference was not significant (p = 0.33).
Figure n°6: Example of parietal atrophy in our study in our cohort
Cerebral MRI, T1- weighed, coronal slice passing through the occipital horns of lateral ventricles.
The parietal cortical atrophy is scored as moderate (grade 2 of the Koedam’s classification) on the left and mild (grade 1) on the right. Note the apparent dilatation of posterior Cingulate sulci on the midline. Otherwise, we can observe diffuse periventricular hypointensities, correlating with white matter intensities on the FLAIR sequence (not shown).
Focus on a specific etiology: the cerebral amyloid angiopathy.
8 patients (10.5%) met the modified Boston criteria (62) for probable CAA which allows in vivo diagnosis of CAA. 5 presented the association of strictly lobar CMB and CSS, 2 the association of lobar ICH and CSS, 1 had lobar ICH + lobar CMB + CSS. Their radiological features and CSF profile are shown in Table n°7.
Table n°7: Patients of our cohort who fulfilled the criteria for probable CAA
Patient n° Lobar ICH Lobar CMB CSS CSF Profile
5 Yes Yes Yes VCI
9 No Yes Yes MD
15 Yes No Yes MD
31 No Yes Yes MD
51 No Yes Yes VCI
61 Yes No Yes MD
68 No Yes Yes MD
71 No Yes Yes MD
CSF indicates cerebro-spinal fluid; CMB: cerebral microbleeds; CSS: cortical superficial siderosis.
- 33 -
In this specific category of patients, 6 (75%) presented MD-CSF profile.
Figure n°7: Examples of CAA patterns in our cohort
On the left: Cerebral MRI, T2 gradient echo-weighed sequence, axial slice passing through the frontal horns of lateral ventricles. Note the multiple CMB of strictly lobar, cortico-subcortical topography.
On the right: Cerebral MRI, T2 gradient echo-weighed sequence, axial slice passing through the central sulcus. Note the lobar hemorrhage in the superior frontal gyrus, and the contralateral (focal) CSS.
DISCUSSION
In our study, patients with MD-CSF tended to be older (median age 77 [68-80] vs 71 [64-78] p = 0.07), which is congruent with current data in literature (34). Patients with MD-CSF had better level of education (median years of education 11 [9-15] vs 9 [8-10], p = 0.01), which is discordant with the usual data, given that illiteracy or low educational achievement has been shown to be a robust risk factor for dementia of all types, but particularly of AD (63).
- 34 -
Concerning vascular risk factors, HTN, DM and tobacco use were equally distributed in the two groups. However, patients with VCI-CSF were significantly more likely to present heavy alcohol intake (42% vs 12%, p = 0.002), which is congruent with current data. In a nationwide retrospective cohort, Schwarzinger and
al (64) highlighted that heavy alcohol intake was more frequently recorded in VaD than in other dementia types (11.2% vs 9.8%; p < 0.0001). Furthermore, heavy alcohol intake is a well-known risk factor of ICH occurrence (65). Recently, in a cohort of ICH patients, alcohol-drinking habit has been shown to be an independent predictor of increased centrum semi ovale EPVS severity, suggesting that alcohol may influence the cerebral small vessel disease pattern (66).
Sleep apnea syndrome, was also more frequent in patients with VCI-CSF (29% vs 11%, p = 0.048) which is consistent with the higher risk of stroke associated with sleep apnea (67). Moreover, in radiological studies patients with moderate to severe sleep apnea syndrome are more likely to harbor severe patterns of WMH (68). The fact that patients with VCI-CSF did not present more history of stroke nor
strategic lesions was unexpected, and might be attributed to the few number of patients.
Concerning neuropsychological data, the global cognitive efficiency did not differ between the two groups in our study. However patients with VCI-CSF had a significantly lower FAB score (10 [7-14] vs 14 [11-16], p = 0.003) and DRS
conceptualization raw score (31 [28-36] vs 37 [32-38], p = 0.007). The same
difference was confirmed after adjustment on age and level education: the proportion of patients with pathological DRS conceptualization scores was higher in patients
- 35 -
with VCI-CSF (58% vs 25%, p = 0.0091). Those results suggest that the executive functions are particularly altered in these patients.
However, we could not assess the precise nature of the deficit: due to the
retrospective design and the differences in the neuropsychological evaluations, the executive and attentional functions were assessed with different tests. Systematic comparison was not allowed and the results of those tests were not included in our study. Thus, executive functions have been incompletely explored in our study. An extensive evaluation of executive functions may however be useful to precise the diagnosis. For example, Eckerström and al in a cohort of patient from the Gothenburg study shown that the word fluency F-A-S test and the Trail making test A best
differentiated clinical AD from MD (69) . For further prospective cohorts, the use of batteries of test such as proposed by the GRECOG-Vasc committee (70) or the GREFEX (71), (which also encompasses behavioral evaluation) is mandatory.
In our study, the striking absence of difference between the two groups concerning the scores the memory tests (RL-RI 16 and VAT) may be related to the numerous missing data for those two tests, particularly in patients with MD-CSF.
Concerning radiological data, in our study, the topographic distribution of large vessel ischemic strokes, ICH and cerebral small vessel diseases biomarkers did not differ between the two groups.
However, patients who fulfilled the modified Boston criteria for CAA tend to present MD-CSF profile, which is expected given the strong association between CAA and AD, and congruent with recent data of the literature. Charidimou and al in their metanalysis (72) showed that patients with CAA specifically harbor lower Aβ142
- 36 -
difference in p-Tau levels was observed. There is a growing interest in the CSF profile of patients with CAA. Some authors even suggested that CSF analysis may help to diagnose preclinical CAA in patients fulfilling modified Boston Criteria for possible and probable CAA (73).
In our study, the Evan’s index was significantly higher in patients with VCI-CSF (0.31 [0.28-0.35] vs 0.29 [0.28- 0.32], p = 0.01), reflecting that global cortical atrophy was more pronounced in this group. Such a result is striking, given patients with VCI-CSF tend to be younger than the others. To date, the diagnosis value of Evan’s Index has not been specifically studied in VCI but patients with cerebrovascular disorders and especially those with subcortical vascular encephalopathy are likely to harbor subcortical global atrophy due to white matter lesions but also reduced cortical thickness attributed to secondary neuronal degeneration (9).
Even though a more pronounced MTA was expected in patient with MD-CSF, no difference was observed between are groups.
However, in our study, right parietal atrophy was more pronounced in patients with MD-CSF (p = 0.04) but similar in the two groups for the left parietal regions. Right focal variants of AD with right sighted asymmetry on neuroimaging have indeed been described, but in a recent review of literature, heterogeneity among the reports prevented a univocal description of this syndrome (74).
Our study has several strengths:
First of all, its clinical relevance: the differential diagnosis between VCI and mixed dementia is a clinical challenge for the clinician, as the natural history and the prognosis differs, and it is and an important issue for the patient, which may benefit
- 37 -
for a specific follow-up and symptomatic treatment (acetyl choline esterase inhibitors or memantin) in case of mixed dementia.
The contra-indication of lumbar puncture, particularly due to undergoing
anticoagulants is a frequent situation in clinical practice. Consequently, we need to determine predictive factors for an underlying degenerative process.
Secondly, its originality: to date, there is no other study comparing
neuropsychological performances, distribution of cerebrovascular lesions and pattern of atrophy specifically to the profile of CSF biomarkers.
Furthermore, we selected simple, easily available clinical data, validated and reproducible neuropsychological test, robust visual radiologic scales.
Positive emission tomography data were not included in our study, these exams being rarely present, moreover the aim of our study was to initially design a simple clinical score to supply the physician with simple available tools.
However, our study has numerous limits.
First of all, the limited number of patients, due to the rigorous criteria of inclusion to ensure a correct internal validity, limits the external validity.
Furthermore, ours is a tertiary center with a recruitment that concerns also rare forms of dementia as well as young patients, less likely to have mixed or vascular dementia.
Secondly, our study was based on a monocentric hospital-based cohort, in a tertiary center that recruited a heterogeneous population, including ultra-selected patients for follow-up or therapeutic protocols for AD.
- 38 -
Given the retrospective design of our study, we had significant missing data concerning of the neuropsychological tests that might prevented to highlight differences in mnesic profiles.
CONCLUSION
In our study, data suggest that patients with VCI are likely to harbor more pronounced deficits in executive functions, and that the pattern of atrophy may help to differentiate VCI from MD (global with VCI, posterior in MD). However, due to a small size population, we could not to establish a clinico-radiological score that may help the physician to differentiate patients with MD from those with VCI, inferred from their CSF profiles.
Large prospective cohorts with standardized neuropsychological batteries, especially those designed to assess executive functions, standardized reading plans of cerebral MRI with precise analysis of cerebral small vessel diseases biomarkers and pattern of atrophy are necessary to answer to this challenging diagnosis and clinically relevant question.
- 39 - REFERENCES
1. Wortmann M. Dementia: a global health priority - highlights from an ADI and World Health Organization report. Alzheimers Res Ther. 2012; 4:40. doi: 10.1186/alzrt143.
2. Lobo A, Launer LJ, Fratiglioni L, et al. Prevalence of dementia and major subtypes in Europe: A collaborative study of population-based cohorts. Neurologic Diseases in the Elderly Research Group. Neurology 2000;54:4– 9S.
3. Rockwood K, Wentzel C, Hachinski V, Hogan DB, MacKnight C, McDowell I. Prevalence and outcomes of vascular cognitive impairment. Vascular
Cognitive Impairment Investigators of the Canadian Study of Health and Aging. Neurology. 2000;54(2):447-451. doi:10.1212/wnl.54.2.447
4. Mc Menemey,W.H.(1961).“The dementias and progressive diseases of the basal ganglia,”in Neuropathology, 3rd
Edn., edJ.G. Greenfield
(London:E.Arnold), 475–521.
5. Leys D, Hénon H, Mackowiak-Cordoliani MA, Pasquier F. Post stroke dementia. Lancet Neurol. 2005;4(11):752-759. doi:10.1016/S1474-4422(05)70221-0
6. Pendlebury ST, Rothwell PM. Prevalence, incidence, and factors associated with pre-stroke and post-stroke dementia: a systematic review and meta-analysis. Lancet Neurol. 2009;8(11):1006-1018. doi:10.1016/S1474-4422(09)70236-4
7. Barbay M, Diouf M, Roussel M, Godefroy O; GRECOGVASC study group. Systematic Review and Meta-Analysis of Prevalence in Post-Stroke
Neurocognitive Disorders in Hospital-Based Studies. Dement Geriatr Cogn Disord. 2018;46(5-6):322-334. doi:10.1159/000492920
8. Jellinger, K.A. The enigma of vascular cognitive disorder and vascular dementia. ActaNeuropathol 113,349–388 (2007).
9. Jellinger KA. Pathology and pathogenesis of vascular cognitive impairment-a critical update. Front AgingNeurosci. 2013;5:17. Published 2013 Apr 10. doi:10.3389/fnagi.2013.00017
10. Dichgans M, Leys D. Vascular Cognitive Impairment. Circ Res. 2017;120 (3):573-591. doi:10.1161/CIRCRESAHA.116.308426
11. Pasi M, Cordonnier C. Clinical Relevance of Cerebral Small Vessel Diseases. Stroke. 2020;51(1):47-53. doi:10.1161/STROKEAHA.119.024148
12. Pasi M, Boulouis G, Fotiadis P, et al. Distribution of lacunes in cerebral amyloid angiopathy and hypertensive small vessel disease. Neurology. 2017;88(23):2162-2168. doi:10.1212/WNL.0000000000004007
13. Chabriat H, Joutel A, Dichgans M, Tournier-Lasserve E, Bousser MG. Cadasil. Lancet Neurol. 2009;8(7):643-653.
doi:10.1016/S1474-4422(09)70127-9
14. Moulin S, Labreuche J, Bombois S, Rossi C, Boulouis G, Hénon H,et al. Dementia risk after spontaneous intracerebral haemorrhage: a prospective cohort study. Lancet Neurol2016; 15:820–9.
15. Román GC, Tatemichi TK, Erkinjuntti T, et al. Vascular dementia: diagnostic criteria for research studies. Report of the NINDS-AIREN International Workshop. Neurology. 1993; 43(2):250-260. doi:10.1212/wnl.43.2.250
16. Hachinski V, Iadecola C, Petersen RC, et al. National Institute of Neurological Disorders and Stroke-Canadian Stroke Network vascular cognitive
- 40 -
impairment harmonization standards [published correction appears in Stroke. 2007 Mar; 38 (3):1118. Wallin, Anders [added]]. Stroke. 2006;37(9):2220-2241. doi:10.1161/01.STR.0000237236.88823.47
17. Sachdev P, Kalaria R, O'Brien J, et al. Diagnostic criteria for vascular cognitive disorders: a VASCOG statement. Alzheimer Dis Assoc Disord. 2014;28(3):206-218. doi:10.1097/WAD.0000000000000034
18. Looi JCL, Sachdev PS. Differentiation of vascular dementia from AD on neuropsychological tests. Neurology. 1999;53:670–678.
19. Albert MS, Dekosky ST, Dickson D, et al. The diagnosis of mild cognitive impairment due to Alzheimer’s disease: recommendations from the National Institute on Aging-Alzheimer’s Association workgroups on diagnostic
guidelines for Alzheimer’s disease. Alzheimers Dement. 2011;7:270–279. 20. Kramer JH, Reed BR, Mungas D, Weiner MW, Chui HC. Executive
dysfunction in subcortical ischaemic vascular disease. J Neurol Neurosurg Psychiatry. 2002;72(2):217-220. doi:10.1136/jnnp.72.2.217
21. Gupta M, Dasgupta A, Khwaja GA, Chowdhury D, Patidar Y, Batra A. The profile of behavioral and psychological symptoms in vascular cognitive impairment with and without dementia. Ann Indian Acad Neurol.
2013;16(4):599-602. doi:10.4103/0972-2327.120488
22. Meng XF, Yu JT, Wang HF, Tan MS, Wang C, Tan CC, Tan L (2014) Midlife vascular risk factors and the risk of Alzheimer’s disease: a systematic review and meta-analysis. J Alzheimers Dis 42:1295–1310.
doi:10.3233/JAD-140954
23. Biessels GJ, Staekenborg S, Brunner E, et al. Risk of dementia in diabetes mellitus: a systematic review. Lancet Neurol 2006; 5: 64–74.
24. Ott A, Breteler MM, de Bruyne MC, van Harskamp F, Grobbee DE, Hofman A (1997) Atrial fibrillation and dementia in a population-based study. The
Rotterdam Study. Stroke 28:316–321
25. McCarron MO, Delong D, Alberts MJ (1999) APOE genotype as a risk factor for ischemic cerebrovascular disease: a meta-analysis. Neurology 53:1308– 1311
26. de Leeuw FE, de Groot JC, Achten E, et al. Prevalence of cerebral white matter lesions in elderly people: a population based magnetic resonance imaging study. The Rotterdam Scan Study. J Neurol Neurosurg Psychiatry. 2001;70(1):9-14. doi:10.1136/jnnp.70.1.9
27. Vermeer SE, Prins ND, den Heijer T, Hofman A, Koudstaal PJ, Breteler MM. Silent brain infarcts and the risk of dementia and cognitive decline.
N Engl J Med. 2003;348:1215–1222. doi: 10.1056/NEJMoa022066 28. Romero JR, Preis SR, Beiser A, DeCarli C, Viswanathan A,
Martinez-Ramirez S, et al. Risk factors, stroke prevention treatments, and prevalence of cerebral microbleeds in the Framingham heart study. Stroke. 2014;45:1492–1494. doi: 10.1161/STROKEAHA.114.004130 29. Hénon H, Durieu I, Guerouaou D, Lebert F, Pasquier F, Leys D. Poststroke
dementia: incidence and relationship to prestroke cognitive decline. Neurology. 2001;57(7):1216-1222. doi:10.1212/wnl.57.7.1216 30. Premkumar DR, Cohen DL, Hedera P, Friedland RP, Kalaria RN.
Apolipoprotein E-epsilon4 alleles in cerebral amyloid angiopathy and
cerebrovascular pathology associated with Alzheimer's disease. Am J Pathol. 1996;148(6):2083-2095.
- 41 -
dementia. J Clin Neurol. 2006;2(1):1-11. doi:10.3988/jcn.2006.2.1.1
32. Gold G, Giannakopoulos P, Montes-Paixao Júnior C, et al. Sensitivity and specificity of newly proposed clinical criteria for possible vascular
dementia. Neurology. 1997;49(3):690-694. doi:10.1212/wnl.49.3.690
33. Schneider JA, Arvanitakis Z, Bang W, Bennett DA. Mixed brain pathologies account for most dementia cases in community-dwelling older persons.
Neurology. 2007; 69:2197–2204. doi: 10.1212/01.
wnl.0000271090.28148.24.
34. Bruandet A, Richard F, Bombois S, et al. Alzheimer disease with
cerebrovascular disease and vascular dementia: clinical features and course compared with Alzheimer disease. J Neurol Neurosurg Psychiatry.
2009;80(2):133-139. doi:10.1136/jnnp.2007.137851
35. Korf ES, Wahlund LO, Visser PJ et al (2004) Medial temporal lobe atrophy on MRI predicts dementia in patients with mild cognitive impairment. Neurology 63:94–100
36. Laakso MP, Partanen K, Riekkinen P et al (1996) Hippocampal volumes in Alzheimer's disease, Parkinson's disease with and without dementia, and in vascular dementia: an MRI study. Neurology 46:678–681
37. Lehmann M, Rohrer JD, Clarkson MJ et al (2010) Reduced cortical thickness in the posterior cingulate gyrus is characteristic of both typical and atypical Alzheimer's disease. J Alzheimers Dis 20:587–598
38. Karas G, Scheltens P, Rombouts S et al (2007) Precuneus atrophy in early-onset Alzheimer's disease: a morphometric structural MRI study.
Neuroradiology 49:967–976
39. Kerrouche N, Herholz K, Mielke R, Holthoff V, Baron JC (2006) 18FDG PET in vascular dementia: Differentiation from Alzheimer’s disease using voxel-based multivariate analysis. J Cereb Blood Flow Metab 26, 1213-1221 40. Thal DR, Beach TG, Zanette M, et al. [(18)F] flutemetamol amyloid positron
emission tomography in preclinical and symptomatic Alzheimer's disease: specific detection of advanced phases of amyloid-β
pathology. AlzheimersDement. 2015;11(8):975-985. doi:10.1016/j.jalz.2015.05.018
41. Marquié M, SiaoTick Chong M, Antón-Fernández A, et al. [F-18]-AV-1451 binding correlates with postmortem neurofibrillary tangle Braak staging. Acta
Neuropathol. 2017;134(4):619-628. doi:10.1007/s00401-017-1740-8
42. Olsson B, Lautner R, Andreasson U, et al. CSF and blood biomarkers for the diagnosis of Alzheimer's disease: a systematic review and meta-analysis. Lancet Neurol. 2016;15(7):673-684. doi:10.1016/S1474-4422(16)00070-3 43. Dubois B, Feldman HH, Jacova C, et al. Advancing research diagnostic
criteria for Alzheimer's disease: the IWG-2 criteria [published correction appears in Lancet Neurol. 2014 Aug;13(8):757]. Lancet Neurol.
2014;13(6):614-629. doi:10.1016/S1474-4422(14)70090-0
44. Dumurgier J, Schraen S, Gabelle A, et al. Cerebrospinal fluid amyloid-β 42/40 ratio in clinical setting of memory centers: a multicentric
study. AlzheimersResTher. 2015;7(1):30. Published 2015 Jun 1. doi:10.1186/s13195-015-0114-5
45. McKhann GM, Knopman DS, Chertkow H, et al. The diagnosis of dementia due to Alzheimer's disease: recommendations from the National Institute on Aging-Alzheimer's Association workgroups on diagnostic guidelines for Alzheimer's disease. Alzheimers Dement. 2011;7(3):263-269.
- 42 - doi:10.1016/j.jalz.2011.03.005
46. Folstein, M.F., Folstein, S.E., & McHugh, P.R. (1975). ‘Mini-mental state’. A Practical method forgradinng the cognitive state of patients for the clinician. Journal of Psychiatric Research, 12,189-198.
47. Dubois B, Slachevsky A, Litvan I, Pillon B. The FAB: a Frontal Assessment Battery at bedside. Neurology. 2000; 55(11):1621-1626.
doi:10.1212/wnl.55.11.1621
48. B. Dubois, J. Touchon, F. Portet, et al.« Les 5 mots », épreuve simple et sensible pour le diagnostic de maladie d‘Alzheimer. Presse Med, 31 (2002), pp. 1696-1699
49. Juva K, Sulkava R, Erkinjuntti T, Ylikoski R, Valvanne J, Tilvis R. Usefulness of the Clinical Dementia Rating scale in screening for dementia. Int
Psychogeriatr. 1995;7(1):17-24. doi:10.1017/s1041610295001815 50. Grober, E., & Buschke, H. (1987). Genuine memory deficits in dementia.
Developmental Psychology, 3, 13-36.
51. Van der Linden, M., Coyette, F., Poitrenaud, J., Kalafat, M., Calicis, F., Wyns, C., Membres du GREMEM. (2004). L’épreuve de rappel libre/rappel indicé à 16 items (RL/RI-16). In M. Van der Linden, S. Adam, A. Ag-niel, & Membres du GRENEM (Eds.), L'évaluation des troubles de la mémoire : présentation de quatre tests de mémoire épisodique avec leur étalonnage. (pp. 25-47). Marseille: Solal
52. Amieva, H. &Carcaillon, Laure & L’Alzit-Schuermans, P. & Millet, X.
&Dartigues, J. &Fabrigoule, Colette. (2007). Test de rappel libre/rappel indicé à 16 items : normes en population générale chez des sujets âgés issues de l’étude des 3 Cités. Revue Neurologique - REV NEUROL. 163. 205-221. 10.1016/S0035-3787(07)90392-6.
53. Lindeboom J, Schmand B, Tulner L, Walstra G, Jonker C. Visual association test to detect early dementia of the Alzheimer type. J Neurol Neurosurg Psychiatry. 2002;73(2):126-133. doi:10.1136/jnnp.73.2.126
54. Pasi M, Marini S, Morotti A, et al. Cerebellar Hematoma Location:
Implications for the Underlying Microangiopathy. Stroke. 2018;49(1):207-210. doi:10.1161/STROKEAHA.117.019286
55. Wardlaw JM, Smith EE, Biessels GJ, et al. Neuroimaging standards for research into small vessel disease and its contribution to ageing and
neurodegeneration. Lancet Neurol. 2013;12(8):822-838. doi:10.1016/S1474-4422(13)70124-8
56. Fazekas F, Chawluk JB, Alavi A, Hurtig HI, Zimmerman RA. MR signal abnormalities at 1.5 T in Alzheimer's dementia and normal aging. AJR Am J
Roentgenol. 1987;149(2):351-356. doi:10.2214/ajr.149.2.351
57. Pasi M, Boulouis G, Fotiadis P, et al. Distribution of lacunes in cerebral amyloid angiopathy and hypertensive small vessel disease. Neurology. 2017;88(23):2162-2168. doi:10.1212/WNL.0000000000004007
58. Charidimou A, Linn J, Vernooij MW, et al. Cortical superficial siderosis: detection and clinical significance in cerebral amyloid angiopathy and related conditions. Brain. 2015;138(Pt 8):2126-2139. doi:10.1093/brain/awv162 59. Del Brutto OH, Mera RM, Zambrano M, Costa AF. The value of the Evans
and bicaudate indices for predicting poor cognitive performance and central atrophy. Results from the Atahualpa Project. J Clin Neurosci. 2019;59:245-247. doi:10.1016/j.jocn.2018.08.024