O
pen
A
rchive
T
OULOUSE
A
rchive
O
uverte (
OATAO
)
OATAO is an open access repository that collects the work of Toulouse researchers and makes it freely available over the web where possible.This is an author-deposited version published in : http://oatao.univ-toulouse.fr/
Eprints ID : 12461
The contribution was presented at E2DC 2013 :
http://conferences.sigcomm.org/eenergy/2013/
To cite this version : Vor Dem Berge, Micha and Da Costa, Georges and Jarus, Mateusz and Oleksiak, Ariel and Piatek, Wojciech and Volk, Eugen Modeling Data Center
Building Blocks for Energy-efficiency and Thermal Simulations. (2013) In: 2nd
International Workshop on Energy-Efficient Data Centres, co-located with E-Energy (E2DC 2013) co-located workshops of 4th International Conference on Future Energy Systems (ACM e-Energy 2013), 21 May 2013 (Berkeley, CA, United States).
Any correspondance concerning this service should be sent to the repository administrator: [email protected]
Modeling Data Center Building Blocks for
Energy-Efficiency and Thermal Simulations
Micha vor dem Berge1, Georges Da Costa2, Mateusz Jarus3, Ariel Oleksiak3,
Wojciech Piatek3, and Eugen Volk4 1
Christmann Informationstechnik + Medien [email protected]
2
IRIT, University of Toulouse [email protected]
3
Poznan Supercomputing and Networking Center {jarus,ariel,piatek}@man.poznan.pl
4
High Performance Computing Center Stuttgart [email protected]
Abstract. In this paper we present a concept and specification of Data Center Efficiency Building Blocks (DEBBs), which represent hardware components of a data center complemented by descriptions of their en-ergy efficiency. Proposed building blocks contain hardware and thermo-dynamic models that can be applied to simulate a data center and to evaluate its energy efficiency. DEBBs are available in an open reposi-tory being built by the CoolEmAll project. In the paper we illustrate the concept by an example of DEBB defined for the RECS multi-server system including models of its power usage and thermodynamic proper-ties. We also show how these models are affected by specific architecture of modeled hardware and differences between various classes of applica-tions. Proposed models are verified by a comparison to measurements on a real infrastructure. Finally, we demonstrate how DEBBs are used in data center simulations.
Keywords: data centers, energy efficiency, simulations.
1
Introduction
Recent fast development of cloud computing and computational science caused growing demand for large capacities that should be delivered in a cost-effective way by distributed data centers. However, these processes led to huge amounts of consumed energy. In many current data centers the actual IT equipment uses only half of the total energy while most of the remaining part is required for cooling and air movement resulting in poor Power Usage Effectiveness (PUE) [1] values. For these reasons many efforts were undertaken to measure and study energy efficiency of data centers, for instance [2][3][4] to name a few. In order to optimize a design or configuration of data center we need a thorough study using appropriate metrics and tools evaluating how much computation or data
processing can be done within given power and energy budget and how it affects temperatures, heat transfers, and airflows within data center. Therefore, there is a need for simulation tools and models that approach the problem from a perspective of end users and take into account all the factors that are critical to understanding and improving the energy efficiency of data centers, in particular, hardware characteristics, applications, management policies, and cooling.
To cope with this problem we introduce Data Center Efficiency Building Blocks (DEBBs), which (i) provide means to to prepare descriptions and mod-els to be easily inserted into simulations (ii) allows data center designers and analysts to take holistic view of data centers from impact of single applications up to the heat transfer and cooling process in the whole data center. Proposed building blocks contain hardware and thermodynamic models that can be ap-plied to simulate a data center and to evaluate its energy efficiency. They are based on common formats and standards, and contain evaluation of their energy efficiency in various conditions (rather than defining maximum power only). In this way they allow, once applied in the CoolEmAll Simulation, Visualization and Decision Support Toolkit (SVD Toolkit), to integrate discrete event and Computational Fluid Dynamics (CFD) simulations [5] and enable optimization of data center energy-efficiency also for low and variable loads rather than just for peak ones as it is usually done today. The toolkit includes the repository of DEBBs, workload and application profiles, the Data Center Workload and Resource Management Simulator, CFD simulator, metrics calculator, and visu-alization tools. The architecture along with interactions between components and details about the SVD Toolkit can be found in [5][6].
The structure of the paper is as follows. Section 2 contains related work con-cerning data center building blocks and simulations of data centers. The concept of open data center efficiency building blocks is described in Section 3. In this Section we explain how we define and build profiles of data center hardware. In Section 4 we illustrate the DEBB concept by an example of DEBB defined for the Christmann RECS system along with specific models of energy efficiency and thermodynamic properties. This Section also contains a verification of mod-els by comparison to tests on real infrastructure. Section 5 illustrates the use of DEBBs in simulations of hardware behavior for various workloads. Section 6 concludes the paper.
2
Related Work
The problem of data center energy efficiency is recently gaining more and more interest and importance so there is a lot of ongoing work both in industry and research. There are already software tools available on the market, which can be applied to simulate thermal processes in data centers. Examples of such soft-ware include simulation codes along with more than 600 models of servers from Future Facilities, SigmaDC software, CA tools, or the TileFlow application. In most cases the simulation tools are complex and expensive solutions that allow detailed modeling heat transfer in data centers. To simplify the analysis process
Romonet introduced a simulator, which concentrates on costs analysis. Instead of complex Computational Fluid Dynamics (CFD) simulations it is based on sim-plified computational and cost models. However it does not enable detailed heat transfer analysis. Common problem in case of commercial data center modeling tools is that they use closed limited databases of data center hardware. Although some of providers as Future Facilities [7] have impressive databases, extensions of these databases and use of models across various tools is limited. To cope with this issue Schneider have introduced the GENOME Project that aims at collect-ing ”genes” which are used to build data centers. They contain details of data center components and are publicly available on the Schneider website. Never-theless, the components are described by static parameters such as ”nameplate” power values rather than details that enable simulating and assessing their en-ergy efficiency in various conditions. Another initiative aiming at collection of designs of data centers is the Open Compute Project. Started by Facebook which published its data center design details, consists of multiple members describing data centers’ designs. However, Open Compute Project blueprints are designed for description of good practices rather than to be applied to simulations.
In addition to industrial solutions significant research effort was performed in the area of energy efficiency modeling and optimization. For example, models of servers’ power usage were presented in [8] whereas application of these models to energy-aware scheduling in [3]. Additionally, authors in [9][10] proposed method-ologies of modeling and estimation of power by specific application classes. There were also attempts to use thermodynamic information in scheduling as in [11]. Nevertheless, the above works are focused on research aspects and optimization rather than providing models to simulate real data centers.
3
Open Data Center Efficiency Building Blocks
As noted, one of the main results of the CoolEmAll project is the design of diverse types of Data center Efficiency Building Blocks (DEBBs), enabling to model and simulate a data center on different granularity levels. The following subsections describe the DEBB concept, its structure, hardware- and thermody-namic models, and metrics assessing energy-efficiency.
3.1 DEBB Concept and Structure
A DEBB is an abstract description of a piece of hardware and other components, reflecting a data-center building block on different granularity levels. A DEBB contains hardware- and thermodynamic models used by SVD toolkit [5] to sim-ulate workload, heat- and airflow, enabling (energy-efficiency) assessment and optimization of different configurations of data centers built of these building blocks (DEBBs).
Within CoolEmAll, a DEBB is organized hierarchically and can be described on following granularity levels:
1. Node Unit reflects the finest granularity of building blocks to be modeled within CoolEmAll - a single blade CPU module, a so-called ”pizza box”, or a RECS CPU module.
2. Node Group reflects an assembled unit of building blocks of level 1, e.g. a complete blade center or a complete RECS unit (currently consisting of 18 node-units).
3. ComputeBox1 reflects a typical rack within an IT service center, including building blocks of level 2 (Node Groups), power supply units and integrated cooling devices.
4. ComputeBox2 building blocks are assembled of units of level 3, e.g. reflect-ing a container or even complete compute rooms, filled with racks, power-units, cooling devices, etc.
Fig. 1. DEBB structure
The structure of the DEBB is shown in Figure 1. The formal specification of DEBBs along with selected formats is described in [12], and contains description of:
(a) The hierarchy of a DEBB with aggregation and position of its objects (lower level DEBBs) is described in PLMXML [13] format, allowing references to description of models or profiles in different formats, listed below.
(b) Geometrical data describing object-shapes, necessary for CFD simulation, is expressed in STL [14] format, and is referenced from the object description in PLMXML file. The combination of these two formats: PLMXML for description of the DEBB hierarchy with position of its objects (lower level DEBBs) and STL for description of object-shapes, enables to model any scene definition (needed for CFD simulation) on different granularity levels, such as a server-room consisting of cooling components, racks, power-units, and other devices. Often a geometry for CFD simulations is simplified to reduce execution time of simulations. Hence,
DEBB also contains a separate model for visualization (see point (f)).These files are optional so either STL or VRML can be used for visualization.
(c) The PLMXML file, describing DEBB hierarchy, contains for each object a corresponding reference to its technical description, DEBB Component, describ-ing its manufacturer and model in a CIM based format. This allows a workload simulator to identify the node type being selected for workload execution and correlate it with its power-usage profile. The entire XSD schema for specification of DEBB Components is described in [12].
(d) Power-usage profile is embedded into DEBB Component and describes for each load level of a particular component type (model and manufacturer) its corresponding power-usage, enabling calculating and simulating power con-sumption and heat load for different utilization levels during the simulation of the workload execution. This allows assessing power-usage of workload being executed on particular component types, such as node-types.
(e) Thermodynamic profile, stating air-throughput of fans for different lev-els and cooling capacity of cooling devices is defined in scope of DEBB Com-ponent schema definition. Thermodynamic profile is used by workload simu-lator to calculate air flow - initial boundary conditions necessary for airflow and heat-distribution simulation. The entire XSD schema for specification of thermodynamic-profile is described in scope of Component Description schema, in [12].
(f) Geometrical data for visualisation of DEBB and their shapes is described in VRML format. It is referneced from PLMXML in the same manner as geometric shapes (STL format) objects for CFD simulation.
(g) Metrics are described in XML format, embedded into PLMXML with user defined values.
As mentioned, a DEBB contains models used by SVD toolkit [5] to simulate power usage and airflow caused by workloads, enabling assessment and optimiza-tion of different configuraoptimiza-tions of data centers built of building blocks. Hence, a simulation of a DEBB on level n (e.g. ComputeBox2 level), requires DEBBs of level n-1 (e.g. ComputeBox1). As the focus of CoolEmAll is to simulate thermal behavior of a DEBB to enable design of energy-efficient building blocks, it is modeled as the smallest unit in the thermodynamic modeling process. As such, the complete Node Unit is the smallest feature that will be present in a simu-lation. The thermodynamic processes within a Node Group are modeled using Node-Unit models, allowing to simulate accurate heat distribution within the Node-Group. The ComputeBox1 simulations will require - besides the arrange-ment of the Node Groups - the velocity field and temperature at the Node Group outlets over time as inbound boundary condition and will provide the room tem-perature over time at the outlet of the Node Group. Similarly, the simulation of compute-room (ComputeBox2) or a container will require velocity field and temperature on inlets and outlets of ComputeBox1, reducing simulation models to required level. The following sections contain descriptions of DEBB specifica-tion elements. Addispecifica-tionally, the general analysis and classificaspecifica-tion of metrics for evaluation of data centers and DEBBs can be found in [15].
3.2 DEBB Energy-Efficiency Profiles
Power Profile. The key characteristics of data center components is obviously their power use. However, to analyze data centers efficiency in dynamic settings power values should be known for various loads and conditions.
In the case of IT equipment the power function may depend on its power states, load or even specific applications that are executed on resources. Total power usage can be also completed by adding constant power usage of compo-nents that does not depend on load or state of resources.
Main cause of power usage and heat dissipation are processors. Generally, the power consumption of a modern CPU is given by the formula:
P = C · Vcore2 ·f (1)
with C being the processor switching capacitance, Vcore the current P-State’s
core voltage and f the frequency. Based on the above equation it is suggested that although the reduction of frequency causes an increase in the time of execution, the reduction of frequency also leads to the reduction of Vcore and thus the
power savings from the P ∼ V2
core relation outweigh the increased computation
time. However, experiments performed on several HPC servers shown that this dependency does not reflect theoretical shape and is often close to linear [8]. This phenomenon can be explained by impact of other component than CPU and narrow range of available voltages.
Furthermore, detailed power usage of components such as CPUs or memory are usually unavailable. For these reasons, CoolEmAll DEBBs allow users to define dependencies between power usage and resource states (such as CPU frequency) in the form of tables. If more complex dependencies must be modeled the SVD Toolkit enables definition of arbitrary functions using energy estimation plugins.
There are two basic approaches to model power usage of resources in DEBBs: static and resource load model [16].
Static model is based on a static definition of resource power usage. This model calculates the total amount of energy consumed by the computing resource system as a sum of energy, consumed by all its components (processors, disks, power adapters, etc.). More advanced versions of this approach assume definition of resource states (e.g. CPU P-states) along with corresponding power usage. This model follows changes of resource power states and sums up the amounts of energy defined for each state. In this case, specific values of power usage are defined for all discrete n states as shown in (2):
Si →Pi, i = 1, .., n (2)
Resource load model extends the static power state description and enhances it with real-time resource usage, most often simply the processor load. In this way it enables a dynamic estimation of power usage based on resource basic power usage and state (defined by the static resource description) as well as resource load. In this case, specific values of power usage are defined for all pairs state and load values (discretized to l values) as shown in (3):
(Si, Lj) → Pij, i = 1, .., n, j = 1, ..., l (3)
The power usage of computing resources may strongly depend on a type of ex-ecuted application [9] [10]. Therefore, CoolEmAll power profiles allows defining power usage functions for specific application classes based on application pro-files. In the example of DEBB (Section 4.3) we show differences between power profiles for selected diverse applications.
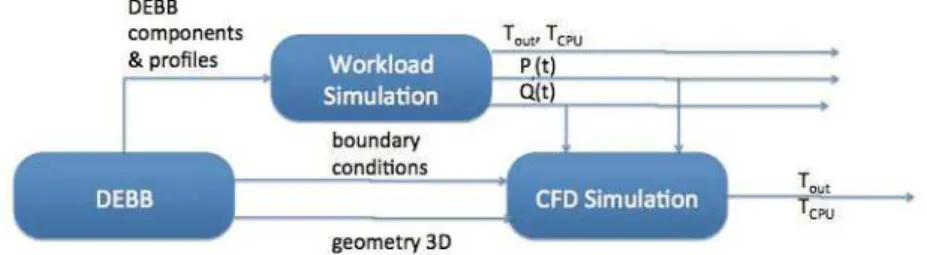
Thermodynamic Profile. Thermodynamics properties include both air throughput and thermal models. While estimation of power usage P (t) and air throughput Q(t) in time for all nodes is sufficient to compute temperatures using Computational Fluid Dynamics (CFD) methods, we also propose thermal models that allows simplified and faster calculations. Two ways of simulations with the use of the SVD Toolkit are illustrated in Figure 2.
Fig. 2. Two ways of simulations with the use of the SVD Toolkit
In the first approach that assumes the use of a CFD solver to simulate detailed thermal distributions, power usage and airflow throughput must delivered as an input. Power usage is estimated based on profiles defined in Section 3.2. The airflow throughput is modeled using the air throughput profile, which enables specification of the throughput (measured in m3/s) depending on the state of resource. The state of resource include its power state (in particular if it is on or off) but also a temperature T , which determines the air throughput level. General profile can be defined as (4). Some consideration and tests of the air throughput in a concrete server are included in Section 4.3.
Q =
0, for node off; Q(T0), for T ≤ T0;
Q(Ti), for Ti−1 < T ≤ Ti, i > 0.
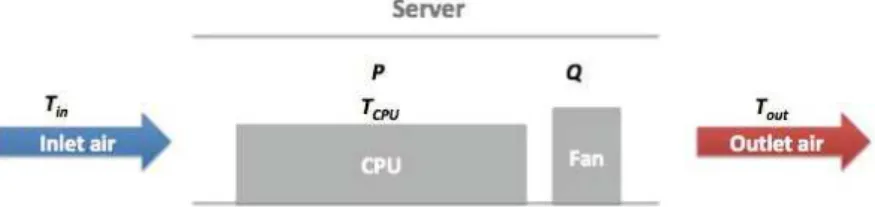
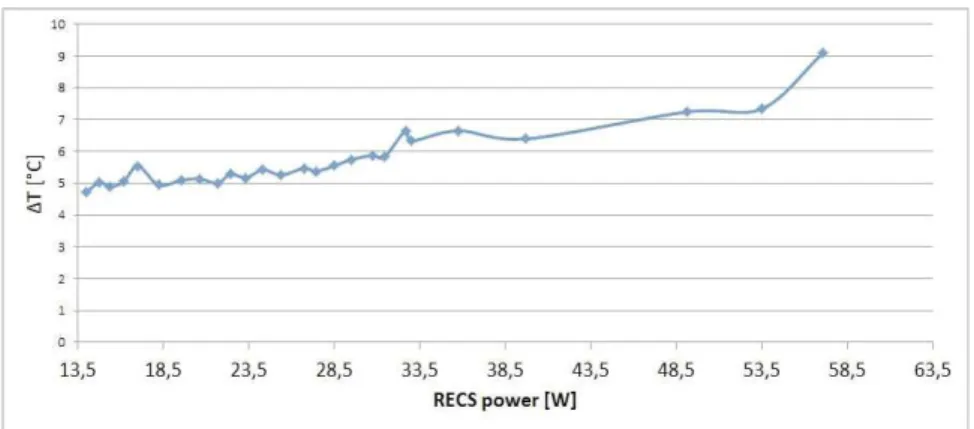
(4) In order to create simplified thermal models of DEBBs we use basic thermo-dynamics rules and empirical data. For instance, for server illustrated in Figure 3 we can express dependency between power usage and change of temperature (between outlet and inlet temperature) by( 5), where ρ denotes air density, Q air throughput, and C air heat capacity. However, this dependency assumes ideal
case where the whole heat is dissipated into the outlet air. In practice, heat is often dissipated in other directions so to cope with this issue we introduced a parameter δ, which should be found empirically. The final formula to calculate outlet temperature is given in (6).
Fig. 3. Air flow in a single CPU server, section view
P = ρ · Q · C · ∆T (5)
Tout = Tin+ δ
P
ρ · Q · C (6)
The example of formula derived for concrete servers and calculating δ are presented in Section 4.
4
Case Study: Building Blocks for RECS System
In this section we present a DEBB for a specific type of servers delivered by the Christmann company. Although the system provided by Christmann is a specific prototype it represents an important and emerging class of solutions that allow integrating a significant number of servers in few rack units. These solutions require more complex modeling of interrelationships between their components then traditional servers. The thermal and power usage analysis of such high-density systems is also of a great importance. For this reason, a multi-node RECS system is a good test case for illustration of DEBB design and modeling. 4.1 Efficient RECS Server Prototypes
The test case system, called RECS [5], is a high density multi-node computer that consists of 18 single server nodes within one Rack Unit. To enable the user to have a fine-grained monitoring- and controlling-system, the RECS has a dedicated master-slave system of microcontrollers integrated that can gather different metrics directly without the need of polling every single node or the need of Operation System support [2]. This enables us in the CoolEmAll project to gather many metrics like power usage, status and temperature for every node via only one request. Importantly, RECS can be equipped with diverse computing nodes ranging from high performance Intel i7 processors to Intel Atom CPUs or even embedded ARMs.
According to the DEBB hierarchy levels (defined in Section 3.1) each of RECS containing different CPUs can be defined as a separate DEBB and its model with profiles can be inserted into simulations. On the other hand, the whole set of RECS systems located in a single rack enclosure can be defined as a DEBB too. The decision depends on a scope of simulations and interests of a data center designer or analyst. In this paper we focus on modeling energy-efficiency profiles of computing nodes in a single RECS system (1 rack unit).
In the next section, we describe the actual testing environment used to con-struct DEBBs built on top of RECS systems.
4.2 Testbed Configuration
The testbed used to build and verify models of hardware consists of 3 RECS systems equipped with diverse kinds of CPUs. In the testbed used as a reference for building RECS models there are 3 major CPU types: Intel i7, AMD Fusion, and Intel Atom. Detailed specification of these CPUs is as follows:
– CPU: AMD G-T40N Processor @ 1GHz, CPU Cache: 512 KB, CPU Cores#: 2, RAM: 3.5 GB
– CPU: Intel Atom N2600 @ 1.60GHz, CPU Cache: 512 KB, RAM: 2 GB – CPU: Intel Core i7-3615QE CPU @ 2.30GHz, CPU Cache: 6144 KB, RAM:
16 GB
– CPU: Intel Core i7-2715QE CPU @ 2.10GHz, CPU Cache: 6144 KB, RAM: 16 GB
Processors of each of these types are grouped in a single 18-nodes RECS system placed in one rack unit. Experiments were conducted using the Phoronix benchmark suite [17]. In particular, we run benchmarks such as pybench, c–ray, and unpack linux. In this way, we introduced various classes of applications: sequential single-core, scalable CPU-intensive, and IO-intensive computations. For each of the benchmark we imposed several load values: 25%, 50%, 75%, 100%. Additionally, we used 12.5% for Intel i7 processors to model load corresponding to a usage of one (of eights) single core (taking into account hyper-threading mechanism).
4.3 Modeling Building Blocks for RECS
Description of DEBBs for RECS is accompanied by models of servers’ perfor-mance, power usage and thermodynamic properties. The models found for the configuration of the RECS system are presented in next sections. Thermodynam-ics properties include both air throughput and thermal models. While estimation of power usage and air throughput is sufficient to compute temperatures using Computational Fluid Dynamics (CFD) methods, we also propose thermal mod-els that allows simplified and faster calculations as it was presented in Section 3.2.
Power Models. As presented in Section 3.2 DEBB specification allows to pre-cisely define the power usage of modeled hardware in various states and condi-tions. We applied the resource load model, which define power usage with respect to given P-state (CPU frequency) and load. Dependencies between these values for Intel i7, AMD Fusion, and Intel Atom processors are presented in figures below.
Dependency between Load, CPU Frequency and Power Usage
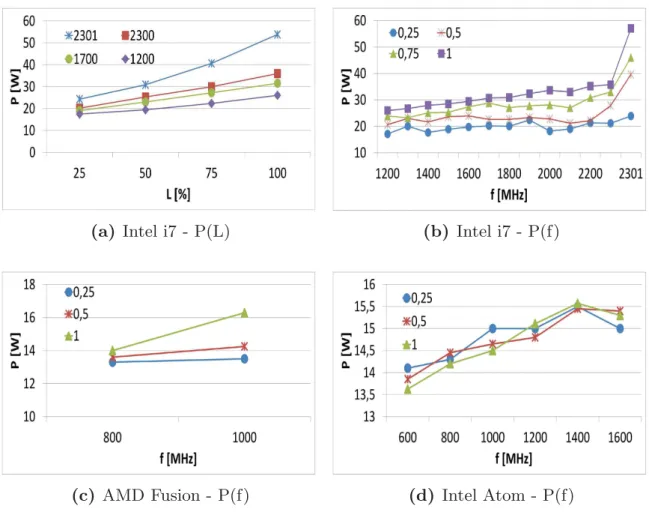
Figure 4a illustrated dependency between load and power usage for selected CPU frequencies whereas Figure 4b between CPU frequency and power usage for var-ious loads in Intel i7 CPU. While close to linear relation of power from load is usually expected, the power - CPU frequency relation does not follow theoreti-cal quadratic (or even cubic) relation. Some possible reasons of this phenomenon are given in Section 3.2. It is also easy to see significant growth of power usage for the highest CPU frequency. Please note that for i7 processors, Turbo Boost technology is activated only for the maximum frequency. Hence power consump-tion and computing capabilities are different for 2300 and 2301MHz as the latter can in fact go slightly higher as long as it stays under the thermal design power (TDP).
Power profiles of RECS nodes based on AMD Fusion and Intel Atom proces-sors are presented in Figures 4c and 4d. In case of low power Atom-based nodes power changes slightly with respect to CPU frequency and even less for changing load. In the case of AMD processors variability is also reduced mostly due to limited number of frequencies and cores. Compared to these processors Intel i7 provides large range of possible power usage and temperature values so that it makes sense to look closer to their optimal use.
Dependency between Load, CPU Frequency and Power Usage for Spe-cific Application Classes
In CoolEmAll we model various applications including description of their phases as presented in [18]. How important is a possibility of distinction between energy efficiency of servers for various classes of applications can be seen in Figure 5. Dependency between power and CPU frequencies are presented for three differ-ent applications: single threaded pybench application, compute intensive scalable c-ray application, and IO-intensive unpacking task. As pybench application uses one core we run c-ray application with 12.5% and 25% load in order to obtain equivalent of fully loaded one logical (including hyper-threading) or physical core, respectively. The presented curves differ significantly, which shows that to obtain a precise model application classes must be taken into account. Further-more, comparing power usage by pybench and c-ray which load the whole CPU at the same level but pybench at one core whereas c-ray evenly through all cores, we can see that the latter requires less lower power to run.
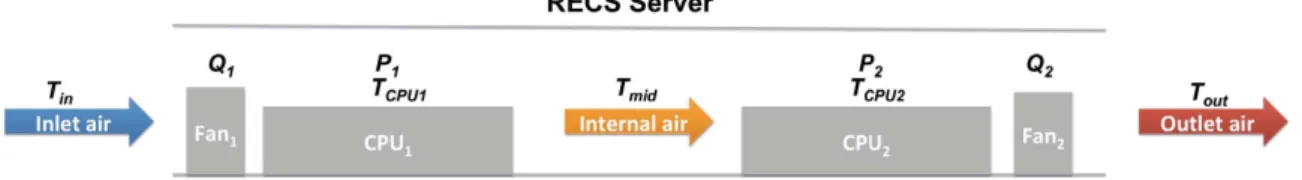
Air throughput Profile. General dependency between dissipated heat, inlet temperature and CPU/outlet temperature was briefly presented in Section 3.2. However, Christmann servers are quite specific. Flow of air from inlet to outlet through the RECS system is presented in [2] and Figure 6 (section view). This
(a) Intel i7 - P(L) (b) Intel i7 - P(f)
(c) AMD Fusion - P(f) (d) Intel Atom - P(f)
Fig. 4. Power in function of load and CPU frequency Top: Power in function of load (left) and CPU frequency (right) for Intel i7 Bottom: Power in function of CPU frequency for AMD Fusion (left) and Intel Atom (right)
Fig. 5. Power profiles of Intel i7 processor for various applications
architecture has its consequences in the air flow properties. The mean air flow throughput of a single fan is equal to 0.22m3/min (i.e. 0.0037m3/s) and it is constant regardless the CPU load and temperature. However, the air inside RECS enclosure can move in various directions and mix with air from other nodes. Based on our experiments the air throughput measured at the outlet and
generated by the inlet node (in the first row) with the outlet node switched off was equal just to 45% of the full throughput generated by all nodes. In this way there is a dependency between power states (in this case on/off) and locations (on/off neighbors) and air throughput. This fact must be taken into account within simulation therefore should be defined within DEBB. However, for calculations of temperatures we assumed that the throughput over specific nodes inside the RECS are the same (we could not verify this assumption as we do not have air flow sensors inside enclosure of RECS).
Fig. 6. Flow of air through a couple of nodes in RECS system, section view. Fans are on the side of the RECS.
Thermal Profile. The RECS architecture must be also reflected in thermal profile in DEBB. Therefore two sources of heat must be taken into account as well as two values of δ. The input temperature for CP U2 is Tmid being an outlet
temperature from CP U1. Then according to (6) we define temperatures as:
Tout = Tmid+ δ2 P2 ρ · Q2·C , Tmid = Tin+ δ1 P1 ρ · Q1·C , (7)
Hence, Tout can be calculated as follows:
Tout = Tin+ δ1 P1 ρ · Q1·C + δ2 P2 ρ · Q2·C , (8)
In order to derive values of δ1 and δ2, we executed tests on nodes in a single
row at once (inlet row to calculate δ1 and outlet row for δ2) so that there was
only one source of heat per each couple of nodes in one column. The obtained values were δ1 = 1.78 and δ2 = 2.1.
Having these δ values calculated and assuming the same air throughput for both inlet and outlet nodes (in case both nodes are switched on) we can model Tout in simulations (Section 5). However, even without simulations certain
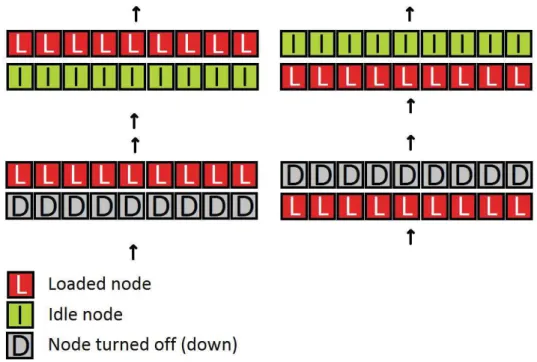
ob-servations related to location of utilized computing nodes were made based on experiments conducted on our testbed. In Figure 8 we present 4 diverse states of a RECS system. Starting from top of the figure: (1) nodes in the second (outlet) row are loaded while nodes in the first (inlet) row are idle, (2) nodes in the first row are loaded while nodes in the second row are idle, (3) nodes in the second row are loaded while nodes in the first row are switched off, and (4) nodes in the first row are loaded while nodes in the second row are switched off. For such con-figurations we observed that: differences of outlet temperatures between states 1
Fig. 7. Difference between outlet and inlet temperature in function of power usage
and 2 are negligible, for state 2 are much higher (2-2.5◦C) than for state 4, also
for state 3 are significantly higher then for state 4 (0.6-2.6◦C). Interesting case
is the difference between state 1 and 3. For the highest load outlet temperatures are higher in state 3 (by around 0.5◦C) than in state 1 while for lower loads
opposite occurs. For loads 0.75, 0.5, 0.25 and 0.125, outlet temperature in state 3 is lower than in state 1 by 0.3, 1.0, 1.1 and 1.5◦C, respectively. This uncommon behavior can be explained by a support in removing hot air by a second fan of idle node in state 1. If load of the outlet node decreases gain from additional fan is reduced compared to heat dissipated by the idle node. Additionally, we noticed usual increase of temperatures for nodes under significant load close to measurement points (0.1-0.7◦C). As it also happened for inlet temperatures it
suggests that this change is caused by heat dissipated in other ways than passed by flowing air.
5
Application of Models in Data Center Simulations
DEBBs available in the CoolEmAll repository can be used in tools being part of the SVD Toolkit [5] to simulate and analyze energy-efficiency of data cen-ters. One of these tools is a Data Center Workload and Resource Management Simulator (DCworms) [16][19]. In general, DCworms allows modeling and simu-lation of data center computing infrastructures to study their performance and energy-efficiency. As explained in Section 3.2, it can be used as a tool providing input (power usage, air throughput) to heat transfer CFD simulations or as a simulator that provides rough estimations of temperatures, too. To this end, we use DCworms to verify power usage and thermodynamic models proposed in previous sections and perform experiments in order to get insights into a few examples of management policies.
5.1 Verification of Models
In the first step simple experiments reflecting tests in real environment were per-formed to verified obtained models. These models include two issues: (i) modeling
Fig. 8. Various configurations of switched on/off and loaded/idle computing nodes in RECS system (States: 1, 2, 3, 4 starting from the top)
and estimating power usage and (ii) modeling and estimating outlet tempera-tures. Results of this verification are briefly summarized below.
The application of power profiles in a simulation environment allows esti-mating power usage of hardware components based on load and P-state of the system. While we were able to include all measured values of P-states the load had to be discretized (to 25%, 50%, 75%, and 100%). To estimate power usage for load in between values defined in the profile we used linear interpolation. The mean error of such estimation exceeded slightly 2W, from 0.62W to 4.22W for various frequencies and load ranges. Overwhelming majority of errors were over-estimations. Factors that especially affected the accuracy of prediction included hyper-threading mechanism and Turbo Boost mode in the Intel i7 processor, which are difficult to model.
Proposed outlet temperature estimation models along with calculated δ values gave mean errors 0.78 and 0.81 degree Celsius, respectively. For both inlet and outlet nodes switched on at the same time errors were slightly bigger so for more detailed heat transfer analysis CFD simulations are needed taking as an input the power usage and air throughput delivered by DCworms. Generally, CoolEmAll users have these two options to choose depending on purpose and timeline of their experiments.
5.2 Simulation Experiments
Using DCworms we simulated execution of workloads on resources defined by DEBBs for RECS. In particular, to increase the accuracy of obtained results, we performed our experiments for one single homogeneous RECS unit based
on i7 nodes. However, more complex architectures ranging from racks up to the whole data center can also be evaluated. For the experimental purposes, we incorporated the proposed outlet temperature estimation models into the DCworms. Jobs were managed by 3 simple policies: lef t2right - allocating jobs from the left to the right side of RECS in both rows, in2out - allocating jobs from the inlet nodes to the outlet row, out2in - allocating jobs from the inlet nodes to the outlet row.
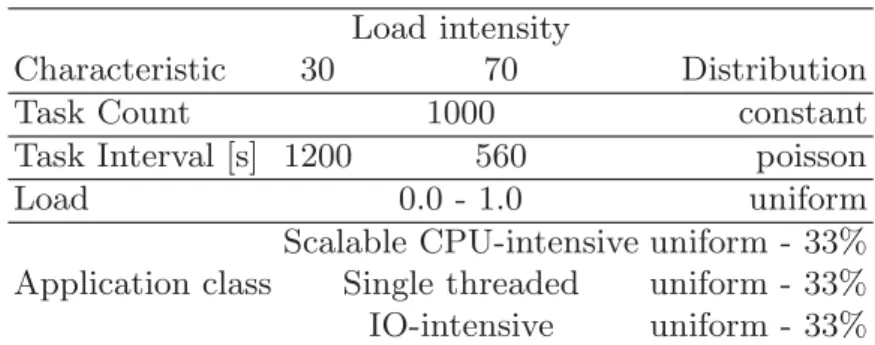
The details of a workload used in this experiment are presented in Table 1.
Table 1. Workload characteristics
Load intensity
Characteristic 30 70 Distribution Task Count 1000 constant Task Interval [s] 1200 560 poisson Load 0.0 - 1.0 uniform
Application class
Scalable CPU-intensive uniform - 33% Single threaded uniform - 33% IO-intensive uniform - 33%
The Table 2 summarizes the results. As expected, that greater load results in higher outlet temperatures. Moreover, even if mean outlet temperatures are similar between different policies, the variability of these temperatures may dif-fer. Additionally, for policies out2in and in2out differences between standard deviation are opposite for various workloads (in this case 30 and 70%).
Table 2. Mean outlet temp (◦C) and standard deviation for 30% and 70% workload
30% 70%
policy left2right30 in2out30 out2in30 left2right70 in2out70 out2in70 mean 26.96 26.87 27.15 28.79 28.72 28.89 std. dev. 1.99 0.715 0.83 1.68 1.00 0.85
This simple example of DCworms usage demonstrates how DEBBs can be applied within SVD Toolkit to study energy-efficiency of data centers, in par-ticular to topics such as capacity management, power capping, and thermal-aware scheduling. Additionally, to study phenomena such as air turbulences and heat transfers within the whole data center, the Computational Fluid Dynamics (CFD) simulations are applied. To this end, we use CoolEmAll SVD Toolkit tools that take as an input DEBB geometry models and boundary conditions from the output of workload simulations presented in this section.
6
Conclusions
In this paper, we presented a concept of open Data Center Efficiency Building Blocks (DEBBs) - descriptions and models of hardware that can be used to build and enhance data centers. The role of DEBBs is to provide models that can be easily inserted into simulations (both of workloads and heat transfer) and visual-ization. Hence, a DEBB consists of several parts defined in common or standard formats where possible. We demonstrated the DEBB concept on an example of a prototype multi-node high-density system called RECS. We presented power usage and thermodynamics models, which can be applied to more complex sim-ulations of data centers. To perform these simsim-ulations larger number of DEBBs along with models of additional devices such as UPS must be added. To analyze air flow processes in more detail CFD simulations should be applied which, al-though out of the scope of this paper, are part of the CoolEmAll SVD Toolkit functionality. DEBBs defined within CoolAmAll project are available through the DEBB repository at the CoolEmAll website [20]. Among future work we plan to improve precision of thermodynamic models and add more energy-efficiency and performance information for well defined application classes. We are go-ing to apply prepared DEBBs in various simulation studies includgo-ing tests with management policies as well as data center cooling infrastructures.
Acknowledgements. The results presented in this paper are partially funded by the European Commission under contract 288701 through the project CoolE-mAll and by a grant from Polish National Science Center under award number 636/N-COST/09/2010/0.
References
1. The Green Grid Data Center Power Efficiency Metrics: PUE and DCiE, http://www.thegreengrid.org/Global/Content/white-papers/
The-Green-Grid-Data-Center-Power-Efficiency-Metrics-PUE-and-DCiE
2. Kipp, A., Schubert, L., Liu, J., Jiang, T., Christmann, W., vor dem Berge, M.: Energy Consumption Optimisation in HPC Service Centres. In: Topping, B.H.V., Ivanyi, P. (eds.) Proceedings of the Second International Conference on Parallel, Distributed, Grid and Cloud Computing for Engineering. Civil-Comp Press, Stir-lingshire (2011)
3. Mammela, O., Majanen, M., Basmadjian, R., De Meer, H., Giesler, A., Homberg, W.: Energy-aware job scheduler for high-performance computing. Computer Sci-ence - Research and Development 27(4), 265–275 (2012)
4. The MontBlanc project website, http://www.montblanc-project.eu/
5. vor dem Berge, M., Da Costa, G., Kopecki, A., Oleksiak, A., Pierson, J.-M., Pio-ntek, T., Volk, E., Wesner, S.: Modeling and Simulation of Data Center Energy-Efficiency in CoolEmAll. In: Huusko, J., de Meer, H., Klingert, S., Somov, A. (eds.) E2DC 2012. LNCS, vol. 7396, pp. 25–36. Springer, Heidelberg (2012)
6. Woessner, U., Volk, E., Gallizo, G., vor dem Berge, M., Da Costa, G., Domagal-ski, P., Piatek, W., Pierson, J.-M.: D2.2 Design of the CoolEmAll simulation and visualisation environment - CoolEmAll Deliverable (2012), http://coolemall.eu
7. Future Facilities, http://www.futurefacilities.com/
8. Basmadjian, R., Ali, N., Niedermeier, F., de Meer, H., Giuliani, G.: A methodology to predict the power consumption of servers in data centers. In: Proceedings of the 2nd International Conference on Energy-Efficient Computing and Networking 2011 (e-Energy). ACM, New York (2011)
9. Da Costa, G., Helmut, H., Karin, H., Jean-Marc, P.: Modeling the Energy Con-sumption of Distributed Applications. In: Handbook of Energy-Aware and Green Computing. Chapman & Hall, CRC Press (2012)
10. Witkowski, M., Oleksiak, A., Piontek, T., Weglarz, J.: Practical power consumption estimation for real life HPC applications. Future Generation Computer Systems 29, 208–217 (2012)
11. Mukherjee, T., Banerjee, A., Varsamopoulos, G., Gupta, S.K.S.: Model-driven co-ordinated management of data centers. Comput. Netw. 54(1), 2869–2886 (2010), http://dx.doi.org/10.1016/j.comnet.2010.08.011,
doi:10.1016/j.comnet.2010.08.011
12. Hoyer, M., vor dem Berge, M., Volk, E., Gallizo, G., Buchholz, J., Fornos, R., Siso, L., Piatek, W.: D3.2 First definition of the modular compute box with integrated cooling - CoolEmAll (2012), http://coolemall.eu
13. PLM XML Schema, Siemens (January 8, 2013),
http://www.plm.automation.siemens.com/legacy/products/ open/plmxml/docs/v6.0.2/PLMXMLSchema.xsd
14. The STL Format (January 8, 2013), http://www.ennex.com/~fabbers/StL.asp 15. Sis, L., Forns, R.B., Napolitano, A., Salom, J., Da Costa, G., Volk, E., Donoghue,
A.: D5.1 White paper on Energy- and Heat-aware metrics for computing modules - CoolEmAll Deliverable (2012), http://coolemall.eu
16. Kurowski, K., Oleksiak, A., Piatek, W., Piontek, T., Przybyszewski, A., Weglarz, J.: DCWoRMS - a tool for simulation of energy efficiency in distributed computing infrastructures. Simulation Modelling Practice and Theory (to appear, 2013) 17. http://www.phoronix-test-suite.com/
18. Chetsa, G.L.T., Lefevre, L., Pierson, J.-M., Stolf, P., Da Costa, G.: DNA-Inspired Scheme for Building the Energy Profile of HPC Systems. In: Huusko, J., de Meer, H., Klingert, S., Somov, A. (eds.) E2DC 2012. LNCS, vol. 7396, pp. 141–152. Springer, Heidelberg (2012)
19. Bak, S., Krystek, M., Kurowski, K., Oleksiak, A., Piatek, W., Weglarz, J.: GSSIM - a Tool for Distributed Computing Experiments. Scientific Programming 19(4), 231–251 (2011)