INFORMATION TO USERS
This manuscript has been reproduced from the microfilm master. UMI films the text directly from the original or copy submitted. Thus. some thesis and dissertation copies are in typewriter face, while others may be from any type of computer printer.
The quality of this reproduction is dependent upon the quality of the copy submitted. Broken or indistinct print, colored or poor quality illustrations and photographs, print bleedthrough, substandard margins, and improper alignment can adversely affect reproduction.
ln the unlikely event that the authqr did not send UMI a complete manuscript and there are missing pages, these will be noted. Also, if unauthorized copyright material had to be removed, a note will indicate the deletion.
Oversize materials (e.g., maps, drawings. charts) are reproduced by sectioning the original, beginning at the upper left-hand corner and continuing from left to right in equal sections with small overlaps.
Photographs included in the original manuscript have been reproduced xerographically in this copy. Higher quality 6" x 9" black and white photographie prints are available for any photographs or illustrations appearing in this copy for an additional charge. Contact UMI directly to order.
ProQuest Information and Leaming
300 North Zeeb Road, Ann Arbor, Ml 48106-1346 USA 800-521-0600
NOTE TO USERS
This reproduction is the best copy available.
UNIVERSITY OF SHERBROOKE
GAIT TERMINATION IN THE YOUNG,
THE HEAL THY ELDERL Y,
AND THE ELDERL Y WITH TYPE 2 DIABETES
AFFECTED BY PERIPHERAL NEUROPATHY
BY
MARGRIT-REGULA MEIER
THESIS PRESENTED TO THE FACUL TY OF MEDICINE WITH REGARD TO OBTAINING THE DEGREE OF PHILOSOPHIAE DOCTOR (PH.0.) IN CLINICAL SCIENCES
NOVEMBER 1999
l+I
National Libraryof Canada du Canada Bibliothèque nationale Acquisitions et
Acquisitions and
Bibliographie Services services bibliographiques
395 Wellington Street Ottawa ON K1A ON4 Canada
395, rue Wellington Ottawa ON K1 A ON4
Canada
The author has granted a
non-exclusive licence allowing the
National Libraiy of Canada to
reproduce, loan, distribute or sell
copies of this thesis
inmicroform,
paper or electronic formats.
The author retains ownership of the
copyright
inthis thesis. Neither the
thesis nor substantial extracts from it
may be printed or otherwise
reproduced without the author' s
permiss10n.
Your 516 Votre réterenca Cur file Notre rélér&nce
L'auteur a accordé une licence non
exclusive permettant à la
Bibliothèque nationale du Canada de
reproduire, prêter, distribuer ou
vendre des copies de cette thèse sous
la forme de microfiche/film, de
reproduction sur papier ou sur format
électronique.
L'auteur conserve la propriété du
droit d'auteur qui protège cette thèse.
Ni la thèse
nides extraits substantiels
de celle-ci ne doivent être imprimés
ou autrement reproduits sans son
autorisation.
MEMBERS OF THE EXAMINATION BOARD Chair Thesis Co-su pervisor External Examiner External Examiner
Prof. Hélène Payette, Ph.D.
Directrice de programme des sciences cliniques Université de Sherbrooke
Faculté de médecine
Département des sciences infirmières 3001, 12e Avenue Nord
Sherbrooke, Québec, CANADA, J1 H 5N4
Dr. Johanne Desrosiers, Ph.D. Université de Sherbrooke Faculté de médecine
Département des sciences de la santé communautaire 3001, 12e Avenue Nord
Sherbrooke, Québec, CANADA, J1 H 5N4
Dr. Jean-Marie Ékoé, M.D. Centre de recherche
CHUM, Pavillon Hôtel Dieu 3850, rue St. Urbain
Montréal, Québec, CANADA, H2W 1T8
Dr. Denis Gravel, Ph.D. Université de Montréal École de réadaptation
Pavillon Marguerite D'Youville
2375 Chemin de la Côté Ste Catherine Montréal, Québec, CANADA, H3C 3J7
MEMBERS OF THE EXAMINATION BOARD (CONT.)
External Examiner Dr. Braford McFadyen, Ph.D.
Groupe de recherche en réadaptation physique Institut de réadaptation en déficience physique de Québéc
Site François-Cheron 525, boui. Hamel
Ta
TABLE OF CONTENTS
LIST OF ILLUSTRATIONS {TABLES AND FIGURES) ... ix
GLOSSARY OF GAIT TERMINATION SPECIFIC TERMS ... xi
RÉSUMÉ ... 1
ABSTRACT ... 5
1.
INTRODUCTION AND RATIONALE ...8
2.
LITERATURE REVIEW ...11
2.1. GAIT ... 11
2.1.1. Gait Characteristics ... 13
2.2. AGE-RELATED CHANGES IN GAIT ... 24
2.2.1. The Ageing Nervous System ... 24
2.2.2. The Ageing Muscle-Skeletal System ... 26
2.2.3. The Ageing Cardiovascular System ... 27
2.2.4. The Ageing Visual System ... 27
2.2.5. The Ageing Gait ... 29
2.3. GAIT TERMINATION ... 32
2.4. DIABETES MELLITUS AND ITS COMPLICATIONS ... 42
2.4.1. Introduction ... 42
2.4.2. Diabetic Neuropathy ... 45
2.4.4. Foot Ulceration ... 54
2.4.5. Diabetic Retinopathy ... 56
3.
OBJECTIVES AND HYPOTHESES OF THE STUDY ...59
4.
METHODOLOGY ...61
4.1. PARTICIPANTS ... 61
4.1.1. Eligibility Criteria ... 61
4.1 .2. Recruitment of the Participants ... 64
4.2.
VARIABLES, THEIR JUSTIFICATION AND RELATED MEASUREMENT INSTRUMENTS ... 674.2.1. Sociodemographic and Anthropometric Variables ... 68
4.2.2. Contrai Variables ... 70
4.2.3. Biomechanical Variables ... 76
4.3. DATA COLLECTION PROCEDURE ...
85
4.3.1. Data Collection Procedure for the Young Participants ... 85
4.3.2. Data Collection Procedure for the Participants with type 2 Diabetes ... 86
4.3.3. Data Collection Procedure for the Healthy Elderly Participants. 86 4.3.4. Gait Termination Data Collection Procedure ... 87
4.4. DATA PROCESSING ... 90
4.5.
STATISTICAL ANALYSES ... 974.6. SAMPLE SIZE ... 100
5.
RESULTS ...103
5. 1. SOCIODEMOGRAPHIC AND ANTHROPOMETRIC CHARACTERISTICS OF THE PARTICIPANTS ...
104
5.1.1. Continuous Variables ... 105
5.1.2. Categorical Variables ... 106
5.2.
CONTROL VARIABLES ...109
5.2.1. A/P COM Velocity ... 109
5.2.2. Vibration Sensitivity Threshold ... 11 O
5.3.
BIOMECHANICAL VARIABLES ...114
5.3.1. Foot Placement ... 114
5.3.2. COP and COM Maximal Overshoots ... 114
5.3.3. Force-related Variables ... 116
5.4.
HYPOTHESIS TESTING ...124
5.4.1. The First Hypothesis ... 124
5.4.2. The Second Hypothesis ... 125
5.4.3. The Third Hypothesis ... 126
5.4.4. The Fourth Hypothesis ... 129
6.
DISCUSSION ...131
6.1.
METHODOLOGICAL CONSIDERATIONS ...133
6.1.1. Effects of the Chosen Sampling Design ... 133
6.1.2. Sample Size and Participant Group Considerations ... 137
6.2.
DISCUSSION OF THE RESUL TS ...144
6.3.
FORCES AND LIMITS OF THE STUDY ...154
7.
CONCLUSIONS AND RECOMMENDATIONS ...156
ACKNOWLEDGEMENTS ...
159
REFERENCES ...161
APPENDICES Appendix 1 Appendix 2 Appendix 3 Appendix4Approval of the Ethical Committee
Information Letter for the Members of the Association des diabétiques de !'Estrie
Young Participants' Information Letter (French) Consent Forms of the
Young Participants (French)
Healthy Elderly Participants (French) Healthy Elderly Participants (English)
Elderly Participants with Type 2 Diabetes (French) Elderly Participants with Type 2 Diabetes (English) Appendix 5 Data Forms:
Socio-demographic Data (French) Socio-demographic Data (English) Nominal Data (French)
Nominal Data (English)
Appendix 5 Data Forms (cont.):
Vibration Sensitivity Threshold Test (MOL) Vision Acuity determined by the Snellen Chart
TABLE 1 TABLE 2 TABLE 2a TABLE 3 TABLE 4a TABLE4b TABLE4c TABLE 5 TABLE 6 TABLE 7a TABLE 7b TABLE 8 FIGURE 1 FIGURE 1a FIGURE 1b FIGURE 1c FIGURE 1d FIGURE 2 FIGURE 3
LIST OF ILLUSTRATIONS (TABLES AND FIGURES)
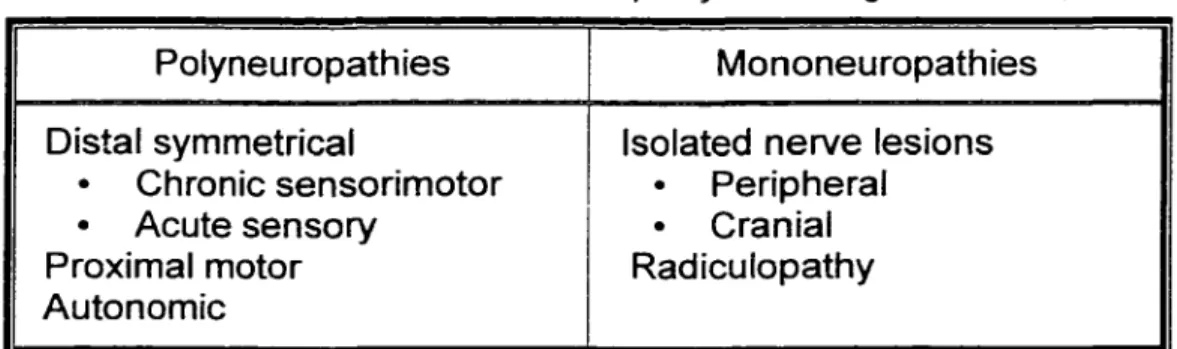
Classification of neuropathies according to Sherwin ... 49
Socio- and anthropometric data of the participants ... 106
Graduation of neuropathy according to Valk et al. ... 104
Results of the contrai variables ... 109
Results of the biomechanical variables ... 115
Results of the biomechanical variables: Approach Phase ... 117
Results of the biomechanical variables: Stopping Phase ... 121
Hypothesis 1 (results) ... 124
Hypothesis 2 (results) ... 125
Hypothesis 3a (results) ... 126
Hypotheses 3b and 3c (results) ... 127
Hypothesis 4 (results) ... 129
Illustration of COP and COM ... 16
COM forward velocity and corresponding A/P forces ... 18
Experimental set-up of Jian et al. 1993 ... 34
Experimental set-up of Cao et al. 1997 ... 36
Abdominal surface velocity during a typical sudden stopping trial according ta Cao et al. 1998 ... 37
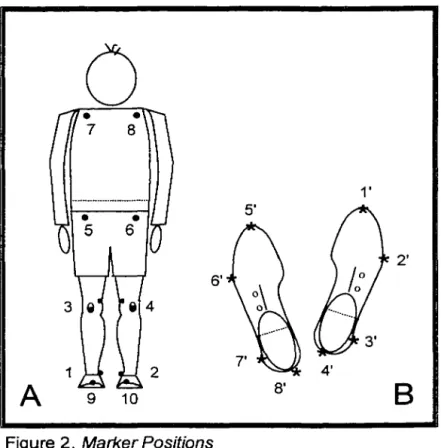
Marker positions ... 73
FIGURE 4 The COP and COM maximal overshoots ... 78
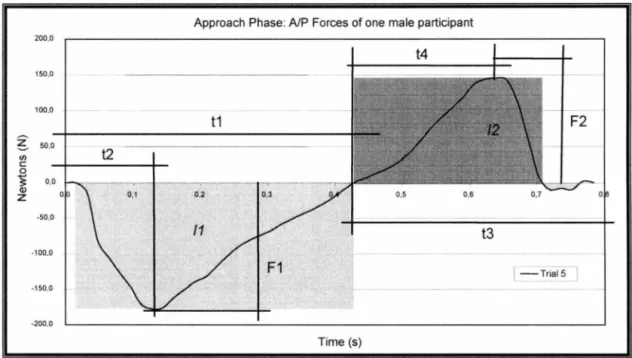
FIGURE 5 Definitions of the Approach Phase's force-related variables ... 81
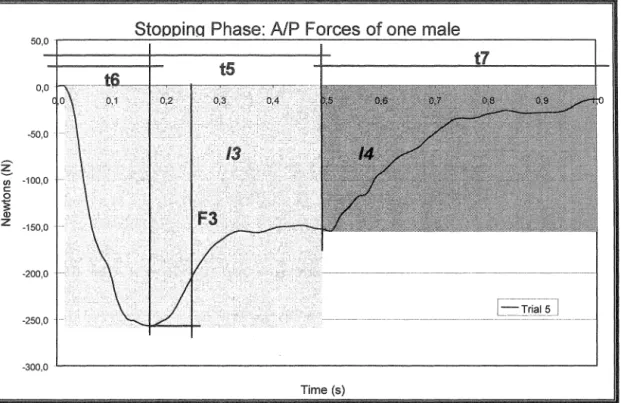
FIGURE 6 Definitions of the Stopping Phase's force-related variables ... 83
FIGURE 7 Laboratory overview and experimental set-up ... 88
FIGURE ?a Processing flowchart ... 91
FIGURE 8a A/P COM velocity profile during the Approach and Stopping Phases: Young ... 111
FIGURE 8b A/P COM velocity profile during the Approach and Stopping Phases: Elderly ... 111
FIGURE 8c A/P COM velocity profile during the Approach and Stopping Phases: Diabetics ... 112
FIGURE 8d A/P COM velocity profile during the Approach and Stopping Phases: Ali three groups ... 112
FIGURE 9a Approach Phase: A/P forces of the Young ... 118
FIGURE 9b Approach Phase: A/P forces of the Elderly ... 119
FIGURE 9c Approach Phase: A/P forces of the Diabetics ... 119
FIGURE 1 Oa Stopping Phase: A/P forces of the Young ... 122
FIGURE 10b Stopping Phase: A/P forces of the Elderly ... 122
GLOSSARY OF GAIT TERMINATION SPECIFC TERMS
A/P Anterior/posterior: back-and-forward movements in the walking direction.
Approach Phase
The step considered before the Stopping Phase. lt lasts from HC1 to HC2.
A/P COM velocity<0.05
mis
COM
COP
The point where, by definition, visually and biomechanically a full stop is reached. COM motions below 0.05
mis
are considered as movements, which occur during standing still.Centre of mass. Applied to biomechanics, it represents the mass centre of a persan (Figure 1, page 16).
Centre of pressure. lt represents the point of application of the resultant of all ground reaction forces acting upon the foot (Figure 1, page 16).
HC Heel Contact: The event in a gait cycle where the heel touches the ground. ln normal gait HC is considered as the beginning of a gait cycle.
HC1 Heel Contact 1: The start of the Approach Phase and the beginning of the fist step considered for the analyses. lt is carried out by the ipsilateral limb.
HC2 Heel Contact 2: The end of the Approach Phase, the end of the first step and simultaneously the start of the Stopping Phase and the start of the second step. lt is carried out by the contra-lateral limb.
HC3 Heel Contact 3: The end of the second step and the event where walking appears to stop. lt is carried out by the ipsilateral limb.
MIL Medio/lateral: side-to-side movements.
TO Toe-Off: The event at the end of the stance phase at which the toes no longer contact the ground.
Stopping Phase
The last step during which the persan stops visually and biomechanically. lt lasts from HC2 to A/P COM velocity <0.05 m/s.
RÉSUMÉ
Introduction: L'arrêt de la marche requiert des exigences spéciales en
raison d'une transition d'une situation dynamique à une situation quasi-statique. Lors de l'arrêt de la marche, des personnes âgées en santé peuvent présenter des difficultés causées par le déclin physiologique relié au vieillissement normal. Il est possible que ces difficultés soient accentuées chez des personnes âgées ayant une sensibilité réduite au niveau des pieds comme les personnes diabétiques, mais ceci n'est pas connu. Le but de l'étude consiste à analyser des caractéristiques biomécaniques reliés à l'arrêt de la marche chez des personnes jeunes (Jeunes) et âgées en santé (Âgées) et chez des personnes âgées diabétiques de type 2 (Diabétiques) affectées par une neuropathie périphérique.
Méthodologie: Trois groupes de personnes ont participé à l'étude. Chaque groupe est composé de 15 participants âgés entre 20 et 40 ans (Jeunes) et entre 60 et 75 ans (Âgées et Diabétiques). Les Âgées sont appariés selon l'âge, le genre, et l'indice de masse corporelle avec le groupe des Diabétiques. L'expérimentation a consisté à au moins huit essais durant lesquels les participants devaient marcher à une vitesse normale le long du parcours indiqué et s'arrêter devant une ligne marquée au sol. Les variables analysées reliées à
l'arrêt de la marche sont le seuil de sensibilité vibratoire, la vitesse du centre de masse (COM) en direction antéro/postérieure (A/P), les overshoots du centre de pression (COP) et du COM en direction A/P et média/latérale (MIL) et des variables reliées à la force (entre autres: Forces maximales, temps relatif nécessaire pour développer les forces maximales, impulsions). Les deux derniers
pas avant que l'arrêt final a été accompli ont été analysées. Ces deux pas ont été divisés dans une phase d'approche et une phase d'arrêt.
Résultats: Les différences du seuil de sensibilité vibratoire sont significatives entre les trois groupes. La différence entre les Âgées et les Jeunes est la plus petite tandis que les différences entre les Âgées et les Diabétiques et les Jeunes et les Diabétiques sont les mêmes.
La vitesse du COM en direction A/P est significativement différente entre les trois groupes au touche-talon 1 (HC1) et HC2 mais non significative entre les Âgées et les Diabétiques au HC3.
Il n'existe pas de différence entre les Âgées et les Diabétiques dans les
overshoots du COP et du COM en toutes directions. Cependant, les overshoots
de COP et du COM sont significativement différents dans toutes les directions, sauf une, entre les Jeunes et les Âgées et les Jeunes et les Diabétiques. L'exemption est une différence non-significative du COP l'overshoots en direction A/P entre les Âgées et les Jeunes.
Le temps relatif utilisé pour freiner pendant la phase d'approche est similaire entre les Jeunes et les Âgées, mais est significativement plus court chez les Diabétiques. Ces derniers prennent plus de temps relatif pour développer leur force de freinage maximale comparativement aux Âgées et aux Jeunes. Le temps relatif nécessaire pour développer la force de propulsion maximale est similaire dans les trois groupes. Les forces de propulsion maximale et les impulsions correspondantes sont également comparables entre les trois groupes.
Pendant la phase de l'arrêt, le temps relatif utilisé pour développer la force maximale est dépendant de l'âge seulement. Les impulsions sont
significativement différentes entre les Jeunes et les Diabétiques, mais non entre les Jeunes et les Âgées, ni entre les Âgées et les Diabétiques. Par contre, la force maximale de freinage pendant l'appui simple de la phase de l'arrêt est significativement différente entre les groupes, les Diabétiques développant la force la plus faible.
Discussion: L'effet de l'âge sur les variables biomécaniques est bien
démontré car les personnes âgées ont des overshoots jusqu'à deux fois plus longs que les participants jeunes. Par contre, les résultats non significatifs sur les overshoots entre les Âgées et les Diabétiques sont inattendus, car en posture il est bien démontré que les trajectoires du COP et du COM sont plus larges chez les personnes âgées diabétiques que chez les personnes âgées en santé. Le seuil de sensibilité vibratoire ne semble pas avoir un effet sur les overshoots du COP et du COM. Pourtant, les Diabétiques ont marché à une vitesse significativement plus lente que les Âgées indiquant que la neuropathie périphérique a un impact.
Conclusions et recommandations: Les résultats démontrent que, sous les
conditions testées, les Âgées et les Diabétiques ne sont pas différents au niveau des overshoots du COP et du COM. Par contre, au niveau des forces maximales, les Diabétiques ont développé la force la plus faible. De plus, les Diabétiques ont pris le temps relatif le plus long pour développer ces forces maximales comparativement au personnes Jeunes et Âgées. Ce résultat confirme indirectement le temps de réaction élevé chez les personnes âgées diabétiques affectées par une neuropathie périphérique. Durant la phase d'approche, les
Diabétiques ont développé l'impulsion de propulsion la plus élevée et durant la phase d'arrêt par contre l'impulsion de freinage la plus faible.
Suite à ces résultats, des études supplémentaires contrôlant pour la vitesse du COM avant que l'arrêt soit initié et/ou avec des tâches plus spécifiques sont requises pour confirmer les résultats obtenus.
ABSTRACT
Introduction: Terminating gait puts special demands on the body as a
transition occurs from a dynamic to a quasi-static situation. Elderly people can have difficulties in stopping due to age related physiological decline. lt is unknown if these difficulties worsen for elderly people with impaired foot sensitivity such as those with diabetes. The study analysed biomechanical characteristics of gait termination in healthy young (Young), healthy elderly (Elderly) persans, and elderly people with type 2 diabetes (Diabetics) affected by peripheral neuropathy.
Methods: Three groups participated in the study. Each group was composed
of 15 participants between 20 and 40 years of age (Young) and between 60 and 75 years of age (Elderly and Diabetics). ln addition, the Elderly were matched with the Diabetics according to age, gender and body mass index. The experiment consisted of at least eight trials in which the participants were simply asked to walk at a normal pace along the indicated walkway and to stop in front of the marked stop-line. The measured variables related to gait termination are the vibration sensitivity threshold, the A/P (anterior/posterior) COM (Centre of mass) velocities at specific events, the COP (Centre of pressure) and COM overshoots in the A/P and M/l (medio/lateral) directions and force related variables (among others: maximal forces, relative time needed to develop these forces, and impulses). The variables have been analysed for the fast two steps before full stop was reached. These fast two steps were divided into an Approach and a Stopping Phase.
Results: Statistical differences in the vibration sensitivity threshold were found between all three groups. The difference between the Young and the Elderly is smallest, whereas the differences between the Elderly and the Diabetics and between the Diabetics and the Young are the same.
The A/P COM velocity is significantly different at heel contact 1 (HC 1) and HC2 between ail three groups. However, at HC3 it is non-significant only between the Elderly and the Diabetics.
No differences in the analysed COP and COM overshoots in either direction were found between the Elderly and the Diabetics. Only between the Young and the Elderly and the Young and the Diabetics are the COP and the COM overshoots significantly different in all directions, except one. This exception is a non-significant difference in the A/P COP overshoots between the Elderly and the Young.
The relative braking time during the Approach Phase is similar between the Young and the Elderly, but significantly shorter in the Diabetics. The Diabetics take significantly longer to develop their maximal braking force when compared with the Elderly and the Young. The relative time needed to develop maximal propulsion force is similar in all three groups and so are the maximal propelling forces and the corresponding impulses.
During the Stopping Phase, the relative time taken to develop maximal stopping force is dependent on age only. The impulses are significantly different only between the Young and the Diabetics, but not between the Young and the Elderly or the Elderly and the Diabetics. Nevertheless, the maximal stopping force
during single support of the Stopping Phase is significantly different in all three groups, with the Diabetics having the weakest stopping force.
Discussion: The age effect on the COP and COM overshoots is clearly demonstrated, with the elderly persans having overshoots up to twice as long than in the young. However, the non-significant results of the overshoots obtained between the Elderly and the Diabetics is unexpected, as larger postural COP and COM trajectories in persans with diabetes have been reported. The vibration sensitivity threshold seems not to have an effect on the COP and COM overshoots. Yet, the Diabetics walked with a significantly lower velocity than the Elderly indicating that peripheral neuropathy does have an impact.
Conclusions and recommendations: The results demonstrate that under the tested conditions, the COP and COM overshoots do not differ between the Elderly and the Diabetics. However, the Diabetics always exhibited the weakest maximal forces of the three groups. ln addition, the Diabetics took the longest relative time to develop these forces compared with the Young and the Elderly. These results indirectly confirm the increased reaction time present in elderly people affected with diabetes and peripheral neuropathy. During the Approach Phase, the Diabetics developed the highest propulsion impulse. During the Stopping Phase, however, their braking impulses were the weakest.
To confirm these results, further studies controlling the COM velocities prior to gait termination and/or demanding more specific tasks will have to be performed.
1. INTRODUCTION AND RATIONALE
The thesis is introduced with the rationale followed by the literature review chapter. Next, the objectives and the hypothesis of the study are explained before the chapters of the methodology and the results are presented. The results are discussed in chapter six and the thesis terminates with the conclusions and recommendations for future studies.
Gait is a major feature of humans and is a tapie in which researchers have been interested for a long time. lts characteristics are well documented and include gait changes due to normal ageing (e.g. Winter et al., 1990). However, most of the published documents have one characteristic in common. The participants have been analysed during walking at normal cadence. Only a handful of studies have examined gait termination. Terminating gait, as a specific part of the walking process, makes special demands as a transition occurs from a dynamic situation (walking) to a quasi-static situation (standing). Elderly people seem to have difficulties in stopping, as the results of Cao et al. (1997 and 1998) have demonstrated. lt is unknown, however, if these difficulties worsen for elderly people with impaired foot sensitivity such as elderly persans with diabetes.
lt is well documented that industrialised western countries have a rapid ly increasing elderly population. ln 2031, the elderly Canadian population will number over eight million, representing more than 20% of the total population. ln Québec it will be over two million, more than 2.5 times that of 1991 (Gauthier and Duchesne, 1991).
Pathologies are much more likely ta occur with increasing age. Many pathologies such as rheumatism, other types of arthritis and diabetes can cause gait disorders (Horak et al., 1989; Alexander, 1996a). lt is therefore reasonable ta expect that they also influence gait termination. Diabetes mellitus type 2 (referred ta simply as 'diabetes' in the following text) is one of the top six chronic diseases in Canada (Statistics Canada, 1996) in terms of incidence. lt is about eight ta ten times more common than type 1 diabetes (see review by Gaster and Hirsch, 1998). Eleven per cent of elderly Canadians aged 65 ta 7 4 (say 210 000 persans) are affected by diabetes. This proportion is nearly twice that of the 55 ta 64 age group (Statistics Canada, 1996). After the age of 75, only a slight increase in prevalence is noted, compared ta the 65 ta 74 age group. Again, men are more affected than women, but the increase in bath genders is approximately the same (Statistics Canada, 1996).
On a long-term basis, diabetes affects all bodily systems, with neuropathy, nephropathy, retinopathy (all considered micro-vascular changes) and angiopathy (considered a macro-vascular change) as main consequences (WHO, 1985; Sherwin, 1996; Seaquist 1998). Sixty ta seventy per cent of people with diabetes face neurological deficits, particularly peripheral neuropathy (CDC, 1995). Peripheral neuropathy affects lower limbs first and exhibits the following symptoms: a) sensitivity reduction due to demyelisation and degeneration of axons, b) muscle atrophy and c) perturbation of the skin metabolism. ln severe cases, sensitivity is totally lest On the basis of this lack of sensory stimulus, people with diabetes are more dependent on vision than their age-matched counterparts (Courtemanche et al., 1996). Unfortunately, vision is also strongly
affected by diabetic retinopathy. Damaged and leaky capillaries cause the retina to bleed and swell, resulting in blurred vision. Diabetes is the leading cause of blindness in adults (CDC, 1995). Hence, peripheral neuropathy and retinopathy caused by diabetes has a significant affect on gait and posture security (Cavanagh et al., 1992; Boucher et al., 1995).
Stopping one's gait is a very important task and can lead to serious problems if not executed properly. Situations in daily life require the capability to stop in front of unexpected obstacles, for example at the pavement curb or when approaching descending stairs. Little is known about gait termination in elderly people or its characteristics. Gait termination data of elderly people with diabetes are lacking in the literature. The present study provides information on gait termination not only in elderly persans with type 2 diabetes and impaired foot sensitivity but also in healthy young and elderly people not affected by diabetes. The study aims further to identify factors that influence gait termination.
2. LITERATURE REVIEW
ln this section, the development and characteristics of gait are discussed, followed by the age-related changes of the bodily systems considered to influence gait the most. ln the third part, gait termination and related studies are presented. Finally, diabetes mellitus, related pathologies and the resulting impacts on gait are described.
2.1. GAIT
For most of us, walking is so natural that we do not need to think about it. But walking is not an inborn reflex (lnman et al., 1981 ); it has to be learned and developed until the characteristic human gait pattern is achieved. But once learnt, leg muscle activation and movement contrai occur at a sub-conscious level, and walking becomes almost automatic (see review by Dietz, 1992; Horak and Nashner, 1986; Winter, 1991 ). The learning process starts from birth and involves the whole body (Woollacott et al., 1996). First, muscle strength has to develop to enable segmental movements, and later on when upright posture and stance is achieved, to support the body against gr~vity. The nervous system learns, during
maturation, how to co-ordinate the different muscles and segments in order to achieve successful balance and locomotion (Berger et al., 1985; Sutherland et al., 1980; Woollacott et al., 1996). Within the balance and movement contrai, the information the central nervous system obtains from the afferent nerves, plays an important raie. Inputs of afferent nerves are, among others, responsible for the
shaping and the stability of the basic locomotor rhythm and the contrai of limb movements (Martini and Timmons, 1995; Patla, 1996). Together with the efferent pathways, they maintain balance of the moving body and adapt the locomotor pattern to the environment and overall behavioural goals (Gordon, 1991 ).
The variation in the rate of change of the centre of gravity position in each child might be a factor in determining when a child begins independent locomotion (Burnett and Johnson, 1971a). The same authors go on to mention that this factor might also play a role in how rapidly gait develops. The change from an infant to an adult gait pattern typically occurs around 5 to 7 years of age (Berger et al., 1985; see review by Dietz, 1992; lnman etal., 1981). Nevertheless, refinement of locomotor balance contrai continues until at least 1 O years of age (Woollacott et al., 1996). However, Sutherland et al. (1980) report that a mature gait pattern is well established by the age of three, when determined by the following criteria: duration of single limb stance, walking velocity, cadence, step length and the pelvic span/ankle spread ratio. This contrasts with the studies cited above. The definition of 'mature' might cause this confusing situation. Burnett and Johnson (1971b) define 'mature' only in so far as the adult-like walking movement is already present in young children. However, their child participants were between two and four years of age at the end of their study and further tests on these children were not documented.
ln general, normal adult gait is marked by a smooth, alternating movement, characterised by reciprocal leg muscle activation and the typical braking/ propulsion pattern during stance phase (Berger et al., 1985; Perry, 1992; Woollacott et al., 1996). Preferred walking speed requires minimal energy
expenditure and is highly efficient (Hreljac and Martin, 1993; lnman et al., 1981; Leonard and Robertson, 1995; Waters et al., 1988).
The short overview given above demonstrates that walking is a complex task, involving not only the musde-skeletal system but also the nervous and cardiovascular system. ln the following sections, biomechanical features and other characteristics of gait are presented.
2. 1. 1. Gait Characteristics
Gait characteristics can be described qualitatively or quantitatively. The former may be of more use in everyday clinical environment, whereas quantitative measurements are more common in research. Quantitative measurements include biomechanical analyses and their variability, two features which will be presented in the following sections. As these two measurements are not only influenced by a person's everyday behaviour but also by gender, results of studies analysing gender différences will also be presented.
Biomechanical Aspects of Gait
Gait is a cyclic event and is highly repetitive (Sekiya and Nagasaki, 1998; Winter, 1991 ). A cycle or stride in healthy individuals is usually defined as being from one heel contact to the next of the same limb. lt can be described in two different ways: according to its phases or according to its events. Analysed according to its phases, a stride consists of one stance and one swing phases. These phases are generally measured against the whole cycle and last roughly 60% and 40% for stance and swing phase respectively in normal gait (lnman et
al., 1981). The stance and swing phases can also be further subdivided (for details please refer to Perry, 1992). The second way to describe a stride is to subdivide it according to its events: heel contact (HC), foot fiat (FF), heel off (HO), toe off (TO) and mid-swing (MS) (Winter, 1991 ).
The phases and events described above are related to a single limb. Analysing both limbs at once shows another very important phase: double limb support. ln this phase, which occurs twice during a stride, both limbs are in contact with the ground. During double limb support, the weight is transferred from the propelling leg to the new stance leg (lnman et al., 1981; Murray, 1967; Perry, 1992; Winter, 1980). Double limb support distinguishes walking from running, as this phase does not exist in running (Marey, 1873). If gait is symmetrical, the two double limb support phases, each 8-11% of a stride, will be equal in du ration (lnman et al., 1981; Winter, 1991 ).
The trunk and upper extremities are not considered to actively contribute to walking, but help to smooth the trajectory of the body's total centre of mass and are, therefore, essential for an energy efficient gait (lnman et al., 1981; Perry, 1992). lnman et al. (1981) further stated that the rotation of the trunk and shoulder are 180° out of phase with the pelvis. However, the interaction of trunk and pelvis is far more complex. The results of the study of Stokes et al. (1989) showed that these segments are not simply rotating opposite to each other. Rotation about the vertical axis is in phase during double limb support. Rotation around the anterior-posterior axis is in phase during most of the gait cycle. However, during double limb support and at the beginning of single limb support, the shoulder and pelvis are out of phase.
To simplify the complexity of gait analyses, the persan under study is often reduced to a stick figure (Winter, 1990). With kinematic, kinetic and anthropometric data, calculations of net forces and muscle moments acting upon and inside the body are possible using an inverse dynamic approach (Bresler and Frankel, 1950). Hence, an analyses of the cause of the observed moment can be performed (Winter, 1990). The kinematic and anthropometric data allow the calculation of the total centre of mass (COM), a key factor in gait analyses (Benda et al., 1994; lida and Yamamuro, 1987). The COM is the sum of the centre of mass contributions from each body segment. ln an upright persan, it is located about two thirds of the total body height measured from the ground (Winter, 1995) (Figure 1, page 16). Therefore, the human body is not a very stable system. Hence, the COM represents a passive variable, which has ta be controlled by the positions of the centre of pressure (COP) (Winter, 1995). The COP is a single point representing the resultant of all ground reaction vectors acting upon the foot (Winter, 1995) (Figure 1, page 16). Although the COM and the COP are related to each other, they have different trajectories when the COM is projected on the horizontal plane (Maki and Mcllroy, 1996; Murray et al, 1967; Winter et al., 1996). During normal walking, the COP starts its path on the lateral part of the heel, traverses the foot in an approximate diagonal, and ends (toe off) medially at the first toe (Perry, 1992). Viewed over several steps from above, the assembly of the two individual COP trajectories under each foot form a sinusoïdal curve (Winter, 1995). The COM also describes a sinusoïdal curve, with its maximal values alternating to the right and left according to the weight bearing limb (lnman et al., 1981 ). However, in the medio-lateral plane, the COM moves along the medial
Forces ~
..
···\3)-:.~:~~.~::
...
>~.::::-.~···
'~ ' :G. ... . .... ::.::.~.::.::.) Figure 1. Illustration of COP and COM
border of the foot indicating that its amplitude is somewhat smaller than that for the COP (Winter, 1995).
The COM and the COP trajectories cross each other during double limb support, the only event during walking when the COM lies within the base of support (Winter, 1995). Du ring the rest of the cycle, the COM always passes· outside of the supporting base. Hence, only by a safe foot placement of the swinging leg can a fall be avoided (Winter, 1995). Therefore, the ability to regulate the relationship between the COM and COP is essential to prevent the
body from falling. Thus, the interaction between the COM and the COP is of importance as the analyses of the two trajectories give an indication of the body's co-ordination abilities.
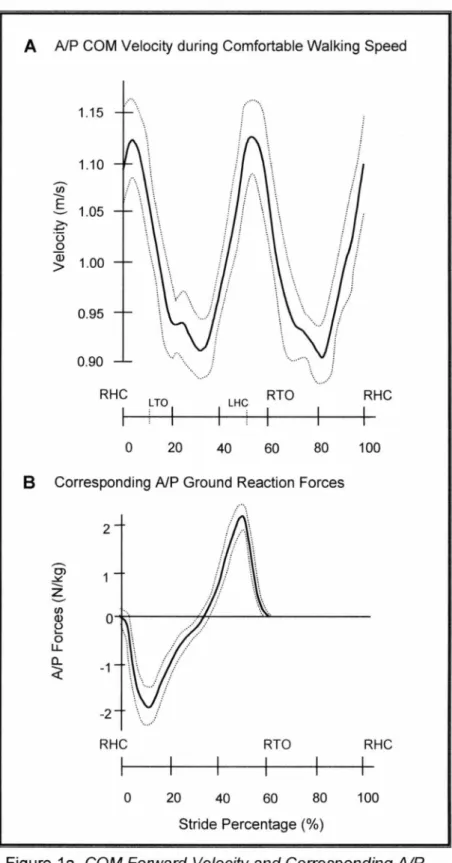
The anterior-posterior movement of the COP during walking is responsible for the typical braking/propulsion pattern of the COM trajectory (Jian et al., 1993; Winter, 1991; Winter, 1995). When analysing force vector patterns in the sagital plane, the same effect can be demonstrated (Perry, 1992; Simonsen et al., 1997). The typical braking/propulsion pattern of the COM trajectory described previously, is similar to the A/P velocity pattern. The A/P COM velocity altemates du ring walking as illustrated in Figure 1 a: A on the following page. For an easier understanding, the right limb serves as a reference in the explanation given throughout the following paragraphs. Due to the repetitive nature of human locomotion, the same explanations also apply for the left limb. Shortly after the right heel strikes the floor (RHC; Figure 1a: A, page 18), the A/P COM velocity reaches its first peak. Thereafter, during the weight-bearing phase until mid-stance, the velocity is gradually reduced due to the braking effect of the right limb. After mid-stance, the right limb starts to propel the body forward. This results in an A/P COM velocity increase. Before right toe-off (RTO; Figure 1a: A, page 18), the heel of the left limb (LHC) hits the ground, braking the A/P COM velocity yet again. This pattern is now repeated by the left limb. The two peaks of the A/P COM velocity curve shown in Figure 1 a: A are therefore typical features of a single stride.
A A/P COM Velocity during Comfortable Walking Speed 1.15 1.10 Cil
E
1.05 ~ ·u 0 a; 1.00 > 0.95 0.90 RHC LTOI LHC RTO RHC 1 0 20 40 60 80 100B Corresponding A/P Ground Reaction Forces
2
-
Cl ~--
z ..., If) (!) 0 (.) ... 0 LL a. -1 ~ -2 RHC RTO RHC 1 0 20 40 60 80 100 Stride Percentage (%)Figure 1 a. COM Forward Ve/ocity and Corresponding AIP Forces (Illustrations according to Winter, 1991)
ln Figure 1 a: 8, the corresponding curve of the A/P ground reaction forces is shown. At comfortable walking speed, the stance phase makes up roughly 60% of a single stride. By definition, the stance phase covers the time a limb spends in contact with the floor. Throughout the remaining 40% of a stride, the limb is swinging. As no contact occurs with the floor, there are no ground reaction forces. ln Figure 1 a: B, the stance phase of the right limb is illustrated. The stance phase lasts from right heel contact (RHC; Figure 1 a: 8, page 18) ta right toe-off (RTO). Analysing the A/P ground reaction forces reveals that a stance phase is composed of a braking and a propelling phase. Ali negative forces of the A/P ground reaction forces are considered to be braking forces; ail positive forces are considered as propelling forces.
Ground reaction force analyses are stated as early as 1873 by Marey. This author described the 'pressure' executed by the foot on the ground and documented it. However, accurate measurements of the ground reaction forces become possible with the development of force plate forms. Since then, they have been well documented (Boccardi et al., 1977; Bresler and Frankel, 1950;
review by Winter et al., 1995) and are a fixed component of biomechanical analyses when force plates for gait examination are used today. ln addition, ground reaction force analyses form the base for more detailed movement investigations such as moment and power analyses.
The area underneath a force-time curve is the total momentum (Hannah and Hilier, 1988). Linear momentum p is defined as mass m times velocity
v
(p=m::v). The change of momentum is called the impulse. ln biomechanics, masses arenormally not changing. Therefore impulses are an indicator of how much the velocity has changed over a given time.
Gait Measurement Variabilitv
Gait related measurements have a low intra-subject variability (Arsenault et al., 1986; Winter, 1984). According to Arsenault et al. (1986), only one stride is needed to achieve reliable results when analysing EMG profiles. Although one stride is also sufficient to depict individual differences, Arsenault et al. recommend a minimal number of three strides to free the results from step to step adaptation effects. Winter (1984) analysed ground reaction forces, joint angle patterns and moment patterns regarding intra- and inter-subject variability. ln all three categories, not only was intra-subject variability low but the inter-subject differences were also small. The largest inter-and intra-subject variability was found in knee and hip moment patterns. These differences had no effect on joint angle patterns, indicating that different moment patterns can result in nearly identical joint angle patterns during stance phase. Winter (1984) also stated that the variability of the moment patterns at the knee and hip decreases with increasing speed. Bohannon (1997), who confirmed that intra-subject variability of gait speed decreases with increased speed, supports these results. The correlation coefficients between trials on individuals were 0.90 for comfortable walking speed and 0.91 for maximum walking speed. Recent results confirm the findings of previous studies. Stolze et al. (1998) measured test-retest reliability of spatio-temporal gait parameters in children and adults. The mean adult correlation coefficient of all the tested variables was high (0.88). Only the
correlation coefficients for velocity (0.77) and swing phase (0.65) were lower. Sekiya and Nagasaki (1998) analyzed the test-retest reliability by means of the walk ratio (step-length/step-rate). The walk ratio was invariant for males at ail speed levels but differed for females at slow speed. The interclass correlation coefficients between the different tests were nevertheless good and ranged between 0.60 ta 0.80.
However, ail the studies mentioned above based their results on sagital plane analyses alone. Kadaba et al. (1989) analysed intra-subject variability in adult gait in ail three planes and combined EMG, kinematic and kinetic data. Furthermore, they analysed the diurnal and daily variability. Again, very good intra-subject repeatability was found in the sagital plane for kinematic data within a day (coefficient of multiple correlation CMC: 0.89) and good results between days (CMC: 0.87). Excellent results were achieved in the frontal and transverse plane for diurnal variability (CMC: 0.94, respectively 0.91 ), but were weaker for daily variability (CMC: 0.88, respectively 0.86). They stated that the weaker result was partly due to the variability in the alignment of the markers. Vertical reaction (CMC: 0.99) and braking and propulsion forces (CMC: 0.99) were more repeatable than were the medio-lateral forces (CMC: 0.95). But the diurnal and the daily repeatability were very high (CMC range from 0.94 to 0.99). Joint moments in the sagital plane were less variable than the moments in the frontal and transverse plan and the diurnal variability was slightly higher than the daily variability. The coefficient of multiple correlation ranged within the same day from 0.90 to 0.99 and between days from 0.81 to 0.98. The repeatability of the EMG-data follows this trend with a slightly lower intra-subject diurnal variability than
daily variability. The CMCs stated above represent means of the different kinematic and kinetic variables Kadaba et al. (1989) have measured. Dujardin et al. (1997) have related the inter-individual variation of hip motion to anatomical characteristics. The inter-subject variability was significantly correlated with height, step length and cadence.
The results presented in the preceding paragraph indicate that gait measurements are highly repeatable.
Gender Differences
Gender differences, walking velocity and anthropometric features have been the tapies of many studies (e.g. Bohannon, 1997; Grieve and Gear, 1966; Waters et al., 1981 ). Slow and fast velocities as well as stride length differed significantly between male and female adults (Waters et al., 1988). ln the same study, females showed a significantly higher cadence under normal and fast conditions, but not under slow conditions. These results support the findings found earlier by Grieve and Gear (1966). However, not all authors have taken stature into account (Waters et al, 1988), and only a few relate leg length as well as step length to total body height (Bohan non, 1997; Yamasaki et al, 1991)
If step length is normalized to body height, the differences between gender diminish, and become only significant at maximal walking speed (Yamasaki et al., 1991 ). These results have been confirmed partly by Bohan non (1997). These results showed that for the ratio of height-normalized, comfortable walking speed, there was a negligible gender difference: 0.82 for men in their 30s and 40s, compared with 0.86 and 0.85 for females in their 30s and 40s respectively. At
maximum walking speed, the differences between the height-normalized ratio in men and women in their 30s decreased further whereas the same ratio increased slightly by 0.09 between genders in their 40s. This disagreement with the results of Yamasaki et al. (1991) might be due to ethnie differences.
The possible influence of leg length on walking speed has been analysed by, among others, Hoffmann (1971) and Webb (1996). Their results showed a clear relationship between maximal running speed and leg length, but not between comfortable walking speed and leg length (Webb). Steudel (1996) supported these results. This last author hypothesised that the increased locomotor efficiency with longer limbs might be balanced by the decreased efficiency of the increased moment of inertia.
Gender differences were aise found when analysing the trajectory of the COM during natural walking (lida and Yamamuro, 1987). These differences were most obvious in the frontal plane. Women exhibited a nearly perfect U-shaped curve, whereas men showed a squeezed figure of eight.
Crowe et al. (1996) summarised the factors that influence individual gait characteristics as follows: circumstantial factors such as footwear, terrain and the size or distribution of a carried load influence gait. Another important factor is mood: people walk differently when exhilarated or mentally depressed (Buchner et al., 1996; lnman et al., 1981). Furthermore, genetically determined factors such as gender, race and stature have an influence on gait as well as acquired factors like histories of previous injuries, training and professional characteristics and age. This latter factor will be discussed in the following chapter.
2.2. AGE-RELA TED CHANGES IN GAIT
Adult gait and its characteristics remain nearly unchanged until the age of 60. Thereafter, walking performance starts to decline (see review by Alexander, 1996b; Bohannon, 1997; see review by Sudarsky, 1990). The ageing process affects all bodily systems and results in their functional decline. ln the following text, only those systems considered to influence gait the most, will be discussed further: the nervous, muscle-skeletal, cardiovascular and visual systems. Finally, this section will terminate with the ageing gait, summarizing the influence of the age-related decline on gait.
2.2.1. The Ageing Nervous System
Age-related changes of the central nervous system (CNS) start after the age of 20 (Strehler, 1976) or 30 years (Martini and Timmons, 1995) and declines gradually thereafter. The most common changes are a reduction in brain size and weight, a reduction in the number of neurones and their synaptic organisation, as well as intra- and intercellular habits, and a decrease in cranial blood flow (Martini and Timmons, 1995). Brain atrophy during normal ageing ranges from 10-15% up to 30% in severely demented patients (Wisniewski and Terry, 1976). The results of Strehler (1976) are in the same range with a 10-20% brain weight loss between the ages of 20 and 90 years. The atrophy is mainly due to individual cell atrophy and cell loss (Martini and Timmons, 1995; Rubina, 1993; Strehler, 1976).
Another feature is the reduction of dendrite branches and synaptic interconnections, causing a decline in neurotransmitter production (Delwaide,
1986; Martini and Timmons, 1995). Furthermore, neurones start to accumulate intra-cellular deposits resulting in plaques and neurofibrillary tangles. Plaques are mainly an accumulation of the fibrillar protein amyloid, surrounded by abnormal dendrites and axons, whereas neurofibrillary tangles are dense mats of neurofibrils (Martini and Timmons, 1995; Wisniewski and Terry, 1976). However, Morrison and Hot (1997) demonstrated that during normal ageing, i.e. non-neuro-pathological changes, neuronal lasses are not likely to be the cause of functional decline.
The peripheral nervous system also undergoes age-related changes. Histologie peripheral nerve changes include axonal degeneration, a decrease in the number and density of nerve fibres with a disproportionate loss of large fibres, and an increase of connective tissues (Dorfman and Besley, 1979). These authors demonstrated that, in general, the conduction velocity (CV) of the peripheral median nerve slows at an approximate rate of 0.15
mis
per year for motor fibres, and 0.16mis
per year for sensory fibres. Welford (1984) supports these results. However, spinal sensory CV is relatively stable from the age of 18 to 60 years, but declines thereafter at a rate of 0.78 mis per year (Dorfman and Besley, 1979). General nerve conduction velocities in the lower limbs range from 40 to 60 mis (Harrison, 1994). Therefore, the age-related changes in peripheral nerves documented by Dorfman and Besley represent a nerve conduction decrease of 0.26 to 0.4%
per year.Thus, the neuronal processing and the conduction of information slows down with increased age, combined with decreased sensory information due to neurone loss (Maki and Mcllroy, 1996; Welford, 1984).
2.2.2. The Aqeinq Muscle-Skeletal System
Age-related changes of the muscle are summarised by Martini and Timmons (1995). ln general, the skeletal muscle fibres become smaller in diameter and loose elasticity. The reduction in diameter is mainly due to a decrease in myofibrils, whereas the increasing stiffness is related to the increase of collagen fibres. Decreased joint moments, forces (Winter et al, 1990) and extensor power (Sassey et al, 1992) reflect these age-related changes in muscle structure.
Gender and ethnie differences have aise been found in elderly populations. ln a large cross-sectional study Gallagher et al. (1997) among other things demonstrated that elderly African-Americans had a higher percentage of appendicular skeletal muscle mass than their Caucasian counterparts. Furthermore, the absolute decrease in appendicular skeletal muscle mass with increasing age was larger in men than in women for bath ethnie groups. Nevertheless, the gender differences persisted but were smaller in magnitude than in the young populations. Age, gender, body height and weight were taken into account when the authors did the comparison between the ethnie groups.
The most important changes in the ageing skeletal system are a reduction in bene mass and a decline in minerai content, resulting in a thinner and hence more fragile bene structure. These reductions start between ages 30 and 40 years and are more prominent in women (8% per decade) than in men (3% per decade) (Martini and Timmons, 1995). This fact may explain the increase of hip fractures among females. The rate of hip fracture among women starts to increase around the age of 40 years and doubles subsequently with each five to six years in an exponential curve (Kellogg International Work Group, 1987). lt
should also be mentioned that hip fractures, although often cited as the most important morbidity and mortality factor, occur in only about 1 to 2% of all falls (Kellogg International Work Group, 1987; King and Tinetti, 1996).
Marcus (1995) pointed out that probably the most important manifestations of age-related bone loss and skeletal fragility result from a fundamental inefficiency in bone remodelling that may progress with age. Nutrient intake and hormones have an influence on bone turnover and are related to skeletal strength.
2.2.3. The Aqeing Cardiovascular System
The major features of the ageing cardiovascular system are a reduction in the maximal cardiac output, an increased inelasticity of the arteries combined with calcification (arteriosclerosis) and a decreased haematocrit (Martini and Timmons, 1995). Furthermore, pooling of blood occurs in the leg veins, as valves do not function as efficiently. Due to these changes, tissue oxygen supply is reduced, a tact which may have the biggest implications for the brain. Thompson (1976) showed that regional cerebral blood flow is correlated with the degree of dementia, painting out that metabolic rate differs between cerebral regions.
2.2.4. The Aqeinq Visual System
Reduced acuity, contrast sensitivity and depth perception, as well as a decline in dark adaptation, are characteristics of the ageing visual system (Caranasos and Israel, 1991; Maki and Mcllroy, 1996), reflecting structural and compositional changes of the eye. Deguine et al. (1997) analysed the ageing effect on the vitreous body. They stated that vitreous body syneresis, which is
most pronounced between 40 and 50 years of age, might be due to chemical reaction initiated by UV radiation and metabolic changes. A synersised vitreous body can lead to detachment of the retina due to voluminal changes (Deguine et al, 1997).
Gao and Hollyfield (1992) quantified the impact of ageing on the retinal cell structure. They demonstrated that cell lasses were dependent on cell type and retinal region. The different ageing effects on the different cell types were remarkable. For example, numbers of rod cells were found to decrease curvilinearly with the largest decline between the age of 40 and 60 years, whereas an observed linear decline of cane cells was not significant between ages 20 and 90. The authors concluded that the differential cell lasses could cause the decline of visual function. However, neuronal processes and loss of neurones in the visual cortex have to be taken into account as well (Gao and Hollyfield, 1992).
Rubin et al. (1994) demonstrated the effect of visual impairment on different disability categories. For example, persans with reduced acuity were 1.36 times more at risk of being restricted in their mobility and up to 2. 70 times while driving a car. They were aise 4.00 times more at risk when exposed to resolution problems such as reading signs or identifying faces while walking. The above mentioned odds ratios were adjusted for age, gender, race and number of chronic medical conditions. These results demonstrated that visual acuity is playing an important raie and should be considered, when analyzing locomotion.
2.2.5. The Ageing Gait
The above mentioned changes of the different systems do not occur in isolation. They are inter-linked and, together with individual characteristics, they contribute to the typical gait pattern of healthy elderly people. This is characterised by a decreased walking speed caused by a reduced push-off (Winter et al., 1990). Judge et al. (1996b) demonstrated that their aider participants were unable to increase plantar flexion power at maximal speed but increased hip flexor power to compensate. A lower push-off results in a shorter step and stride length (Costes-Salon et al., 1996; Elble et al., 1991). The lower push-off is combined with a more flat-footed landing (see review by Alexander, 1996b; Winter et al., 1990). Bath may reflect the reduced joint motion in the elderly (Caranasos and Israel, 1991). However, Alexander (1996b) pointed out that joint motion differences between elderly persans (aged ~70 years) and the
young are generally less than 30% and often less than 10%. Furthermore, it has to kept in mind that full range of motion is not required during normal walking speed.
Cadence decreased significantly in the elderly participants of Costes-Salon et al. (1996) and Waters et al. (1988) when compared with young adults. However, the cadence difference remained non-significant in the group of Winter et al. (1990), whereas in the group of Judge et al. (1996b), aider people showed a faster cadence than the young persans. The results of Costes-Salon et al. and Waters et al. contrast with the results of Judge et al. and Winter et al. This may be due to the fact Judge et al. and Winter et al. were testing fit and active elderly
people compared ta the elderly participants of Costes-Salon et al. and Waters et al.
An additional feature of elderly gait was the increase in stance phase due ta the extension of double limb support (Baumann, 1994; see review by Sudarsky, 1990). This modification may reflect the slower COM transfer from the propelling to the stance leg (Costes-Salon et al., 1996). ln general, elderly people showed an enlarged walking base to improve stabilisation (Vieregge, 1997). Gehlsen and Whaley (1990) evaluated the distance between the heels during walking in two different elderly groups: the contrai group consisted of 30 participants with no history of falls (mean age of 71.3 years) and the test group consisted of 25 participants who had had at least one fall within the ten months before the investigation took place (mean age of 72.4 years). The participants were evaluated on a treadmill at a speed of 4 km/h and 6 km/h. The group with a history of falls showed a significantly larger distance between the heels at bath speeds than the control group. ln bath groups however, the distance between the heels was reduced at higher walking speeds. For the contrai group the width at 4 km/h was 7.19 cm compared to 6.41 cm at high speed. ln the test group the average width range was 7.77 cm and 7.39 cm at the normal and high speed respectively. Kawamura et al. (1991) analysed the stride width in healthy young men during level and slope walking. The average stride width of their participants was 14 cm when walking on the level. This was slightly increased when walking up a 6° slope. lnterestingly, the width decreased when the slope was further increased and was even smaller than for level walking when the participants were walking up a 12° slope. The decrease of walking width with age has been
previously reported. Gabell and Nayak (1984) reported a difference of 2.12 cm between the young (aged 21 to 47 years) and the elderly (aged 66 ta 84 years) during normal level walking. The above-mentioned results contrast with the general consensus that elderly people tend to increase their walking width for safety purposes. However, the increase in the walking width seems to be particularly true for frai!, elderly people, as documented by Gehlsen and Whaley (1990) and Guimaraes and lsaacs (1980).
Ali the above-mentioned changes are also correlated with walking speed. This opens the possibility that observed age-related gait changes are a result of reduced walking velocities rather than direct physiological changes (see review by Alexander, 1996b; Elble et al., 1991 ). Muscle-skeletal, neurological and cardiovascular symptoms are associated with a decreased walking speed (see review by Alexander, 1996b; Judge et al., 1996a). Sudarsky (see review 1990) stated that the gait of elderly people is more strongly influenced by an onset of a disease than by chronological age, a statement which is supported by Horak et al. (see review 1989) and Alexander (1996a). But the transition from normal age-related to pathologically induced changes is not easy ta identify (Dobbs et al., 1993; Maki, 1997; Winter, 1985) as the elderly represent a heterogeneous group (Caranasos and Israel, 1991; see review by Horak et al., 1989, see review by Sudarsky, 1990). Gait disorders in the elderly are common and are mostly due to neurological pathologies such as sensory imbalance, Parkinsonism and myelopathy (see review by Alexander, 1996b; Bopp and Six, 1991; Nutt et al., 1993).
2.3. GAIT TERMINATION
Situations in daily life require the capability of turning and stopping. Terminating gait, as a specific part of the walking process, makes special demands as a transition occurs from a dynamic situation (walking) to a quasi-static situation (standing). As discussed in the previous sections, the ageing process affects all bodily systems and results in their functional decline. Elderly people show difficulties in stopping their gait (Cao et al 1997 and 1998). lt is unknown, however, if the difficuities worsen for elderly people with impaired foot sensitivity such as elderly people with diabetes. Although stopping represents an important event, only a handful of publications consider this part of the locomotor task. ln the following section, the six available gait termination studies are discussed critically. Only one of these studies includes elderly persans and none of them includes elderly persans with diabetes suffering from peripheral neuropathy.
Yamashita and Katoh (1976) analysed, among other variables, the COP trajectories in the anterior/posterior (A/P) and medio/lateral (M/L) directions during steady walking and during starting and stopping. The authors developed a special force plate shaped as a right isosceles triangle. lts base was long enough to measure the vertical ground reaction force during a full stride, i.e. one step for each leg. During the stopping trials the participants walked at natural cadence along an auxiliary walkway and stopped at the end of the force plate with the feet placed in parallel. The authors demonstrated that once the participant has
reached his standing pose, the resultant COP described a M/L movement. Compared with the COP starting trajectory, the MIL movement of the stopping COP trajectory was delayed and more pronounced. The authors related the M/L movement to the positioning of the COM between the two feet. Their results are based on four young men aged between 23 and 34 years (median 25 years).
ln the above mentioned study, the participants were asked to stop with parallel feet. Hence, the same foot positions at the stop were achieved as at the start. The similarity obtained between the two conditions (starting, stopping) could therefore be due to the experimental set-up only. No force analyses in either the A/P or MIL directions could be performed because this special force plate was sensitive to vertical forces only.
Jaeger and Vanitchatchavan (1992) analysed the vertical and horizontal ground reaction forces in ten young persans (mean age 28.7 years) during gait termination under two conditions: 1) stopping as quickly as possible after a sound signal, regardless of foot position, and 2) stopping as quickly as possible after a sound signal but feet placed in parallel. The stopping signal was delivered at different times during the cycle. The authors demonstrated that the main characteristics for stopping were increased braking and decreased propulsion forces during the stance phase prier to gait termination. Furthermore, the time taken to terminate gait was dependent on the signal intervention during the gait cycle. Under the first condition, an increased time was observed when the signal was given 10% before completion of the gait cycle. This increase was due to the required additional step. An additional step was aise required under the second condition of a signal intervention between 15 to 30% before completion of the gait
cycle. ln other words, if their participants were allowed to stop regardless of their foot position, they stopped more quickly because another step was not necessary 90% of the time. As no kinematic data were recorded, the interaction between the COM and the COP trajectories could not be analysed.
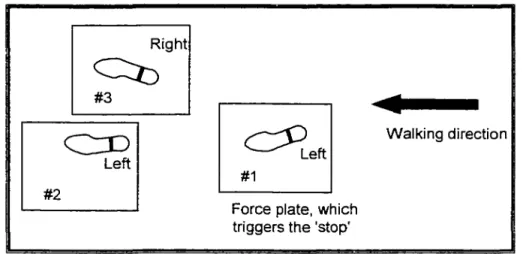
Jian et al. (1993) compared gait termination patterns of the COP and the COM with the COM and COP trajectories during gait initiation in four young men aged between 25 and 31 years. The stop was controlled as the participants were asked to stop on force plates #2 and #3, once the visual stopping signal occurred (Figure 1 b). The visual stopping signal was triggered by heel contact (HC) at force plate #1. Right
~
#3c [)
Left #2~eft
#1Force plate, which triggers the 'stop'
•
Walking direction
Figure 1 b. Experimental set-up of Jian et al. (1993).
The authors divided the stopping time into three phases. Phase 1 was initiated by the left foot, which released the stopping signal and completed with the right heel contact (force plate #3). During this time a 10% reduction in gait velocity was achieved. Phase 2 was the main braking phase (right heel contact and second left heel contact; force plates #3 and #2) with a 73% reduction in gait velocity during this second step. Phase 3 included the fine-tuning of the COM by