COST ACTION F3 “STRUCTURAL DYNAMICS” 1997-2001 PRESENTATION AND SOME PRELIMINARY RESULTS
J-C. GOLINVAL
Université de Liège, LTAS – Vibrations et Identification des Structures, 1 Chemin des Chevreuils, 4000 Liège
Belgium
E-mail: [email protected] P. ARGOUL
Laboratoire Central des Ponts et Chaussées Marne la Vallée 2, Allée Kepler, 77 420 Champs-sur-Marne
France E-mail: [email protected]
The COST Action F3 “Structural Dynamics” was initiated in 1997 by Professor Jean-Claude Golinval. The main objective of this COST Action is to increase the knowledge required for improving the structural design, the mechanical reliability, and the safety of structures in linear and non-linear dynamics. This research Action is supported by the European Community and is divided into three working groups dealing with the following issues: WG1: “Finite Element Model Updating Methods”; WG2: “Health Monitoring and Damage Detection”; and WG3: “Identification of Non-linear Systems”. This paper presents the objectives of the COST Action F3, the organization of the Action, the members of the management committee, and the scientific program of each working group in more detail. Finally, preliminary results of the COST Action are presented.
1 Introduction
The COST (Co-operation in the field of Scientific and Technical Research) Action “F3” Structural Dynamics was initiated in 1997 by Jean-Claude Golinval, Professor at the University of Liège in Belgium. Supported by the European Community., this research Action started on the 25th of June, 1997, and will end the 24th of June, 2001. Its purpose was to develop in Europe collaboration, to intensify and to coordinate research in the fields of structural testing, dynamic analysis, and model updating. The idea was to allow European research institutions working on similar problems in parallel to exchange information with others and let them be aware of similar research programs. The COST framework seemed to be an efficient and simple way of gathering a database and diffusing information among many European partners. At the very beginning of the Action, the 25th of June, 1997, six European countries (Belgium, Denmark, Italy, Netherlands, Portugal, and United Kingdom) signed the Memorendum of Understanding (MoU). The last six months of 1997 were devoted to the definition of coherent objectives between different
partners. On the 26th of June, 1998, seven more European countries (Austria, Finland, France, Germany, Greece, Spain, and Switzerland) signed the MoU; thus thirteen signatory countries in total. Jean-Claude Golinval was elected the chairperson and Michael Link, Professor at the University of Kassel, the vice-chairperson.
This paper is divided into two parts. The first one is devoted to a brief presentation of the COST Action F3 including the objectives and organization. The second part deals with the scientific program of the three working groups with the description of the benchmarks, the short term scientific missions and the preliminary results.
2 Presentation of the COST Action F3
2.1 Objectives
Regarding the increasing complexity of mechanical structures due to the increasing demands on safety, load-carrying capacity, weight reduction, construction or equipment performance and service life, the mathematical and numerical models used for computer simulations become increasingly important. Despite the high level of sophistication of today’s computational tools in structural analysis, the analytical and numerical results often reveal considerable discrepancies when compared with the experimental ones. For example, whenever non-linearities (e.g. damping effects that are not decoupled by the modal basis of the undamped equivalent system) are suspected, traditional modal analysis techniques collapse because their underlying mathematics are restricted essentially to the linear domain.
Structural dynamic test data is therefore used for correlating with analytical predictions and for updating the analytical models when the deviations are not acceptable. The problem is then of test-analysis reconciliation (model updating, health monitoring, etc.) that depends upon the type of structure and the type of structural modification involved. In various situations, a local identification of the dynamics of a component may be extracted from the modal test of the structure. Therefore, the problem becomes that of “modal subtracting” the behavior of the studied components from that of the whole system. A few attempts in this direction have been developed but a thorough investigation has not yet been proposed. This problem has numerous industrial applications; for example, the inspection of bolted joints in metallic structures as well as the control of joints in pipe networks. In other cases, for instance, when structural changes originate from localized damage, the problem must be investigated from a non-linear point of view. For example, untightening of bolted joints may determine particular vibrational patterns of the type “vibration with contact,’’ due to joint free play.
The objective of this COST Action is to develop and validate procedures to allow engineers to enhance structural safety, maintainability and performance using vibration measurements, structural modeling and data processing algorithms. The key concept involves utilizing changes in the “vibration signature” to locate and estimate the extent of damage and/or model errors. Although the problems of model correlation, damage detection and non-linearities identification require different mathematical solutions, they all draw heavily on System Identification (SI) methodology. This methodology seeks to determine the best fit mathematical model directly from experimental data.
2.2 Organization of the COST Action
The COST Action is managed by a management committee (MC) consisting of a chairperson, a vice-chairperson, plus two representatives of each of the thirteen signatory countries. Its goal is to implement, to supervise and co-ordinate the COST Action. Scheduled to meet once or twice per year, there have been six meetings of the MC to date. This research Action is divided into three working groups dealing with the following issues: (WG1) Finite Element Model Updating Methods; (WG2) Health Monitoring and Damage Detection; and (WG3) Identification of Non-linear Systems. The co-ordinators are, respectively, Dr. M. Friswell and Prof. M. Link for WG1, Prof. M. Link and Dr. K. Worden for WG2, and Dr. P. Argoul and Dr. F. Thouverez for WG3. One main idea for the three working groups is to work on common benchmarks in order to compare results and methods.
One (or two) workshop/conference(s) is(are) organized each year in the framework of the COST Action F3. The past conferences were:
1. International Seminar on Modal Analysis (ISMA 23) at the Katholieke Universiteit Leuven (Belgium) on 10-12th September, 1998 (cf.
www.mech.kuleuven.ac.be/pma/events/isma/isma23conf/isma23.html); 2. Identification in Engineering Systems at the University of Swansea (Wales) on
29th-31th March, 1999 (cf. www.swan.ac.uk/mecheng/ies99);
3. European COST F3 Conference on System Identification & Structural Health
Monitoring at Universidad Politecnica de Madrid (Spain) on 6th-9th June,
2000 (cf. www.dmpa.upm.es/SHM ) . The two conferences to come are:
1. International Seminar on Modal Analysis (ISMA 25) at the Katholieke Universiteit Leuven (Belgium) on 13-15th September, 2000 (cf.
www.mech.kuleuven.ac.be/pma/events/isma/isma25conf/isma25conf.html); 2. International Conference on Structural System Identification at the University
of Kassel (Germany) on 5-7 September, 2001 that will be the final conference. Several Short-Term Scientific Missions (STSM) have been made since the beginning of the COST Action. The aim of a STSM is to contribute to the realization of the scientific objectives of a COST Action. These missions will strengthen the existing networks by allowing scientists to go to a laboratory in
another COST country to learn a new technique or to make measurements using instruments and/or methods not available in their own laboratory. During the period 1998-1999, ten scientific missions were made covering the subjects dealt within the WG’s. They are briefly described in the following part.
3 Scientific program of the COST Action F3
The program of each working group is first briefly recalled. To focus even more on the participants’ common interests, several benchmarks (Bm) have been defined within each WG, thereby allowing them to compare their different scientific approaches. The data of nine benchmarks are now available, one for WG1 called Bm11, four for WG2 called, respectively, Bm21, Bm22, Bm23, Bm24 and also four for WG3 that are called, respectively, Bm31, Bm32, Bm33, Bm34. For each working group, the benchmarks are described below (for more details see the web-site of the COST F3 Action: www.ulg.ac.be/ltas-vis/costf3/costf3.html ). Moreover, it appears that one or two benchmarks have been studied more intensively by two or more participants from two different countries. Thus, these Bms will be presented in more detail in the following. For WG1, this is Bm11; for WG2 these are Bm21, and Bm22; and for WG3, these are Bm 32, and Bm 33.
For the other benchmarks, the following remarks are given:
• Bm23 is the Z24 Swiss concrete bridge (SIMCES project). The bridge was tested under artificial production of progressive damage due to traffic excitation. Three data sets are available: a) undamaged, b) damaged by a 95 mm pier settlement, c) damaged by concrete spalling. Since the original traffic excitation data sets measured and made available by the EMPA in Switzerland, are extremely large, Prof. R. Brincker from Aalborg University has volunteered to provide a smaller subset of the data as to facilitate the process.
• Bm24 is a small building model with two decks and four columns (similar to the JRC-Ispra lab case, but with quadratic plates). The loading is in random (unknown) pulses, so it is close to real ambient loading. With three
measurements on each deck, one can find the movements of the plates assuming rigid body motions, and time series with 10000 data points in each. The modeling is very simple, so that additional experiments can easily be performed, and the amount of data is rather limited. Three cases are provided : a) undamaged, b) damaged by one localized stiffness reduction, c) introduction of an additional mass. Some additional tests may also be performed by Prof. R. Brincker.
• The layout for Bm31 consists of a steel beam hinged at the end with two masses. This model is intended to reproduce the vertical motion of a beam subjected to vertical acceleration at the ends (for example, a bridge deck subjected to the vertical component of an earthquake).
• The layout for Bm34 is composed of three linear plates representing the base, the wing, and the aileron. The non-linear junction element connecting the wing and the aileron is made of two Paulstra flexible coupling rubbers that are working mainly in torsion stress.
Finally, some preliminary results are presented (the list is not exhaustive, for more detail see the proceedings of the past COST conferences previously mentioned).
3.1 Working Group 1 “Finite Element Model Updating Methods”
3.1.1 Program
The main feature of the program of WG1 is to complete a study on generating a validated finite element model using computational model updating.
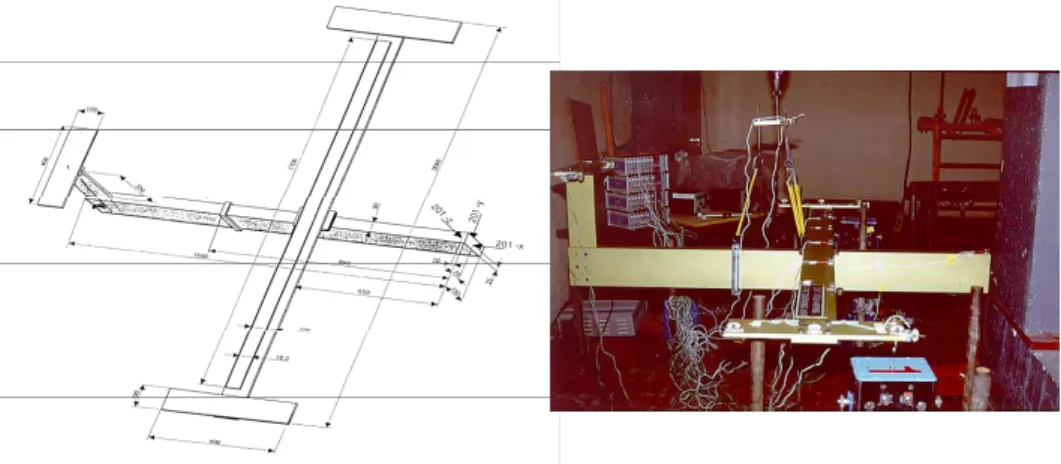
Figure 1. Benchmark 11 : “The GARTEUR SM-AG 19 structure”.
3.1.2 Description of the benchmarks
Two benchmarks have been defined; Bm11: “The GARTEUR SM-AG 19 structure” (and Bm12: “The NASA 8-bay truss”, whose data are not yet available).
Benchmark WG1 Bm11 – GARTEUR SM-AG 19 structure.
The structure shown in figure 1 was built previously for a benchmark study on experimental modal analysis conducted by the Garteur group. It schematically simulates the dynamic behavior of a glider structure. Experimental frequency response functions and modal data were made available from previous studies by
DLR (German Aerospace Establishment) and by the University of Manchester (Aerospace Engineering Division). The test structure shown is described in detail in the report of ref. [6], including the geometry, the material data and the measurement plan. Refs. [2]-[7] describe the experimental benchmark results whereas ref. [3] provides the starting point for the model validation benchmark.
3.1.3 Preliminary results
Several research groups from Belgium, France, Germany and United Kingdom are currently working on the benchmark Bm11. They have meshed the GARTEUR structure with their own finite element model using either beam or shell elements. The modal data proposed by DLR is used to correct these FE models using different updating procedures and the results will be published in the near future.
3.2 Working group 2 “Health Monitoring and Damage Detection”
3.2.1 Program
The main feature of the program of WG2 is to assess the damage localization and the level of damage inside the structure by using a mathematical model.
3.2.2 Description of the benchmarks
Four benchmarks have been kept; Bm21: “KULeuven’s beam structure” proposed by Ing. B. Peeters from Belgium; Bm22 : “Steel frame structure” proposed by Dr. J. Molina and tested at JRC-Ispra in Italy; Bm23: “SIMCES concrete bridge case: the Z24 Swiss bridge” tested at EMPA in Switzerland; Bm24: “Two deck laboratory building model” proposed by Prof. R. Brincker from Germany.
Benchmark WG2 Bm21 - KULeuven’s beam structure
The beam is 6 m long with a rectangular cross section (250 x 200 mm2) (cf. Fig. 2). It is somewhat unusual for a reinforced concrete (RC) beam that the height is smaller than the width; this is done so the eigenfrequencies are not too high. There are six 16 mm diameter reinforcement bars, equally distributed over the tension and compression side, corresponding to a reinforcement ratio of about 1.4%. Shear reinforcement consists of 8mm diameter vertical stirrups every 200 mm (cf. Fig. 2). It is known that the static Young’s modulus of concrete differs from the dynamic one. The first longitudinal eigenfrequency of a cylinder (h = 300 mm, N = 150 mm) made of the same concrete and at the same time as the beam was measured to determine the dynamic modulus (Edyn = 35 000 MPa). A total beam mass of m = 750 kg results in a density of the reinforced concrete of ρ = 2500 kg/m3
Figure 2. Benchmark 21 : “The KULeuven’s beam structure”.
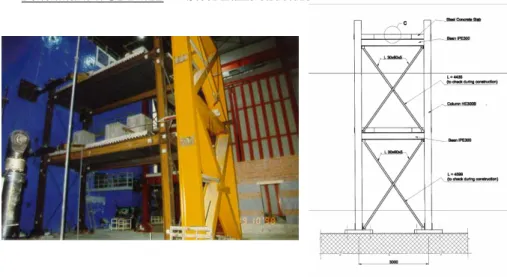
Benchmark WG2 Bm22 - “Steel frame structure”
Figure 3. Benchmark 22 : “The steel frame structure”.
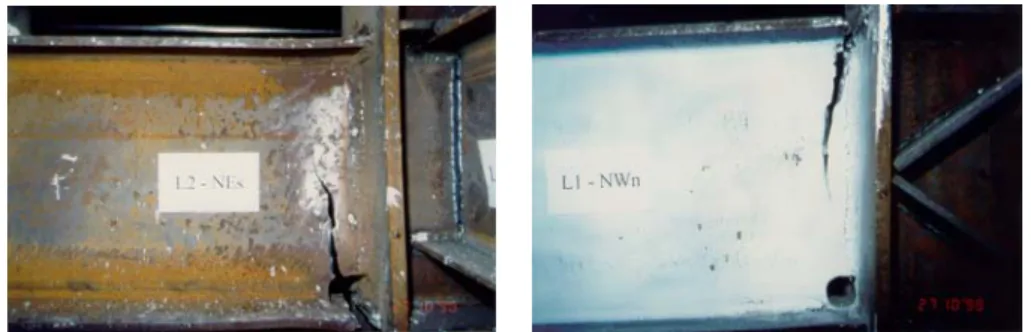
The structure is a two-story frame of main dimensions 8m x 3m x 9m as depicted in Fig. 3. Each story is made up of corrugated sheets supporting a concrete slab and are connected by welded vertical and horizontal steel girders. The columns consist of HE300B, the storeys of IPE400 on the long side and IPE300 on the short side. Bracings are made of L60x30x5 profiles. The structure was tested pseudo-dynamically and cyclically along its longitudinal direction by means of two 500kN displacement-controlled hydraulic actuators at each floor. At the end of this
damaging test, major cracks appeared at some of the beam-column joints (cf. Fig. 4).
Figure 4. Cracks
3.2.3 Preliminary results
Generally, the damage identification procedure is carried out in the following three main steps : (1) updating of the initial finite element model by means of the measurement data of the undamaged structure in order to obtain a reliable reference model; (2) damage localization from the changes in the measured dynamic behavior, including parameter selection and (3) calculation of the extent of damage. Some preliminary results are presented below for benchmark Bm23, the Z24 Bridge in Switzerland and for benchmark Bm22, the steel frame structure.
The goal for the benchmark Bm23 was to be able to detect the precise time and type of damage by performing forced and ambient vibration tests on the bridge. The data was then processed in order to detect the damage done to the bridge. Since the excitation of the bridge was not known (it was due to wind, traffic, etc.), the use of the stochastic subspace technique for determining the model order from only the output data was proposed (cf. [13]). This technique was based on the discrete time state-space formulation. During ambient testing, the process noise vector is the only excitation. The system identification therefore consists of the estimation of the system and the output matrices from measurements by using robust numerical techniques such as QR factorization, singular value decomposition and least-squares. Once these matrices are found, one can then find the modal parameters easily. In [13], the stabilization diagram was used to select the optimal model order. This was done by determining the stabilization of the model, which was calculated to be the weighted sum of the stabilization degree of poles in the model, giving a higher weight to poles that had more stable modal parameters. The stability of the poles were, in turn, determined by a set of criteria: 1% deviation for frequency, 10% for damping ratio and 5% for natural mode.
Damage detection was done by comparing the model of the bridge at any given time to the models at previous times. Since this detection depends upon prior
knowledge, it was necessary to collect some initial data, during a period where it is known that there is no damage to the structure, from which to base the comparisons. The final detection process was only somewhat automatic, for a human was needed to visually view the results and look for deviations in the modal parameters. It was found that the best signal of damage was the instability of frequency and mode shape; the damping ratio was found to be an unuseful indicator of damage due to its great variability. In addition, not all modes were ideal for detection; (modes 2 and 5 for the pier settlement of 40 mm were too scattered to be reliable, for example). It was thus found that one could detect the precise time of damage to model structure using a modal analysis followed by a visual inspection of the data. Moreover, one parameter not considered in this study was the effect of temperature on the modal parameters. Although many studies can show that temperature variation may cause a higher variation in natural frequencies that structural damage, it was assumed that all of the difference in modal parameters was due to damages in structure. This is a subject of future investigation.
For the benchmark Bm22, an attempt to identify the location and extent of damage to the steel frame induced by seismic loads is discussed in [9]. First, an FE program was used to make a numerical model of the frame before any damage was done. The mean of the MAC values, which indicates the mode shape deviation, was 99.24% (3rd torsion mode not included). The eigenfrequency deviations, however, were quite high (average around 8.41 Hz, again not including 3rd torsion mode). In order to improve on this result, an extended least-squares technique was done that minimized an objective function that contained the differences in the eigenfrequencies and mode shapes. The result was a great decrease in eigenfrequency deviation, down to 0.04 Hz (not including the 3rd torsion mode). In order to investigate modeling damage done to the structure, a set of 63 parameters that were assumed to cover all possible damage cases, was chosen. After investigating the sensitivities of the modal data to changes in these parameters, a subset of the most important parameters was taken. The physical structure was then damaged, and data was recorded as to how these parameters changed. In order to see if the location of the damage could be predicted, the same perturbation in the parameters was made in the undamaged model. Stiffness reductions of about 90% were predicted by the numerical model in the three locations of cracks in the physical model. These results were not satisfactory, however, for the solution oscillated. One possible reason for this was that too many parameters were used, resulting in a complex calculation that did not lead to accurate results. The number of parameters was therefore reduced, resulting in a reduction in the average eigenfrequency error and MAC value to 0.57% and 93.4%, respectively. It should be noted, however, that a small deviation in regularization parameters leads to other results. Thus, it seems that the identified parameters and the models used can relatively accurately predict the location and extent of the damage done to the physical structure in question. Further investigation needs to be done with more
sensors and modes so that the number of local minima that appear when searching for the parameter values decreases.
C-P. Fritzen et al. [8] have developed with MATLAB-Toolbox “Mafem”, a 1476 DOF finite element model of the Bm22 structure, consisting in 104 four-node shell and 172 two-nodes beam elements. A model updating was performed minimizing the objective function considering the MAC-values and the eigen frequencies of the first ten modes. The unknown parameters vector is made of the Young’s moduli and the shear moduli of both steel and concrete, as well as the bracing’s moment of inertia and the stiffnesses of the grounded springs. An inverse sensitivity problem with parameter subset selection is formulated for the damage detection, localization and quantification. The equations predicted four cracks, however during the experiment only 3 of these actually occurred. To improve the results, the number of sensors must be increased and they must be placed in more optimal locations.
ARMAV models technique for system identification and damage detection has been applied to benchmark Bm22 in [5]. A procedure based on multi-layer perceptrons is also proposed in [21] to assess the damage in Bm22.
3.3 Working group 3 “Identification of Non-linear Systems”
3.3.1 Program
Researchers in structural dynamics have long recognized the importance of diagnosing and modeling non-linearity. The last twenty years have witnessed a shift in emphasis from SDOF to MDOF nonlinear structural dynamics (cf. [20]).
The main feature of the program of WG3 is to work on a benchmark test based on two linear sub-structures connected by a localized non-linear component in order to compare different non-linear identification procedures on the same data.
3.3.2 Description of the benchmarks
Four benchmarks have been kept; Bm31: "Two-degree-of-freedom non linear system for seismic applications" proposed by Prof. O. Bursi from Italy; Bm32: “Flexible mounts” proposed by Dr. J. Linjama and Dr. M. Juntunen from Finland; Bm33: “Beam with a non-linear (NL) component” proposed by Dr. F. Thouverez from France; and Bm34: “Structural scale model of a wing and an aileron” proposed by Dr. Ph. Fargette from France. Bm32 and Bm34 concern isolated non-linearities where the test is carried out on the single non-linear component. Bm31 and Bm33 relate to a global non-linear behavior where linear sub-structures are connected by non-linearities.
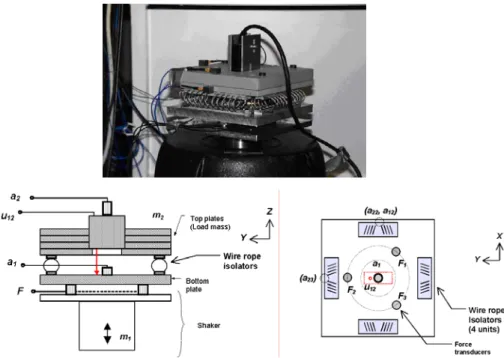
Benchmark WG3 Bm32 : “Flexible mounts”
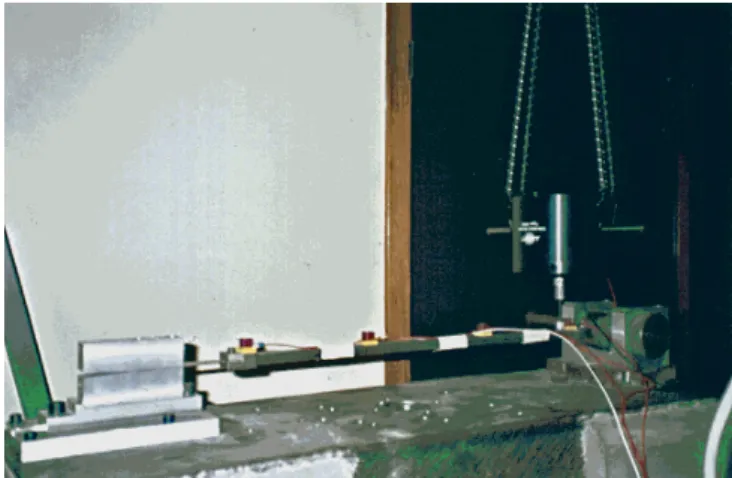
The purpose of this test is to have a standard experimental procedure that gives practical information of the dynamic properties of resilient mounts (mounts, visco-elastic materials, etc.). The tested mounts are helical wire rope isolators. The system is made of the non-linear element between two masses (cf. figure 5) and is excited by an electrodynamic shaker. The bottom mass is driven by the shaker while the top mass is left free. The accelerations of the top and bottom masses were then measured to determine the acceleration transmissibility defined as the frequency response function between the measured acceleration of the two masses (cf. [14]). From this, conclusions about the non-linearity of the element in question have been made in [10].
Figure 5. Benchmark 32 : “The flexible mounts”.
It was found that as the excitation level increases, the dynamic stiffness (related to the acceleration transmissibility decreases and the loss factor (related to the energy lost in the system) increases. In addition, it was noted that the accuracy of the results decreased as the frequency of the excitations increased. Since the results
were relatively accurate, it was concluded that the described setup was a good starting point from which one could examine the non-linearities of various test objects.
Benchmark WG3 Bm33 : “Beam with a non-linear component”
The goal of this test is to analyze the efficiency of nonlinear identification methods on a simple case. This experimentation involves a clamped beam with a local non-linearity on its extremity.
Figure 6. Benchmark 33 : “ The beam structure with a non-linear component ”.
Figure 7. Benchmark 33 : “ NL components of the Benchmark 33”.
A thin beam, excited in large deflection, realizes the nonlinear component. The beam is composed of three parts (Part A: main beam, Part B: junction element & Part C: NL component) the characteristics of which are given in Table 1. The structure has been excited harmonically near the right clamping using five different excitation force levels (2, 3, 5, 9 and 11 N). Four acceleration pick-ups had been
used to measure the response. A frequency range between 8 and 500 Hz has been measured and three resonances can be found around 25 Hz, 135 Hz and 400 Hz.
Table 1. Caption for Table.
Material Length Thickness Width
Part A steel 593mm 14mm 14mm
Part B steel 40mm 20mm 30mm
Part C steel 57mm 0.5mm 30mm
3.3.3 Preliminary results
Some non-linear identification procedures have been tested within the framework of WG3.
One of the “classical” methods for the analysis of the frequency response distortions is the harmonic balance. The equation of motion is linearized following the basic idea of the harmonic balance method (the approximated response to a harmonic excitation is assumed to be harmonic with the fundamental angular acceleration). In [17], the studied nonlinear terms are local cubic springs and cubic dampers. In order to determine the mechanical non linear parameters, a weighted least squares minimization was done on an objective function that included the difference between the experimental and theoretical data. Three different residuals were used in this minimization: the difference in the real portion, in the imaginary portion and in the magnitude of the displacement response. This method was then tested on a simulated 5 degree-of-freedom system with five masses connected to each other and ground through non-linear springs and dampers. The values of the parameters were identified exactly using the algorithm described. However, the results were not as good when applied to the data of benchmark Bm33. Although a good model of the shape of the displacement amplitude versus frequency was calculated, the characteristic jump frequency (where the displacement amplitude suddenly decreases) could not be modeled well. Due to the non-linearity in the system, the value of the parameters varies with each data set, making it therefore unreliable. Thus, the proposed algorithm was found to be reasonable in describing the non-linear properties of a structure in the frequency domain. More research needs to be done, however, in more accurately modeling non-linearities so that practical applications are better modeled by the algorithm.
A recent development which shows promise for the analysis of MDOF systems is the “reverse path” class of algorithms, which are frequency-domain identification algorithms for a wide class of parametric models. The originator of the approach was Bendat, specifically for SDOF systems [4], then Rice and Fitzpatrick [19]. The idea is that, given a system with localized non-linear springs and dampers, one can separate the non-linear terms from the linear ones in order to make an accurate model. In the motion equations, the non-linear terms are assumed to be separated
from the linear ones in the form of non-linear vectors that have a coefficient matrix. The limitation of this model is that the type and locations of the non-linearities must be known in order to solve for the coefficient matrix. It should be noted, however, that this is a common problem for many of the currently known identification procedures of non-linear systems. The reverse path method allows to estimate the coefficient matrix. This is done by taking the Fourier transform of the motion equations, thereby separating the force excitation vector into components due to the linear effects of the displacement vector and the non-linear effects present in the nonlinear vectors. The next step is to write the relationships between the power spectral densities of the displacements, forces, and non-linear vectors, in which appear several terms: (1) the cross spectral density matrices between the force vector and the displacement vector, and between the force vector and the non-linear vectors; (2) the matrix containing all of the possible cross spectral density matrices between the displacement vector and all the nonlinear vectors; and (3) a row vector containing the unknown coefficients.
This method requires that excitations be applied at every response location, which is not practical in real experiments for two reasons. First, real experiments often have a fewer number of excitations as response locations. Second, the non-linearities in the system are sometimes away from the locations of applied excitation. In either case, the reverse path method fails. These problems are overcome with the
conditioned reverse path method (CRP). A hierarchy of uncorrelated frequency
domain response components is constructed and then run through a series of matrix calculations involving their cross spectral density matrices similar in form but not in detail to the RP method. The ultimate goal is to separate the part of the response uncorrelated from the force from that part that is correlated, and to discover the linear relationship in the correlated portion. This solves both problems mentioned above. The CRP method was then tested on benchmark Bm32 (cf. [16]). The Fourier transform of the acceleration, instead of the displacement, is used. Error due to numerical integration is thus not introduced; an advantage of the CRP method which allows the use of accelerations instead of displacements. It was found that the CRP method produced a very stable peak frequency of around 108 Hz for the studied system, while the linear estimation had a left shift of about 26 Hz. The CRP method seems to be relatively good at detecting and quantifying non-linearities in multi-degree-of-freedom systems. Further research must be done to make the calculation more robust and to reduce analyst interaction.
The Proper Orthogonal Decomposition (POD) is a method used to reduce the complexity of a model by selecting only a few functions that can be used to accurately represent the entire system. This is done by finding the coherent structures in the experimental data, which are merely those functions that contain the maximum possible energy content of the measured signal. These coherent structures would therefore maximize the ratio of the square of the inner product between themselves and the time-varying portion of the given data set and the inner product of the function with itself. This is because each coherent structure would
capture as much of the energy in the signal as possible. The coherent structures are therefore determined by solving the eigenvalue problem that directly comes from this property. A physical interpretation of the proper orthogonal modes (POM) is given in [11] using the singular value decomposition. It is shown that the Proper Orthogonal Modes (POM; the modes determined by the SVD) converge under certain conditions to the normal modes of the system as the number of samples goes to infinity. A physical model was studied using the above POD algorithm. Experiments with a clamped beam connected to a nonlinear spring at one end were performed. The errors computed with first POM and then with normal modes taken as basis functions were compared. It was found that the error associated with the POM was always lower than that with the normal modes. Thus, it was found that the POD algorithm is an effective way of reducing the model size when studying nonlinear systems. Further study must be done in order to determine better reduction algorithms for damped systems.
During the STSM, two other techniques were studied and compared : the restoring
force surface technique and the identification technique using the wavelet transform (cf. [1]) in order to process the free oscillations of mechanical nonlinear
systems.
3.4 Short Term Scientific Missions
Within WG1, three missions: (1) K. Bohle from Siegen, Germany to Liege, Belgium and (2) R. Pascual Jimenez from Liege, Belgium, to Ispra, Italy. Their aim was to compare and to apply computational procedures for updating respectively the benchmarks Bm11 and Bm22 presented below. During the mission of R. Pascual, the tests on the undamaged structure were performed, and the extracted model data were compared to the finite element model results. It consisted of preliminary work to identify the location and the magnitude of the damage.
(3) D. Simon from Liege, Belgium to Lyon, France studied during his mission the
use of high resolution optical field measurements for damage location and model updating.
Within WG2, two missions : (4) S. Diaz-Carrillo from Madrid, Spain to Swansea, UK spent his mission in developing a special finite element which analyzes the effects of a composite patch repair that was applied to a concrete beam. The analytical results have been compared to the existing experimental ones. (5) J.L. Zapico (from Gijon, Spain, to Sheffield, UK) learned the neural networks techniques used at the University of Sheffield for damage detection and identification in order to design a compact procedure to detect damage of the benchmark Bm22.
Within WG3, five missions were made. The mission of (6) O. Bursi from Trento, Italy to Champs, France was devoted to improve modeling and identification techniques for damage assessment and prediction in particular to the establishment
of a continuous hysteretic non-linear model. The application under study is the assembly of metallic or composite beams under pseudo-dynamic testing. The mission of (7) S. Marchesiello from Turino, Italy to Manchester, UK was aimed at identifying the parameters representing the non-linear effects (local or distributed) of systems submitted to known excitations by means of “Reverse Path” method. This technique allows to estimate the frequency response functions. During his mission, (8) G. Kerschen from Liege, Belgium to Sheffield, UK exchanged information on the restoring force surface technique used in Liege and in Sheffield. The identification technique was applied to the case of an experimental beam with and without clearance that allowed him to draw conclusions about the accuracy and efficiency of the technique. (9) F. Conti from Rome, Italy, to Champs, France worked on the processing of free vibrations of nonlinear dissipative systems by means of the wavelet transform. From the wavelet transform, the amplitude and the instantaneous frequency of each component of the signal are extracted and the parameters governing the non-linear behavior can be then estimated. (10) The mission of V. Lenaerts from Liege, Belgium, to Turino, Italy was aimed at comparing two different identification techniques: the wavelet transform technique used by F. Conti and the restoring force technique used by G. Kerschen. These techniques were applied to an experimental set-up; the results were compared and some conclusions about their efficiency were made.
4 Acknowledgements
The authors would like to thank Mr. Afsheen Afshar and Mr. Jim McQuade of Princeton University for their significant help with the preparation and translation of this paper.
References
1. Argoul, P., Hans, S., Conti, F., and Boutin, C., Time-frequency analysis of free oscillations of mechanical structures. Application to the identification of the mechanical behavior of buildings under shocks, European COST F3
Conference on System Identification & Structural Health Monitoring, (ETSI
Aeronauticos, Madrid, June 2000), pp. 283-292.
2. Balmes, E., Garteur Group on Ground Vibration Testing Results from the Tests of a Single Structure by 12 Laboratories in Europe, IMAC (1997). 3. Balmes, E., Predicted Variability and Differences between Tests of a Single
Structure, IMAC (1998).
4. Bendat, J.S., Nonlinear Systems Techniques and Applications, (Wiley-Interscience, 1998).
5. Bodeux, J.B. and Golinval, J.C., Armav model technique for system identification and damage detection, European COST F3 Conference on System
Identification & Structural Health Monitoring, (ETSI Aeronauticos, Madrid,
June 2000), pp. 303-312.
6. Degener, M. and Hermes, M., Ground Vibration Test and Finite Element Analysis of the GARTEUR SM-AG19 Testbed, Deutsche Forschungsanstalt für Luft-und Raumfahrt e.V. Institut für Aeroelastik (23200), (October 1996). 7. Degener, M., Ground Vibration Results from the tests of an Aircraft Model
Performed as Part of an European Round Robin Exercise, CEAS International
Forum on Aeroelasticity and Structural Dynamics, Rome, (1997).
8. Fritzen, C.P., Bohle, K., and Stepping., A., Damage detection in structures with multiple cracks using computational models, European COST F3 Conference
on System Identification & Structural Health Monitoring, (ETSI Aeronauticos,
Madrid, June 2000), pp. 191-200.
9. Görl, E., and Link, M., Identification of damage parameters of a full scale steel structure damaged by seismic loading, European COST F3 Conference on
System Identification & Structural Health Monitoring, (ETSI Aeronauticos,
Madrid, June 2000), pp. 397-405.
10. Juntunen, M. and Linjama, J., A test method for estimation of dynamic properties of isolators, European COST F3 Conference on System
Identification & Structural Health Monitoring, (ETSI Aeronauticos, Madrid,
June 2000), pp. 815-829.
11. Kerschen, G., Lenaerts, V., and Golinval, J.C., Proper orthogonal decomposition and model reduction of nonlinear systems, European COST F3
Conference on System Identification & Structural Health Monitoring, (ETSI
Aeronauticos, Madrid, June 2000), pp. 451-460.
12. Keye, S., Prediction of modal and frequency response data from a validated finite element model, 2nd International Conference on Identification in Engineering Systems, (Swansea, March 1999), Edts Friswell, Mottershead &
Lees, pp. 122-134.
13. Kullaa, J., Monitoring simulation and damage detection of the Z24 bridge,
European COST F3 Conference on System Identification & Structural Health Monitoring, (ETSI Aeronauticos, Madrid, June 2000), pp. 353-362.
14. Linjama, J., and Juntunen, M., Estimation of dynamic properties of resilient mounts, 2nd International Conference on Identification in Engineering Systems, (Swansea, March 1999), Edts Friswell, Mottershead & Lees, pp.
74-83.
15. Link, M., and Graetsch, Th., Assessment of model updating results in the presence of model structure and parametrisation errors, 2nd International Conference on Identification in Engineering Systems, (Swansea, March 1999),
Edts Friswell, Mottershead & Lees, pp. 48-62.
16. Marchesiello, S., Garibaldi, L., Wright, J.R., and Cooper., J.E., Applications of the conditioned reverse path method to multi-degree-of-freedom non-linear
systems, European COST F3 Conference on System Identification & Structural
Health Monitoring, (ETSI Aeronauticos, Madrid, June 2000), pp. 429-438.
17. Meyer, S., Weiland, M., and Link, M., Identification of local stiffness and damping non-linearities, European COST F3 Conference on System
Identification & Structural Health Monitoring, (ETSI Aeronauticos, Madrid,
June 2000), pp. 439-450.
18. Peeters, B., De Roeck, G., Hermans, L., Wauters, T., Krämer C. and De Smet, C., Comparison of system identification methods using operational data of a bridge test, ISMA 23, International Conference on Noise and Vibration
Engineering, (K.U. Leuven, Belgium, September 1998), pp. 923-930.
19. Rice, H.J. and Fitzpatrick, J.A., A generalised method for spectral analysis of
nonlinear systems, Mechanical Systems and Signal Processing, (1988), 2,
pp. 195-207.
20. Worden, K., Non linearity in structural dynamics : The last ten years, European
COST F3 Conference on System Identification & Structural Health Monitoring,
(ETSI Aeronauticos, Madrid, June 2000), pp. 29-51.
21. Zapico, J.L., Worden, K., and Molina, F.J., Structural Damage assessment using neural networks, European COST F3 Conference on System
Identification & Structural Health Monitoring, (ETSI Aeronauticos, Madrid,