UNIVERSITÉ DE MONTRÉAL
SELF ASSEMBLY AND POLYMERIZATION OF MELANIN BUILDING BLOCKS FOR SUSTAINABLE ELECTRONICS
DOMINIC BOISVERT
DÉPARTEMENT DE GÉNIE PHYSIQUE ÉCOLE POLYTECHNIQUE DE MONTRÉAL
MÉMOIRE PRÉSENTÉ EN VUE DE L’OBTENTION DU DIPLÔME DE MAÎTRISE ÈS SCIENCES APPLIQUÉES
(GÉNIE PHYSIQUE) AOÛT 2018
ÉCOLE POLYTECHNIQUE DE MONTRÉAL
Ce mémoire intitulé :
SELF ASSEMBLY AND POLYMERIZATION OF MELANIN BUILDING BLOCKS FOR SUSTAINABLE ELECTRONICS
présenté par : BOISVERT Dominic
en vue de l’obtention du diplôme de : Maîtrise ès sciences appliquées a été dûment accepté par le jury d’examen constitué de :
M. YELON Arthur, Ph. D., président
Mme SANTATO Clara, Doctorat, membre et directrice de recherche M. FRANCOEUR Sébastien, Ph. D., membre et codirecteur de recherche M. MOUTANABBIR Oussama, Ph. D., membre
DEDICATION
To all my colleagues in the lab who helped me with manipulations, data analysis or specific expertise, and assisted me. Your help was greatly appreciated and has forged this thesis as well as who I am today. Your support will never be forgotten.
ACKNOWLEDGEMENTS
I hereby want to thank many people without whom this work would not have seen the light of day. I will start by thanking my research director, Pr. Clara Santato, who kept me on the right track throughout this project. She knew how to prevent me from getting lost in the numerous questions that arose from this MSc project without snuffing my intellectual curiosity.
I also want to thank my codirector, Pr. Sébastien Francoeur, for helping me stay focused on important things. Although the project turned out differently than initially expected, he taught me not to overlook details that can seem trivial at first, but end up shedding light on more interesting questions.
I thank Pr. Christian Pellerin for his valuable advice regarding organic materials as well as his very interesting interpretations regarding my experiments.
I want to thank Eduardo di Mauro, a colleague in the lab that helped me greatly on this project both with his knowledge of melanin and extremely thorough work standards. I also want to thank other colleagues with whom I collaborated, notably Manuel Reali, Dr Guido Soliveri, Julia Wüensche, Patrick Daoust and Matthieu Gauthier.
I want to thank all the technicians that work in the various labs I used, notably Yves Drolet, for keeping the instrumentation and facilities to their full potential. I also thank Patricia Moraille for her valuable advice and technical guidance in the AFM lab.
I also thank the FRQNT (Fond de Recherche du Québec – Nature et Technologie) for financial support by awarding me a scholarship that made the project much easier to be carried out.
Finally, I also want to thank all of those near me during my research time in Polytechnique Montréal, including friends, family, and other colleagues that I did not mention in the previous paragraphs.
RÉSUMÉ
L’électronique organique est un domaine émergent apportant petit à petit de nouvelles possibilités dans le monde de l’électronique : les matériaux organiques sont récemment très prisés en recherche en raison de leur abondance, potentielle compostabilité et biocompatibilité et de leur conductivité (qui peut présenter des comportements hybrides de conduction électronique et ionique), ouvrant la porte à un nouveau domaine appelé l’électronique verte. Parmi ces matériaux, l’eumélanine est un candidat intéressant puisque ce biopigment se retrouve largement chez l’humain et chez plusieurs autres organismes vivants. Celui-ci présente plusieurs propriétés comme la chélation métallique, une conduction mixte électronique/ionique dépendante de l’humidité de l’atmosphère et une forte absorption UV-visible. De plus, ce biopigment est potentiellement biodégradable.
Le principal problème ressortant de l’utilisation de l’eumélanine en tant que matériel dans des dispositifs organiques provient de son fort désordre chimique et physique qui limite la fabrication contrôlée de dispositifs. L’eumélanine émerge effectivement de deux molécules précurseurs (monomères), le dihydroxyindole (DHI) et le dihydroxyindole-2-acide carboxylique (DHICA), qui se combinent suite à une série d’interactions comme de l’empilement π-π, l’auto-assemblage (autres que l’empilement π-π), la liaison hydrogène, la polymérisation (formation de liaisons covalentes entre les monomères), et, la plupart du temps, un mélange des trois interactions, créant ainsi une macromolécule désordonnée et difficile à contrôler pour la création de dispositifs. Le sujet de ce mémoire concerne l’étude des interactions entre ces précurseurs et leur menant à la formation de l’eumélanine. L’attention a été focalisée sur le monomère DHI, ayant une structure moléculaire plus simple que celle du DHICA.
Il en ressort que le dépôt de monomères de DHI sur divers substrats mène à la formation de structures auto-assemblées qui proviennent probablement d’un processus d’agrégation limité par la diffusion qui stabilise l’échantillon en une forme cristallisée dans laquelle les monomères de DHI peuvent ensuite polymériser en gardant la même structure. Le processus d’agrégation menant à la formation de ces domaines cristallins est fortement influencé par l’humidité, les interactions avec le substrat et les différences entre différentes synthèses de monomères.
Des études plus approfondies sur la formation de ces structures, au-delà de ce travail de maîtrise, doivent encore être faites afin d’étudier plus attentivement les propriétés de ces structures. Malgré le fait que plusieurs questions restent ouvertes concernant le processus de formation de
l’eumélanine (ou mieux de poly-DHI), l’observation de ces structures organisées consiste en la première étape vers un contrôle de la croissance de l’eumélanine de type poly-DHI au niveau moléculaire, ce qui pourrait mener à son utilisation future dans des applications d’électronique organique verte.
ABSTRACT
Organic electronic materials, featuring biocompatibility and mixed electronic/ionic conduction, have been recently explored to demonstrate the use of electronic devices for the biomedical and sustainable (green) electronics sectors. Amongst these materials, eumelanin is a great candidate since it is a biopigment found in the human body as well as in many other living organisms that features interesting properties such as metal chelation, hydration-dependent mixed electronic/ionic conductivity, strong UV-visible absorption and, potentially, biodegradability.
The main challenge with this biopigment, emerging from the combination of two precursors (building blocks) dihydroxyindole (DHI) and dihydroxyindole-2-carboxylic acid (DHICA), lies in its strong chemical and physical disorder which limits the controlled fabrication of devies. The two building blocks interact through − stacking, self-assembly (other than − stacking), H-bonding, polymerization, and, most of the time, a combination of the three interactions. The disorder makes a challenging subject to control the structure and the functional properties of eumelanin samples for device production.
The object of this MSc research project is to study the interactions between the building blocks of eumelanin leading to the formation of eumelanin, at the surface of substrates of technological interest. The attention is primarily focused on the DHI monomer (not the DHICA), due to the complexity of the study and the time frame of the MSc project.
DHI monomers on various substrates interact through noncovalent bonding generating diffusion-limited aggregates, featuring a quasi-crystalline arrangement; from this arrangement, the DHI molecules can polymerize while keeping their quasi-crystalline structure. The aggregation process leading to the formation of these structures is notably influenced by relative humidity of the atmosphere, interactions with the surface of the substrate and batch-to-batch differences.
Further studies, beyond this MSc work, will be needed to shed light onto the underlying properties of these quasi-crystalline structures. Although there are still many undiscovered issues about the formation process of eumelanin, the observation of these well-ordered structures is the first step into possibly controlling the (supra)molecular structure of DHI-melanin (poly-DHI), which could lead to the use of eumelanin films in future sustainable electronic devices.
TABLE OF CONTENTS
DEDICATION ... III ACKNOWLEDGEMENTS ... IV RÉSUMÉ ... V ABSTRACT ...VII TABLE OF CONTENTS ... VIII LIST OF TABLES ... X LIST OF FIGURES ... XI LIST OF APPENDICES ... XV LIST OF SYMBOLS AND ABBREVIATIONS... XVI
CHAPTER 1 INTRODUCTION ... 1
1.1 Organic electronics: an overview ... 1
1.2 Review on melanins ... 2
1.2.1 Ammonia-induced solid-state polymerization ... 7
1.3 Open problems in eumelanin ... 8
1.4 Objectives ... 9
1.5 Outline of the document ... 10
CHAPTER 2 EXPERIMENTAL PROCEDURES AND TECHNIQUES ... 11
2.1 Sample fabrication ... 11
2.2 Experimental techniques ... 13
2.2.1 Atomic Force Microscopy (AFM) ... 13
2.2.2 Optical microscopy and interference ... 15
2.2.3 Fourier Transform Infrared Spectroscopy (FTIR) ... 18
CHAPTER 3 RESULTS AND DISCUSSION ... 22
3.1 Eumelanin self-assembly from building blocks ... 22
3.1.1 Formation of aggregated structures ... 22
3.1.2 Observation of the DHI samples by Atomic Force Microscopy ... 29
3.1.3 Observation of the DHI samples by optical microscopy ... 31
3.1.4 Discussion on possible covalent interactions in the DHI-based samples ... 38
3.2 Summary ... 39
CHAPTER 4 CONCLUSIONS AND PERSPECTIVES ... 41
BIBLIOGRAPHY ... 43
LIST OF TABLES
Table 2.1: Deposition parameters for the spin coating of DHI-based samples ... 11 Table 2.2: Evolution of the water contact angle on different substrates before and after UV-ozone
cleaning. ... 13 Table 2.3: Numerical frequencies observed in the FTIR and SERS spectra of the sepia sample
extracted in the laboratory, together with its tentative assignments, and published data for indole, pyrrole, pyrrole derivatives, and for the eumelanin extracted from Rana esculenta L. [58]. ... 20
LIST OF FIGURES
Figure 1.1: The two main building blocks of eumelanin, dihydroxyindole (DHI) and dihydroxyindole-2-carboxlyic acid (DHICA). Sites 2, 3, 4, and 7 are active for polymerization in DHI; 3, 4 and 7 for DHICA. ... 3 Figure 1.2: Various oligomers obtained from the oxidation and polymerization of DHI monomers
[37]. Possible dimers are shown in the first line while other likely trimers and tetramers are shown below. ... 4 Figure 1.3: The oligomerization, stacking and aggregation in eumelanin [38]. ... 4 Figure 1.4 : Synthesis of 5,6-dihydroxyindoles (1 and 2, i.e. DHI and DHICA) by the oxidative
metabolism of tyrosine and their role in the biosynthesis of eumelanins as it takes place in the human body [44]. ... 5 Figure 1.5: a) A simulation of the absorption spectrum of eumelanin according to the chemical
disorder model [51], and b) simulations of the − stacking of a few pentamers [52]. ... 7 Figure 1.6: Schematic illustration of the AISSP procedure for DHI melanin film deposition [32]. 8 Figure 1.7 : UV-vis profiles of DHI thin film fabricated by AISSP. Plots are reported from Pezzella
2015 [32], and are taken 5, 15, 30, 45, 60 and 180 min after exposure to a polymerization inducing atmosphere. Arrows denote evolution. ... 8 Figure 2.1: The UV-ozone cleaning mechanism uses UV light to create activated oxygen to remove
molecular organic contaminants from surfaces [56]. ... 12 Figure 2.2: Contact angle evolution of a water drop on SiO2 already cleaned with solvents (see
text): a) before UV-ozone cleaning, b) 5 min after UV-ozone cleaning and c) 30 min after UV-ozone cleaning. ... 13 Figure 2.3: Working principle of an AFM instrument [57]. ... 14 Figure 2.4: Tapping mode AFM images, (a) phase and (b) height, of DHI-based samples spin-
coated from 0.05 mg/mL methanol solution on a SiO2/Si wafer. ... 15
Figure 2.5: (a) AFM height image of the left border of a scratch made on a poly-DHI sample on SiO2 and (b) corresponding step profile. ... 15
Figure 2.6: 500 µm500 µm optical images of a DHI-based sample on (a) 200 nm-thick SiO2/Si
and (b) quartz. ... 16 Figure 2.7: Scheme of the principle of a quarter-wave anti-reflective coating. 𝐼 is the incident ray,
𝑅𝑥 a reflected ray, 𝑇 the transmitted ray, 𝑛𝑥 the refractive index, and 𝜆 = 𝜆0/𝑛𝑥, where 𝜆0 is the vacuum wavelenght. The light reflected from the air/coating interface (R1) and the
coating/substrate interface (R2) can interfere, causing the reflected light spectrum to be
different from the incident light spectrum. Destructive interference happens if equation (1) is respected. ... 17 Figure 2.8 : FTIR absorption spectrum of a DHI-based sample after AISSP on a BaF2 substrate.
The main vibrations in the spectrum are identified with textured boxes, based on attributions proposed by Centeno [58]. ... 19 Figure 2.9: (a) Phase and (b) height images of a SiO2/Si substrate inspected by AFM in tapping
mode. ... 21 Figure 3.1: FTIR spectra of “dry air” spin coated DHI-based samples (red) and DHI gas phase
simulation (pink). The simulation is unreliable for wavenumbers over 2000 cm-1, and the BaF2
features strong absorbance under 1000 cm-1. ... 23 Figure 3.2: FTIR spectrum of Sepia melanin exctracted from cuttlefish (solid line, the peak around
1100 cm-1 originates from contaminants) and synthetic commercial (dotted). [58] ... 24 Figure 3.3: FTIR spectra of “dry air” DHI sample as a function of time. The three spectra refer to
the same DHI sample, kept in dry air at all time: first spectrum (45 min after deposition), 3 d and 5 h after deposition, and 12 d and 5 h after deposition. FTIR spectra normalized to the height of the H-stretching band peak, at around 3400 cm-1. ... 25 Figure 3.4: FTIR spectra of a DHI sample in ambient atmosphere, as a function of time, normalized
to the height of the H-stretching band peak, around 3400 cm-1. ... 26 Figure 3.5: DHI and its redox forms, hydroquinone (H2Q, reduced form), semiquinone (SQ, semi-reduced form) and quinone (Q, oxidized form). The quinone imine for (QI) is the tautomer of Q [63]. ... 27 Figure 3.6: FTIR spectrum of a DHI AISSP sample after fabrication, and after 2 weeks in ambient
Figure 3.7: Comparison of the first spectra of each type of sample, normalized to the height of the H-stretching band peak, around 3400 cm-1. ... 29 Figure 3.8: 20 µm20 µm height AFM images of a DHI-based sample (batch Tanya) deposited on
SiO2/Si with the usual parameters (Table 2.1): a) 30 min-old sample, b) 2 h-old. Samples were
kept in ambient atmosphere (22°C, 30% RH). Smooth brown regions correspond to smooth deposited DHI while textured zones show aggregated DHI. ... 30 Figure 3.9: AFM height images taken on a DHI-based sample (batch Tanya) deposited on SiO2/Si
with the usual parameters (Table 2.1). Samples were kept in ambient atmosphere (22°C, 30% RH). Images are 4 minutes apart, on the same spot. Smooth brown regions correspond to smooth deposited DHI while textured zones show aggregated DHI. ... 30 Figure 3.10: 500 µm500 µm optical images of formally identical DHI-based samples (batch
Mustard) deposited with the usual parameters (Table 2.1), kept in ambient conditions for three days. A few recognizable features are identified: centers of the aggregates (i), common boundaries between two aggregates (j), and branch-like extremities with depleted regions in between (k). Regions where no DHI was deposited during fabrication are also identified (h). ... 32 Figure 3.11: 1 mm1 mm optical images constituting a time-lapse for a DHI-based sample (batch
Mustard) kept in ambient conditions (RH 30 %, 23°C). Time after deposition: a), 15 min, b) 45 min, c) 2 h and d) 2 weeks. ... 33 Figure 3.12: 500 µm500 µm optical images of DHI samples (kept during three days in ambient
conditions after fabrication) prepared starting from different batches: a) Alessandro, b) Tanya and c) Mustard batch. ... 34 Figure 3.13: 500 µm500 µm optical images of 1 day-old DHI-based samples (batch Mustard)
kept for 24 h in atmospheres with different RH: a) 27%, b) 41%, and c) 65%. ... 35 Figure 3.14: 500 µm500 µm optical images of a DHI-based sample (batch Mustard) observed
3 days after deposition, (a) before and (b) after exposure to 100 % RH, for an hour. During the 3 days the sample was kept in ambient conditions. ... 35
Figure 3.15: 500 µm500 µm optical images shows that the aggregation of the DHI-based material (batch Alessandro) takes place in a continuous way over a 30 nm-thick gold step on a SiO2
substrate. The DHI layer is ca. 50 nm thick in the blue (SiO2) region and ca. 30 nm thick in
the yellow (gold) region, as determined by AFM scratch measurements. ... 36 Figure 3.16: 500 µm500 µm optical images of DHI-based samples deposited on various
substrates: a) SiO2, b) quartz, c) microscopy glass slide, d) gold, e) platinum, f) palladium, g)
copper, h) Teflon and i) BaF2. Metals were in the form of films thermally evaporated on SiO2.
... 37 Figure 3.17: 3 mm3 mm optical images of two DHI-based samples deposited on (a, b)
polypropylene and (c, d) quartz. (a) and (c) show optical images of the two samples less than 30 min after fabrication; (b) and (d) show the corresponding samples after 10 months in ambient conditions. ... 38
LIST OF APPENDICES
LIST OF SYMBOLS AND ABBREVIATIONS
AISSP Ammonia-induced solid-state polymerization amu Atomic mass unit
AFM Atomic force microscopy
AR Antireflective
CCA Cluster-cluster aggregation DBS Deep brain stimulation DFT Density functional theory
DHI Dihydroxyindole
DHICA Dihydroxyindole-2-carboxylic acid DLA Diffusion-limited aggregation DMSO Dimethylsulfoxide
FTIR Fourier transform infrared spectroscopy FWHM Full width at half maximum
MALDI-MS Matrix-assisted laser desorption/ionization mass spectrometry
RH Relative humidity
RT Room temperature
UV-Vis UV-Visible XRD X-Ray Diffraction
CHAPTER 1 INTRODUCTION
1.1 Organic electronics: an overview
Conventional electronics, mainly Si-based, has revolutionized our world to such an extent that we are currently living in an era often referred to as “Silicon age” that is said to follow the stone, bronze, and iron ages [1]. The capability to control the physicochemical properties of semiconducting materials is at the basis of the success of conventional electronics. Despite this success, conventional electronics suffers from a number of limitations, in particular in terms of mechanical flexibility of the devices and operational instability in moisture-rich atmosphere, e.g. for applications in the biomedical sector.
First stumbled upon approximately four decades ago, organic electronic materials are gaining in popularity for their various properties that can be used to complement Si-based electronics. Organic electronics are based on carbon-based materials featuring conjugation, i.e. alternate simple and double covalent C-C bonds in the molecular structure [2]. Small organic molecules, typically processed by vacuum-based techniques, and organic polymers, typically processed by solution-based techniques, are both investigated in organic electronics. The structural, charge carrier transport (electronic and ionic) [3], [4] and optical properties of organic electronic materials are dramatically affected by their molecular structure. Chemical synthesis has been successfully and widely employed to tune the physicochemical properties of organic electronic materials. This tuning can be used for ad hoc applications (e.g. color of the emitted light for organic light-emitting devices) [5], [6].
Thanks to the softness of organic materials, organic electronic materials have been used for flexible, bendable, rollable and stretchable applications [7]–[10]. The permeability of organic electronic materials to ions make them excellent candidate for bioelectronics applications such as sensors or catalysts in biological environments [11]. Furthermore, bio-sourced, non-toxic and biodegradable organic electronic materials make them ideal for applications in sustainable electronics [12]. Eumelanin is of interest for this since it is non-toxic (eumelanin is indeed edible), it is bio-sourced (e.g. from squid ink) abundant and, in principle biocompatible [12], [34]. The biodegradability of eumelanin is currently investigated by Santato’s group.
1.2 Review on melanins
Melanin is a natural organic biopigment found in many living organisms [13]. In the human body, it is known to be the main color agent in skin and hair. The term “melanin” is a general term that refers to dark organic pigments. It represents an entire category of different molecular organic materials including eumelanins, pheomelanins and neuromelanins, which can be found in the human body, and allomelanins, which can be found in plants and microorganisms [14]. Eumelanin is the black brown type of melanin that can be found in the skin and hair of many mammals. Pheomelanin is its yellow-to-reddish analogue, that can be observed in red hair or hen feathers [13]. Neuromelanin is especially present in the substantia nigra, a part of the brain in which a lowered concentration of neuromelanin is linked to Parkinson’s disease, suggesting a potentially protective role for neuromelanin against oxidative agents [15], [16].
In the late 1960’s, reports were published about the semiconducting behaviour of eumelanin [17], [18]. Since then, it has been shown that eumelanin is not really a semiconductor, but an organic material sustaining protonic and electronic transport [19]–[21]. Eumelanin is known in the human body for its photoprotective properties. Other properties of interest for organic electronic applications are metal chelation [22]–[29] and water-dependent mixed ionic-electronic conduction [4], [30]. The poor solubility of eumelanin in common organic solvents limited the depth of physicochemical studies on eumelanin throughout the years. The main obstacle to using eumelanin in organic electronics is its strong chemical and physical disorder, at the molecular and supramolecular levels. Disorder did not prevent researchers from trying to build various melanin-based devices such as supercapacitors and solar cells [11], [31]–[33].
Two monomeric structures (Figure 1.1) constitute the building blocks of eumelanin: dihydroxyindole (DHI) and dihydroxyindole-2-carboxylic acid (DHICA).
Figure 1.1: The two main building blocks of eumelanin, dihydroxyindole (DHI) and dihydroxyindole-2-carboxlyic acid (DHICA). Sites 2, 3, 4, and 7 are active for polymerization in DHI; 3, 4 and 7 for DHICA.
DHI and DHICA monomers can undergo, in solution or solid state, a series of interactions. Such interactions can be non-covalent, e.g. − stacking and self-assembly (other than − stacking), as well as covalent, e.g. polymerization. Eumelanin is mostly composed of small polymers, which are referred to as oligomers. Oligomers can be defined by the number of monomers they are made of, such as dimers for two monomers, trimers (three), and up to, approximately, octamers (eight). The polymerization of the monomers eventually leads to the black-brown pigment, eumelanin. Most of the chemically related disorder of eumelanin appears during polymerization since, unlike most polymers, eumelanin’s polymers can form from two different monomers (possibly present in different redox states), which can themselves be linked to each other through different sites. Sites 2, 3, 4, and 7 are active for polymerization of DHI, and the same is true for DHICA, with the exception of site 2, which is occupied by the carboxylic acid group. Figure 1.2 shows various oligomers that can be obtained by the polymerization process of DHI, although many more are possible and have been observed.
The mechanisms of 5,6-dihydroxyindole (DHI) dimerization and further dimer–dimer coupling [35] to form the tetramers are uncertain, but it has been suggested, on the basis of a recently proposed general-purpose reactive indicator produced through ab initio DFT calculations, that these reactions proceed through an electron-transfer-controlled process subsequent to catechol– quinone interactions [36].
Figure 1.2: Various oligomers obtained from the oxidation and polymerization of DHI monomers [37]. Possible dimers are shown in the first line while other likely trimers and tetramers are shown below.
Figure 1.3 is a schematic illustration of the non-covalent processes leading to eumelanin from DHI and DHICA oligomers. Oligomeric disks start to interact through π-π stacking to form a few nanometer-high clusters. Afterwards, the clusters interact with neighboring clusters, stacking in an edge-to-edge manner for a few tens of nanometers. These clusters finally create aggregates of 100 to 200 nm in diameter [38]–[43]. The material formed from this process is clearly a disordered material.
The biosynthesis of eumelanin occurs via the enzymatic oxidation of the amino acid tyrosine and is described by the Raper–Mason scheme (Figure 1.4) [44]. The building blocks DHI and DHICA (respectively 1 and 2 in Figure 1.4) are oxidized in the last steps of the synthesis to eventually produce the eumelanin polymers.
The synthesis of eumelanin powders used for scientific research purposes is either obtained by a “top-down” approach, via the extraction (purification) of eumelanin from a natural source [13], [45] or from a “bottom-up” approach, via the synthetic route shown in Figure 1.4. Both routes yield polymerized eumelanin, likely featuring a number of different supramolecular assemblies.
Figure 1.4 : Synthesis of 5,6-dihydroxyindoles (1 and 2, i.e. DHI and DHICA) by the oxidative metabolism of tyrosine and their role in the biosynthesis of eumelanins as it takes place in the human body [44].
Although the (supra)molecular structure of eumelanin is ill defined, as it is generally the case for bio-sourced materials, (supra)molecular models have been proposed in the literature [46]. X-ray diffraction and scanning tunneling microscopy studies show that the size of eumelanin oligomers formed from DHI (protomolecules) is around 15–20 Å [40], which suggests that the tetramers and pentamers formed by covalently bonded DHI are the most probable molecular structures of
eumelanin. Matrix-assisted laser desorption/ionization mass spectrometry (MALDI-MS) studies show that the mass of eumelanin protomolecules is within or below 600–1200 amu. Hence, most of the investigations performed by mass spectrometry support that the tetramers and pentamers constitute the majority of eumelanin, while slightly larger structures, such as the hexamers and octamers, are also possible. Dreyer et al. [47] recently proposed a new molecular model for poly(dopamine), i.e. synthetic eumelanin, and natural eumelanin, based on a variety of solid-state spectroscopic and crystallographic techniques. Their study suggests that eumelanins results from the supramolecular assembly of monomers. These reports show the importance of understanding the early steps for the polymerization of eumelanin, and that different molecular models might apply in different situations, depending on various environmental and physicochemical factors. The polymerization of eumelanin also leads to the appearance of its well known, broadband, featureless and monotonic UV-Visible absorption spectrum [32], [48], [49]. Optical absorption of melanin is currently explained by two models that put the emphasis on the intrinsic disorder in the material: the “chemical disorder model” [50], [51] and the “geometric disorder model” [52]. The chemical disorder model suggests that the broadband and monotonic UV-visible absorption spectrum of eumelanin originates from the superposition of many different absorption spectra rising from the various chemical species that appear in the early steps of eumelanin formation i.e. the various oligomers. Figure 1.5a shows that the superposition of many differing gaussian absorption spectra can lead to a monotonic and featureless absorption spectrum [50], [53], [54]. The geometric disorder model proposes that excitonic effects resulting from the π- π stacking step shown in Figure 1.3, flatten the absorption spectrum of the oligomers with increasing stacks, and that a high number of different oligomers is not necessary to explain the featureless absorption. Figure 1.5b shows a simulation of the effect of the gradual stacking of 3 identical pentamers where the sharpest features are lost with stacking. A combination of the two effects (chemical and geometrical disorder) can also explain the broadband, monotonic, and featureless absorption spectrum of eumelanin. Monitoring the advancement of the polymerization through the evolution of the absorption spectra of eumelanin is frequently used in the literature [55].
Figure 1.5: a) A simulation of the absorption spectrum of eumelanin according to the chemical disorder model [51], and b) simulations of the − stacking of a few pentamers [52].
1.2.1 Ammonia-induced solid-state polymerization
Ammonia-induced solid-state polymerization (AISSP) has been recently reported as an experimentally simple and versatile approach to the fabrication of device-quality thin films of DHI and DHICA, on various substrates (Figure 1.6). AISSP is based on a deposition by spin coating of a suspension of the DHI monomer in methanol, followed by solid state polymerization induced by exposure to gaseous ammonia in an air-equilibrated atmosphere. MALDI-MS suggests a limited degree of polymerization through AISSP. The highest oligomers detected are hexamers and heptamers. Both the structural integrity of the synthesized eumelanin (i.e. preservation of indole units and avoidance of aromatic ring fission) and the possibility to control the advancement of the polymerization can be attributed to the specific constraints and the lack of water associated with the solid-state conditions, limiting water and/or hydroperoxyl anion-induced oxidative cleavage of indole units and uncontrolled oligomer chain growth. Figure 1.7 shows the evolution of a UV-vis absorption spectra from the monomeric layer to the polymerized layer during AISSP.
Figure 1.6: Schematic illustration of the AISSP procedure for DHI melanin film deposition [32].
Figure 1.7 : UV-vis profiles of DHI thin film fabricated by AISSP. Plots are reported from Pezzella 2015 [32], and are taken 5, 15, 30, 45, 60 and 180 min after exposure to a polymerization inducing atmosphere. Arrows denote evolution.
1.3 Open problems in eumelanin
Despite reports available in the literature about the charge transfer and charge carrier transport properties of eumelanin [4], many questions still need to be answered. For instance, although the eumelanin absorption spectrum is known, the nature of the chromophores responsible for the efficient and featureless broadband absorption still needs to be identified. Furthermore, the oxidative polymerization mechanism is still not well understood, especially with respect to the electron transfer processes involved in the early stages of the dimer formation.
It is paramount to control the formation of eumelanin from the early stages to understand how the molecular and supramolecular order affect its physicochemical properties and, in perspective, the performance of eumelanin-based sustainable devices. The disorder of eumelanin and the reactive
nature of the monomers render poor the reproducibility of the experiments performed with melanin. Part of the challenge also lies in the fact that literature regarding the chemically controlled formation of eumelanin on technologically relevant substrates is very low.
1.4 Objectives
The objectives of this MSc project evolved in time, since unexpected and interesting phenomena and processes were observed, at the very beginning of the project. We decided, because of the relevance of such phenomena and processes, that they were worth a thorough investigation. The results of such investigation and their critical interpretation constitute the main body of the present MSc thesis.
If the original objective of the MSc work was the study of the optical absorption properties of melanin monomers, oligomers and polymers to gain insight into the molecular structure of the chromophores responsible for the optical absorption in melanin pigments, the fascinating structural and morphological features observed on samples of melanin monomers at the surface of, e.g., thermal silicon dioxide, brought us to try to understand the formation of such morphological features, considering a wide range of interactions, from non-covalent to covalent. We remind here that since decades materials scientists and physical chemists have tried to understand the mechanism of formation of melanin biopigments.
We believe we have in our hands an ideal system that, for the first time, could open the possibility to understand how melanin polymers form in a way to try to control both molecular and supramolecular structure of eumelanin, in turn affecting its functional properties and, on the long term, the performance of eumelanin-based device.
Keeping these considerations in mind, the “re-formulated” objectives of this MSc thesis, oriented on morphology and structural problems instead of optical absorption problems, are:
• Discovering how experimental factors, such as the quality of the solvent (anhydrous or not) used for the processing of the samples and the atmosphere during the storage of the samples, affect the morphology and structure of the samples and their evolution over time.
• Understanding the formation of eumelanin materials from monomers, trying to figure out the role played by non-covalent (e.g. π-π stacking, hydrogen bonding) and covalent (polymerization of the monomers) interactions in the formation of the materials.
The understanding of the early stages of formation of the melanin biopigment polymers is essential for establishing methodologies, understanding, controlling, and exploiting eumelanin and other natural functional materials for devices applications.
1.5 Outline of the document
This MSc document is organized in two main chapters, Experimental procedures and techniques (Chapter 2), and Results and discussion (Chapter 3). These two chapters are followed by a chapter of Conclusions and perspectives. Chapter 2 introduces the experimental procedures and techniques used during this experimental research activity, from the careful cleaning of the substrates where the samples were overgrown to the preparation process of the samples and the characterization techniques used, such as AFM and optical microscopy, FTIR and X-Ray diffraction (XRD). Most of Chapter 3 focuses on the observation and interpretation of the evolution of eumelanin samples from the monomer state to the aggregate state (involving non-covalent and covalent interactions), in controlled atmosphere.
CHAPTER 2 EXPERIMENTAL PROCEDURES AND TECHNIQUES
This chapter introduces the experimental procedures and techniques used in this document. The first section (2.1) explains how the DHI-based “monomer” samples were fabricated whereas the second one (2.2) reviews the characterization techniques used, such as atomic force microscopy (AFM), optical microscopy, Fourier transform infrared spectroscopy (FTIR) and X-ray diffraction (XRD).
2.1 Sample fabrication
We fabricated our samples by a solution-based technique, spin coating. Spin-coating can yield films of predictable thickness with excellent reproducibility. Initially, a powder of the DHI monomers (received form our colleague, Dr A. Pezzella, at the University of Napoli, Italy) was dissolved in a solvent to form the solution to be deposited. The DHI powder has to be stored at -30°C to prevent its polymerization. As the solvent, we used methanol due to its chemical inertness with respect to DHI and suitable volatility (facility to be removed after spin-coating). We prepared the DHI solution in a dry nitrogen glove box, using methanol of anhydrous quality, to limit the chances of oxidative polymerization. Throughout this work, three main batches of DHI were used; they were named as “Alessandro” batch, synthesized in May 2016, “Tanya”, synthesized in September 2016, and “Mustard”, synthesized in December 2016. The use of three different batches was necessary due to the low yield of material following a synthesis (~ 500 mg), the batch used during each experiment is therefore specified with the presented results. The spin-coating deposition process consists of one step rotation of the sample for which the deposition parameters used for most of the experiments throughout this MSc are presented in Table 2.1.
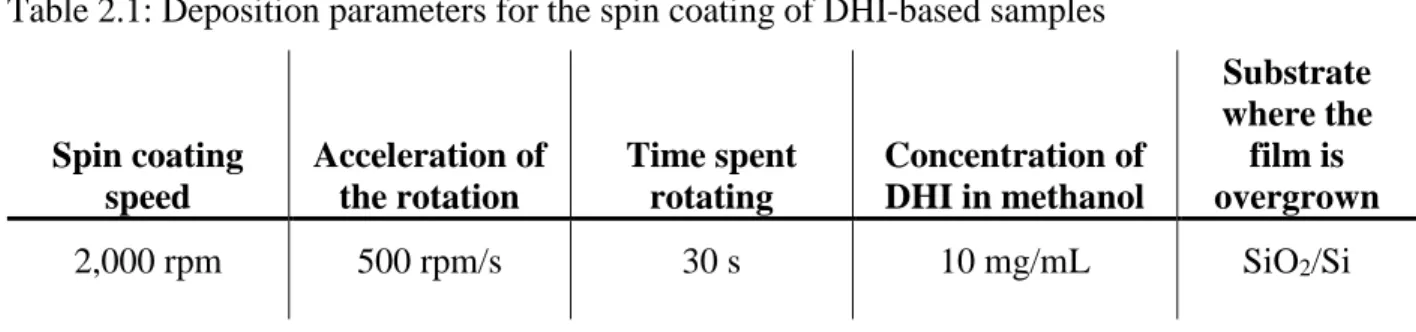
Table 2.1: Deposition parameters for the spin coating of DHI-based samples
Spin coating speed Acceleration of the rotation Time spent rotating Concentration of DHI in methanol Substrate where the film is overgrown 2,000 rpm 500 rpm/s 30 s 10 mg/mL SiO2/Si
Prior to the deposition of the DHI solution, we proceeded to the cleaning of the surface of the substrate. Before the cleaning process, substrates were blow dried with a nitrogen gun and rinsed with DI water, acetone and isopropanol to get rid of superficial dirt. Afterwards, they were placed in a Teflon sample holder and submitted to sonication in solvents meant to dissolve any organic impurities present on the surface in the following sequence: IPA (10 min), acetone (10 min) and IPA again (10 min). Every tool used, including the Teflon holder and the glass beakers, was also rinsed with the solvent used in the following cleaning step. Finally, the samples were transferred in a DI water solution for 10 min of sonication to precipitate any remaining organic contaminant. After the sonication steps, the substrates were dried with a nitrogen gun and placed individually in polypropylene sample holders. Afterwards, the substrates were brought to a UV-ozone treatment chamber. Here, activated oxygen atoms react with surface contaminants, such as photoresist, cleaning solvent residues, human skin oils and other organic contaminants, leading to their removal and increasing the wettability of the substrate (Teflon and polypropylene substrates were used during the research, they did not undergo ozone exposure).
Figure 2.1: The UV-ozone cleaning mechanism uses UV light to create activated oxygen to remove molecular organic contaminants from surfaces [56].
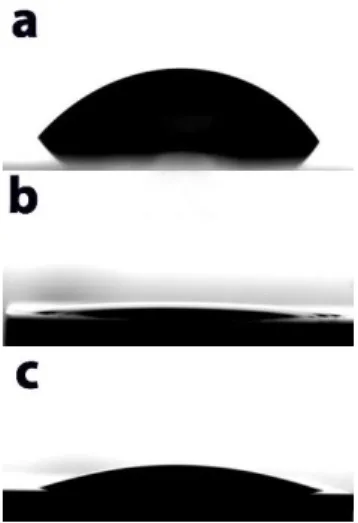
Figure 2.2 shows the effect of the UV-ozone cleaning step on the wettability of a SiO2 substrate.
After the sequential sonication cleaning steps (before UV-ozone cleaning) the contact angle of a water drop on a SiO2/Si wafer substrate is about 57° (Figure 2.2a) due to the presence of surface
contaminants which were not removed during the sonication steps, whereas after UV-ozone cleaning the angle is about 6° (Figure 2.2b). After UV-ozone cleaning, if the sample spend 30 min in ambient conditions, the wettability is lowered again due to contaminants slowly adsorbing again on the surface: the contact angle is about 14° (Figure 2.2c). Data collected with quartz and glass substrates are included in Table 2.2.
Figure 2.2: Contact angle evolution of a water drop on SiO2 already cleaned with solvents (see
text): a) before UV-ozone cleaning, b) 5 min after UV-ozone cleaning and c) 30 min after UV-ozone cleaning.
Table 2.2: Evolution of the water contact angle on different substrates before and after UV-ozone cleaning.
Substrate type Contact angle before UV-ozone Contact angle after UV-ozone (5 min) SiO2 57° 6° Quartz 51° < 2° Glass 31° 8° 2.2 Experimental techniques
To characterize the samples, different experimental techniques were used, as illustrated in what follows.
2.2.1 Atomic Force Microscopy (AFM)
AFM is a type of scanning probe microscopy. Resolution in the nanometer range can be obtained while imaging surfaces, depending on the mode of operation used, including contact mode, tapping mode, and noncontact mode. AFM is based on the measure of the deflection of a cantilever at the
surface of the sample by shining a laser on the cantilever itself and measuring the displacement of its reflection. AFM measurements permit to probe the surface topography of the sample. Figure 2.3 shows the important parts of an AFM instrument.
Figure 2.3: Working principle of an AFM instrument [57].
In contact mode, the tip is made to touch and scan the surface while keeping contact. In tapping mode, the cantilever is made to oscillate up and down near its resonance frequency. Here, when the tip comes in proximity with the surface, the topographic variations of the sample induce a change in the oscillating frequency of the cantilever. The main forces acting on the AFM tip are van der Waals, dipole-dipole interactions and electrostatic. By monitoring the change in frequency induced by the surface, tapping mode AFM can also differentiate materials, even if no topographic variations are present. AFM images taken in tapping mode provide two types of images: height images, showing the topography of the scanned area, and phase images, providing information on the oscillation phase of the cantilever. The results presented in this MSc were obtained in ambient conditions with a Digital Instrument, Dimension 3100 AFM with a silicon tip of 40 nm tip radius, in tapping mode. Figure 2.4 shows an example of a 1 μm1 μm region on a DHI spin coated sample. The presence of 2 nm-high agglomerates of poly-DHI on the SiO2 surface is visible on
Figure 2.4: Tapping mode AFM images, (a) phase and (b) height, of DHI-based samples spin- coated from 0.05 mg/mL methanol solution on a SiO2/Si wafer.
AFM is also used to measure the thickness of samples by AFM scratch measurements. A scratch is made on the sample with a blade, creating a furrow-like structure. Figure 2.5a and Figure 2.5b show the step generated after scratching a polyDHI sample and its corresponding profile, indicating that the sample is approximately 40 nm thick.
Figure 2.5: (a) AFM height image of the left border of a scratch made on a poly-DHI sample on SiO2 and (b) corresponding step profile.
2.2.2 Optical microscopy and interference
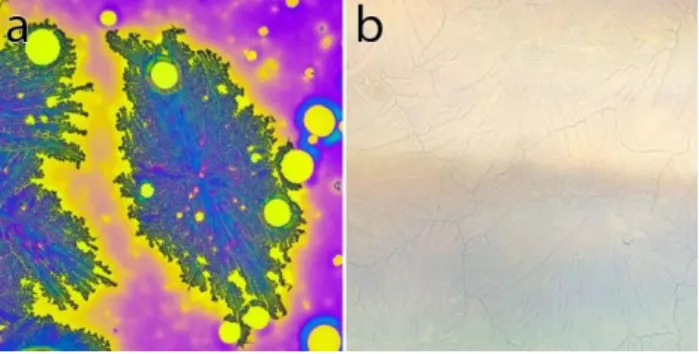
This section introduces the optical imaging system used in this MSc work. The system is an Olympus BX51 fluorescence microscope. Pictures were taken with a 40megapixel cellphone camera (Nokia Lumia 1020). The camera enables color images and time lapse auto processing to study the evolution of a sample over a few hours. Figure 2.6a shows a DHI-based sample on SiO2/Si
observed in reflective microscopy. A similar film deposited on quartz is shown in Figure 2.6b. The interference effect in (a) generates a sharp contrast of colors mostly dependent on the sample thickness whereas on quartz features are much harder to be distinguished.
Figure 2.6: 500 µm500 µm optical images of a DHI-based sample on (a) 200 nm-thick SiO2/Si
and (b) quartz.
The wafers used are composed of a 1 mm-thick monocrystalline Si on which 200 nm of SiO2 is
thermally grown (roughness of around 0.25 nm, refractive index 𝑛=1.46). In this configuration, the underlying Si acts as a mirror and the 200 nm-thick SiO2 acts as a quarter-wave anti-reflective (AR)
coating (Figure 2.7) where destructive interference is found to be around 390 nm for light arriving at normal angle, according to equation (1).
𝑥 = 𝜆0 4𝑛1+
𝑘𝜆0
2𝑛1 , 𝑘 = 0, 1, 2 … (1)
Where 𝑥 is the thickness for which destructive interference at normal conditions happens, 𝜆0 is the
vacuum wavelength, 𝑛1 the refractive index of SiO2 layer, and 𝑘 a factor to account for shorter
Figure 2.7: Scheme of the principle of a quarter-wave anti-reflective coating. 𝐼 is the incident ray, 𝑅𝑥 a reflected ray, 𝑇 the transmitted ray, 𝑛𝑥 the refractive index, and 𝜆 = 𝜆0/𝑛𝑥, where 𝜆0 is the
vacuum wavelenght. The light reflected from the air/coating interface (R1) and the
coating/substrate interface (R2) can interfere, causing the reflected light spectrum to be different
from the incident light spectrum. Destructive interference happens if equation (1) is respected.
The addition of another portion of material, such as poly-DHI, on the SiO2 modifies the
wavelengths at which the destructive interference effect happens. It is challenging to extract conclusive information about the overgrown sample from the colors, because of the combination of multiple effects such as interference, absorption and reflection of the sample and substrate, diffusion of the sample, and software image treatment. Nevertheless, AFM scans, AFM scratch measurements and time lapses suggest that color variation is a good indication of changes in the thickness of a sample. On Figure 2.6a, the yellow areas surrounding the aggregates, that look blue, is thinner than the aggregate. Purple areas far from the aggregates are unaffected by the aggregate and were unaffected during the evolution of the sample. These purple areas feature a thickness lower than the aggregates, but higher than the yellow zone.
2.2.3 Fourier Transform Infrared Spectroscopy (FTIR)
The FTIR operating principle is based on the Michelson interferometer to produce transmission or absorbtion spectra over a spectral range with high resolution. By shining broadband infrared light in the arms of an interferometer, the instrument can provide an interferogram of the sample under investigation and a Fourier transform of the obtained interferogram corresponds to the spectral information about the sample. Absorption spectra with resolution of a few cm-1 can be obtained this way. Spectra were recorded in transmission mode, with a resolution of 4 cm-1, using a Vertex 70 FT-IR spectrometer (Bruker Optics) equipped with a DLaTGS detector. At least 200 scans were averaged for each spectrum. FTIR measurements require the use of low energy light that is not expected to trigger photopolymerization in the sample [48]. An FTIR absorption spectrum of a DHI-based sample fabricated by AISSP is shown in Figure 2.8. Here the contributions of different vibrations in the spectrum are indicated as based on the attribution proposed by Centeno et al. (Table 2.3) [58]. The broad peak centered at around 3400 cm-1 is common to organic materials including O-H, N-H and C-H stretching signals. The H-stretching peak can trail off to 2500 cm-1 and is usually broad since the stretching is influenced by neighboring molecules and the formation of H bonds. Vibrations under 1700 cm-1 are usually associated with carbon-related vibrations. The region between 1700 cm-1 to 1600 cm-1 is associated with the C=O stretching, including the carbonyl bond that appears in the oxidized form of DHI. Aromatic C=C stretching can also be found in that region, but C=C aromatic ring vibrations and C=C aromatic/pyrrole ring stretching extend to lower energies, down to 1400 cm-1. C=N vibrations are found around 1500 cm-1. Simulations of the FTIR spectrum of DHI show that bands under 1500 cm-1 arise from highly coupled modes due to the resonance structures in the fused rings. It is expected to find pyrrole ring stretching near 1400 cm-1, followed by indole ring vibrations and stretching around 1350 cm-1. Between 1200 cm-1 and 1100 cm-1, in-plane deformations of CN, CH and CO dominate the spectrum. Under 1000 cm-1, the absorbance is mostly due to BaF2 [58].
3500 3000 1500 1000 0.0 0.2 0.4 0.6 0.8 1.0 1.2 1.4
stretching and deformation Ring vibrations, C=N C=C C=O Absor ba nce (a .u. ) Wavenumber (cm-1)
O-H, N-H and C-H stretching
Figure 2.8 : FTIR absorption spectrum of a DHI-based sample after AISSP on a BaF2 substrate.
The main vibrations in the spectrum are identified with textured boxes, based on attributions proposed by Centeno [58].
Table 2.3: Numerical frequencies observed in the FTIR and SERS spectra of the sepia sample extracted in the laboratory, together with its tentative assignments, and published data for indole, pyrrole, pyrrole derivatives, and for the eumelanin extracted from Rana esculenta L. [58].
2.3 Substrates
Two main types of substrates we used are: SiO2/Si wafers (1 mm-thick Si wafer where 200
nm-tick SiO2 is thermally grown) and BaF2 windows. SiO2/Si was mainly used for optical microscopy
and AFM. Figure 2.9 shows AFM images (height and phase images, please refer to section 2.2.1) of the bare SiO2 surface. The surface is smooth, with an rms roughness of about 0.25 nm.
Figure 2.9: (a) Phase and (b) height images of a SiO2/Si substrate inspected by AFM in tapping
mode.
BaF2, due to its transmission properties in the visible and infrared regions of the electromagnetic
spectrum, is ideal for FTIR studies. The transmission in the infrared region for BaF2 extends in the
CHAPTER 3 RESULTS AND DISCUSSION
To follow the formation of eumelanin (actually poly-DHI) from the early stages, monomeric DHI is deposited on various substrate surfaces and the evolution of the samples is followed by optical microscopy, Atomic Force Microscopy (AFM) and Fourier Transform Infrared spectroscopy (FTIR). Preliminary results obtained by X-ray Diffraction will be also presented and discussed. 3.1 Eumelanin self-assembly from building blocks
When DHI monomers are deposited on the surface of SiO2/Si wafer (as well as other substrates)
from methanol solutions, by spin coating, aggregated structures can be immediately observed at the substrate surface. Factors like substrate-molecule and molecule-molecule interactions together with temperature and relative humidity of the atmosphere influence the formation of these structures.
3.1.1 Formation of aggregated structures
Through the study of the effect of the molecular environment on the FTIR spectroscopic behavior of the DHI-based samples, we can get information on the supramolecular aggregation in the samples. The first type of DHI-based samples investigated by FTIR was kept in dry air during the investigations, to prevent the influence of moisture on the formation process (from now on this type of samples will be indicated as “dry air” sample). For this first type of samples, deposition was made on BaF2 in a N2 glovebox from DHI batch “Mustard”. Afterwards, the samples were
transferred to the FTIR spectrometer using a closed container; purging with dry air started immediately after the installation in the sample holder. “Dry air” samples were in contact with ambient air (ca. 40 % relative humidity) for ca. 5 minutes during sample installation. Initially, spectra were taken every 15 minutes, for 3 h, and then every 2 h for up to 3 days after deposition. The samples stayed in the sample holder for a total of 12 days in dry conditions without taking spectra. During the dry air characterization, atmospheric O2 was still present. Figure 3.1 shows the
first (initial) spectrum featuring sharp peaks that hint at the monomeric nature of the sample. Figure 3.1 also includes a comparison between such spectrum and a DFT simulation for a single DHI molecule in gas phase. The position and the ratio of the intensity of the peaks are similar, thus suggesting that the sample is indeed made of DHI monomers. Figure 3.2 shows the FTIR spectrum reported in the literature for Sepia melanin (natural eumelanin); such reference spectrum will be
useful for the discussion of our results. A large H-stretching band between 3700 cm and 2700 cm can be seen, as well as a convolution of many different vibrational signals between 1800 cm-1 and 700 cm-1 due to the disorder featured by natural eumelanin. A dominant peak (~1600 cm-1) is observed in the region associated with carbonyls [59]–[61].
1800 1600 1400 1200 1000 0.0 0.2 0.4 0.6 0.8 1.0 Absor ba nce (a .u)
Wavenumber (cm -1)
"Dry air" Initial
DHI simulation
Figure 3.1: FTIR spectra of “dry air” spin coated DHI-based samples (red) and DHI gas phase simulation (pink). The simulation is unreliable for wavenumbers over 2000 cm-1, and the BaF2
features strong absorbance under 1000 cm-1.
Figure 3.3 shows the time evolution of the “dry air” samples. Comparing the first spectrum in Figure 3.3 to that of Sepia melanin (Fig 3.2), it can be observed that the H-stretching band, in the region 3600 cm-1 - 3000 cm-1, is narrower for the “dry air” sample (FWHM of 177 cm-1) than for Sepia melanin (FWHM is around 400 cm-1). The low-energy bands, between 1800 cm-1 and
for DHI compared to Sepia melanin. This low-energy spectral region corresponds to carbon-related vibrations (indicated in Figure 2.8) [58].
Figure 3.2: FTIR spectrum of Sepia melanin exctracted from cuttlefish (solid line, the peak around 1100 cm-1 originates from contaminants) and synthetic commercial (dotted). [58]
During the evolution of the “dry air” sample (Figure 3.3), the H-stretching band narrows even more, going from a FWHM of 177 cm-1 to 146 cm-1. This suggests that the H bonds (N-H, C-H,
and O-H) are part of a supramolecular arrangement where DHI molecules are immersed in a similar environment. The appearance of band splitting in the H-stretching region (three peaks between 3400 cm-1 and 3500 cm-1, indicated by downward pointing arrows in Figure 3.3) further hints at this ordered, crystalline supramolecular arrangement. Furthermore, peaks can be seen to split also in other areas on the spectrum, e.g. the 1505 cm-1 and 1320 cm-1. Attribution of these peaks is difficult because of the strong coupling between the various vibrational modes, but the 1505 cm-1 and 1320 cm-1 peaks could possibly be associated with N-H bending and C-N bonds in indole and/or aromatic ring vibrations respectively, according to Table 2.3 [58], [62]. Only a weak decrease of the intensity of a peak at 1600 cm-1 is observable during the evolution in the region between 1550 cm-1 and 1700 cm-1, the spectral signature of carbonyl groups; this suggests that limited oxidation of the monomers is taking place in the samples, even though oxygen was present
in the FTIR chamber. It can be concluded that the supramolecular rearrangement is taking place through noncovalent, H-bonding, interactions which crystalizes the DHI-based samples.
3500 3000 1500 1000 0.0 0.2 0.4 0.6 0.8 1.0 1.2 1.4 Absor ba nce (a .u. ) Wavenumber (cm -1)
"Dry air" first
"Dry air" 3 days 5h "Dry air" 12 days 5h
Figure 3.3: FTIR spectra of “dry air” DHI sample as a function of time. The three spectra refer to the same DHI sample, kept in dry air at all time: first spectrum (45 min after deposition), 3 d and 5 h after deposition, and 12 d and 5 h after deposition. FTIR spectra normalized to the height of the H-stretching band peak, at around 3400 cm-1.
Afterwards, we investigated the effect of moisture in the atmosphere during the FTIR measurements. Throughout the measurements, the “ambient air” sample was exposed to ambient relative humidity (RH), ca. 40 %, but was otherwise formally identical to the “dry air” sample. The spectra were taken every 15 min for the first 3 h and then every 2 h until 21 h after the first spectrum and are presented in Figure 3.4.
3500 3000 1500 1000 0.0 0.2 0.4 0.6 0.8 1.0 1.2 1.4 Absor ba nce (a .u. ) Wavenumber (cm -1)
"Ambient air" initial "Ambient air" 21h30
carbonyls
Figure 3.4: FTIR spectra of a DHI sample in ambient atmosphere, as a function of time, normalized to the height of the H-stretching band peak, around 3400 cm-1.
The widening of the H-stretching band with time shown in Figure 3.4 indicates an increasing disorder in the material. Figure 3.4 also shows that the band splitting observed on the “dry air” sample can still be seen in the spectrum of the sample left in ambient conditions for 21h30 (e.g. 3464, 3432, 3405 cm-1); the previously observed splitting of the 1505 cm-1 peak is also present. The appearance of a stronger carbonyl band, between 1700 and 1550 cm-1 [59]–[61], on the “ambient air” sample suggests an oxidation of the monomer. Carbonyls indeed form after oxidation of the reduced (hydroquinone) and semi-reduced (semi-quinone) forms of the melanin building blocks (Figure 3.5). Interestingly, literature suggests that polymerization of the melanin building blocks proceed through an electron transfer-controlled process subsequent to hydroquinone (catechol)–quinone interactions [36]. Although not a conclusive indication of polymerization, the
observation of carbonyl-related bands suggests that one required step for the polymerization is taking place, and that the presence of water is required for this to happen.
Figure 3.5: DHI and its redox forms, hydroquinone (H2Q, reduced form), semiquinone (SQ, semi-reduced form) and quinone (Q, oxidized form). The quinone imine for (QI) is the tautomer of Q [63].
The last type of sample we investigated was a “AISSP” DHI sample made from the Mustard batch (see section 1.2.1), characterized with FTIR in ambient conditions, right after fabrication and after 2 weeks spent in ambient conditions to compare it with the evolution of the “dry air” sample. Spectra in Figure 3.6 show the advancement of the oxidation (carbonyl formation) with the time spent in ambient conditions, together with no indication of crystalline supramolecular organisation (considering the convoluted shape of the H-stretching region and the lack of band splitting as observed in both Figure 3.3 and Figure 3.4). In the case of AISSP, the polymerization of the sample is faster than the reorganization process, and the lack of reorganization in the “AISSP” sample indicates that the DHI-based samples need to be of monomeric nature to feature this reorganization.
3500 3000 1500 1000 0.0 0.2 0.4 0.6 0.8 1.0 1.2 1.4 carbonyls Absor ba nce (a .u. ) Wavenumber (cm-1) "AISSP" first "AISSP" 2 weeks
Figure 3.6: FTIR spectrum of a DHI AISSP sample after fabrication, and after 2 weeks in ambient conditions, normalized to the height of the H-stretching band peak, around 3400 cm-1.
Figure 3.7 indicates that, for the “AISSP” sample, the initial width of the H-stretching band is wider than for the “dry air” and “ambient air” samples. Indeed, the “dry” and “ambient air” samples showed traces of band splitting, which is not the case with the “AISSP” sample. Such an observation can be explained considering that the AISSP process is not expected to lead to oligomers and polymers with the same supramolecular structure; in agreement with that, the molecular environment of the different DHI-based oligomers and polymers formed is expected to lack any significant degree of crystallinity (described as periodicity in the supramolecular arrangement).
3500 3000 1500 1000 0.0 0.2 0.4 0.6 0.8 1.0 1.2 1.4 Absor ba nce (a .u. ) Wavenumber (cm -1)
"Dry air" first "Ambient air" first "AISSP" first
Figure 3.7: Comparison of the first spectra of each type of sample, normalized to the height of the H-stretching band peak, around 3400 cm-1.
In summary, this evolution of the FTIR spectra tells us that the DHI-based samples feature the evolution of a supramolecular arrangement similar to a crystallization process when significant polymerization is not yet present in a monomeric DHI-based sample. It also appears that the presence of humidity is necessary for the appearance of carbonyls in the sample, which, although doesn’t indicate polymerization, is a critical step towards it.
3.1.2 Observation of the DHI samples by Atomic Force Microscopy
AFM can be used to observe the reorganization process presented in the previous section. DHI-based samples prepared on SiO2/Si substrates by spin-coating feature a uniform and smooth
(roughness of ~1 nm) deposition of DHI when scanned by AFM. Figure 3.8 shows height AFM images of a sample kept in air for 30 min (Figure 3.8a) and 2 h after its fabrication (Figure 3.8b).
30 min-old samples feature aggregation fronts separating smooth portions of the sample, where no aggregation has taken place yet, from portions where the aggregation already took place. As the material gets depleted, the aggregates start to generate branch-like shapes [64]. The appearance, progress and branching of this front was reproducibly observed by AFM on more than 5 samples.
Figure 3.8: 20 µm20 µm height AFM images of a DHI-based sample (batch Tanya) deposited on SiO2/Si with the usual parameters (Table 2.1): a) 30 min-old sample, b) 2 h-old. Samples were kept
in ambient atmosphere (22°C, 30% RH). Smooth brown regions correspond to smooth deposited DHI while textured zones show aggregated DHI.
Figure 3.9: AFM height images taken on a DHI-based sample (batch Tanya) deposited on SiO2/Si
with the usual parameters (Table 2.1). Samples were kept in ambient atmosphere (22°C, 30% RH). Images are 4 minutes apart, on the same spot. Smooth brown regions correspond to smooth deposited DHI while textured zones show aggregated DHI.
Figure 3.9 shows four consecutive height AFM images, each taken 4 min apart in the same spot; the first image being taken about 30 min after sample fabrication and the following images respectively 4, 8 and 12 min later. Figure 3.9 shows the formation of the branch-like structures leading to the structures shown in Figure 3.8b. The shape of these aggregates is likely determined by a diffusion-limited aggregation (DLA) of the DHI monomers, a type of aggregation observed in conditions of limited mass mobility and supply of material, that features dendrimer-like structures.
The appearance, progress and depletion of this aggregation front was reproducibly observed by AFM on more than 5 samples. AFM images taken after prolonged time following fabrication (a few weeks) were hard to be performed and led to inconclusive results. It appears that material gets immobilized on the cantilever while the AFM image is taken, a problem that is not present when taking AFM images shortly after fabrication. This effect suggests that changes happen in the DHI-based material during these few weeks.
3.1.3 Observation of the DHI samples by optical microscopy
Figure 3.10 (a) and (b) shows optical microscopy images obtained from formally identical three days old DHI-based samples (batch Mustard), kept in ambient conditions. Various aggregates (about 100 m-wide) are observable in the optical images and share common boundaries where two adjacent aggregates meet. Such aggregates are characterized by the presence of radial features and branch-like structures surrounded by depleted regions. Optical images such as these can be used to monitor the progress of the aggregation in the DHI-based samples.
Figure 3.10: 500 µm500 µm optical images of formally identical DHI-based samples (batch Mustard) deposited with the usual parameters (Table 2.1), kept in ambient conditions for three days. A few recognizable features are identified: centers of the aggregates (i), common boundaries between two aggregates (j), and branch-like extremities with depleted regions in between (k). Regions where no DHI was deposited during fabrication are also identified (h).
Time lapse videos made using an optical microscope, on a DHI-based sample (batch Mustard) kept in ambient conditions (RH 30 %, 23°C), show that (i) aggregates form, (ii) their sizes increase until when fronts between aggregates meet and (iii) regions of the substrate depleted in organic materials appear. Figure 3.11 shows three critical times of the evolution of the samples. Figure 3.11a was taken 15 min after deposition. At this point, the aggregation front is advancing at about 2.5 µm/min and continues to advance at a constant rate for ca. 30 min (Figure 3.11b), after which the growth rate slows down until no change can be observed with optical microscopy (Figure 3.11c). Afterwards, no clear evolution could be observed by optical microscopy (from here the similarity between Figure 3.14c and Figure 3.14d). For each DHI-based sample on which the aggregates are observed, the evolution of these aggregates follows the same three critical steps i.e. formation (i), growth (ii) and depletion (iii), regardless of the variations observed between samples (e.g. the aggregates shape or size).
Figure 3.11: 1 mm1 mm optical images constituting a time-lapse for a DHI-based sample (batch Mustard) kept in ambient conditions (RH 30 %, 23°C). Time after deposition: a), 15 min, b) 45 min, c) 2 h and d) 2 weeks.
Figure 3.12 shows typical optical images obtained with the three different batches used during this optical microscopy study. Differences in the chemical quality of the monomeric powders (e.g. undesired presence of oligomers) clearly affect the morphology of the samples. The clear blue-grey areas in the figure are not covered by DHI (monomers, oligomers or polymers). The aggregates observable in (a), assuming a circular shape, grow more than 400 µm in diameter. Individual aggregate regions, no more than 150 µm in diameter, are observable in (b) (they are observable in (a)) and feature fibrils. Depleted regions are observable in (c), between aggregates. The aggregates in (c) reach between 150 and 250 µm in diameter and feature a well-defined center and radial structures. These features as well as the general shape of the aggregates are constant for experiments performed with an individual batch in similar conditions i.e. identical substrate and similar temperature and relative humidity. Although a specific batch doesn’t produce better results than another one, this shows that the composition of the synthesized batch influences the growth of the aggregates in a reproductible way and highlights the need for a better control of the synthesis process.
Figure 3.12: 500 µm500 µm optical images of DHI samples (kept during three days in ambient conditions after fabrication) prepared starting from different batches: a) Alessandro, b) Tanya and c) Mustard batch.
Among other things, the morphology of the DHI-based samples as observed by optical microscopy is expected to be affected by the relative humidity (RH) of the atmosphere. The effect of RH is expected to be at least twofold: water could promote the mass mobility of the molecules being a fluid medium, and, at the same time, it could also act as a glue, through intermolecular hydrogen bonding, in this latter case limiting mass transport. The aggregation of the monomers/oligomers/polymers of the DHI-based material, known to be a highly hygroscopic, is influenced by the value of RH [33], [65]. Figure 3.13 shows the structures of three samples placed in three different atmospheres for 24 h (RT, 23 °C): RH=27% (Figure 3.13a), RH=41% (Figure 3.13b) and RH=65% (Figure 3.13c). Observation by optical microscopy right after fabrication of the samples show that DHI is initially present everywhere (not shown). After exposition to humidity during the evolution of the sample, the DHI-based material aggregates in radial structures in some portions of (a) and (b) by depleting the surrounding area from melanin (see the clear halo at the borders of the aggregates), leaving continuous melanin portions elsewhere. In (c), long and curved “arms” are observable, leaving depleted areas in between each “arm”.
Figure 3.13: 500 µm500 µm optical images of 1 day-old DHI-based samples (batch Mustard) kept for 24 h in atmospheres with different RH: a) 27%, b) 41%, and c) 65%.
A DHI-based sample spin-coated on SiO2 (no AISSP) and kept in ambient conditions for 3 days,
for which the initial growth is complete, shows morphological changes after exposure to high relative humidity (near 100 % RH, for one hour) (Figure 3.14). Samples kept in ambient conditions for a few weeks instead of 3 days were unaffected by such exposure to high relative humidity. The effect of humidity, both during and after the initial growth is to be expected since, as stated earlier, the DHI-based material is known to be a highly hygroscopic. The fact that humidity doesn’t influence older samples shows that a certain stabilization takes place in the DHI-based sample over time.
Figure 3.14: 500 µm500 µm optical images of a DHI-based sample (batch Mustard) observed 3 days after deposition, (a) before and (b) after exposure to 100 % RH, for an hour. During the 3 days the sample was kept in ambient conditions.

![Figure 1.2: Various oligomers obtained from the oxidation and polymerization of DHI monomers [37]](https://thumb-eu.123doks.com/thumbv2/123doknet/2324902.30119/20.918.239.663.116.516/figure-various-oligomers-obtained-oxidation-polymerization-dhi-monomers.webp)
![Figure 1.4 : Synthesis of 5,6-dihydroxyindoles (1 and 2, i.e. DHI and DHICA) by the oxidative metabolism of tyrosine and their role in the biosynthesis of eumelanins as it takes place in the human body [44]](https://thumb-eu.123doks.com/thumbv2/123doknet/2324902.30119/21.918.304.624.390.747/figure-synthesis-dihydroxyindoles-oxidative-metabolism-tyrosine-biosynthesis-eumelanins.webp)
![Figure 1.5: a) A simulation of the absorption spectrum of eumelanin according to the chemical disorder model [51], and b) simulations of the − stacking of a few pentamers [52]](https://thumb-eu.123doks.com/thumbv2/123doknet/2324902.30119/23.918.103.829.104.380/simulation-absorption-spectrum-eumelanin-according-chemical-simulations-pentamers.webp)
![Figure 1.6: Schematic illustration of the AISSP procedure for DHI melanin film deposition [32]](https://thumb-eu.123doks.com/thumbv2/123doknet/2324902.30119/24.918.245.675.113.286/figure-schematic-illustration-aissp-procedure-dhi-melanin-deposition.webp)
![Figure 2.1: The UV-ozone cleaning mechanism uses UV light to create activated oxygen to remove molecular organic contaminants from surfaces [56]](https://thumb-eu.123doks.com/thumbv2/123doknet/2324902.30119/28.918.209.713.549.721/figure-cleaning-mechanism-activated-molecular-organic-contaminants-surfaces.webp)
![Figure 2.3: Working principle of an AFM instrument [57].](https://thumb-eu.123doks.com/thumbv2/123doknet/2324902.30119/30.918.277.642.209.499/figure-working-principle-afm-instrument.webp)