10867
Journal of Applied Biosciences 111: 10867-10876
ISSN 1997-5902
Incorporation of stay-green Quantitative Trait Loci
(QTL) in elite sorghum (Sorghum bicolor L. Moench)
variety through marker-assisted selection at early
generation
Nofou Ouedraogo1●, Jacob Sanou1, Vernon Gracen2 andPangirayi Tongoona3
1 Institute of Environment and Agricultural Research (INERA), BP 910 Bobo Dioulasso, Burkina Faso 2 Department of Plant Breeding and Genetics, 520 Bradfield Hall, Cornell University, Ithaca, NY 14850, USA 3West Africa Centre for Crop Improvement (WACCI), University of Ghana, BMP 30, Legon, Accra, Ghana ●Corresponding author Email addresses: [email protected]/ [email protected]
Original submitted in on 12th December 2016. Published online at www.m.elewa.orgon 31st March 2017
http://dx.doi.org/104314/jab.v111i1.3 ABSTRACT
Incorporation of stay-green Quantitative Trait Loci (QTL) in elite sorghum (Sorghum bicolor L. Moench) variety through marker-assisted selection at early generation.
Objective: The present investigation was undertaken to develop drought tolerant varieties through introgression of stay-green QTLs in order to improve sorghum yield in semi-arid areas of Burkina Faso.
Methodology and Result: Marker-assisted selection was carried out to introgress stay-green QTLs into elite sorghum variety. A stay-green donor source, BTx642 (B35), was crossed to the elite variety (Sariaso09) to obtain F1 progenies that were backcrossed to their recurrent parents to obtain the BC1F1 progenies. Seventeen flanking Simple Sequence Repeat (SSRs) polymorphic markers were used for foreground selection and 18 were used for background selection. Eighteen BC1F1 were heterozygous at all target loci for stay-green (stg1, stg2, stg3, stg4 and stgB), 5 progenies (S9B37, S9B43, S9B46 S9B85 and S9B13) had incorporated 3 of these QTLs. 4 plants (S9B34, S9B38, S9B73 and S9B16) incorporated double QTLs (Stg3 and StgB) and three plants (S9B44, S9B48 and S9B20) were heterozygous for Stg1.
Conclusions and applications of findings: Among BC1F1 generation, 30 progenies had incorporated at least one stay-green QTL. Two of the introgression lines had high levels of the recurrent parents’ genomes and constitute some promising lines to develop drought tolerant varieties that will ensure sorghum production in semi-arid tropics areas and therefore, contribute to ensure food security in Burkina Faso. Despite the small number of genotypes obtained, the results showed the efficiency of Marker Assisted Back Crossing (MABC) versus the conventional backcross procedure.
10868 INTRODUCTION
Sorghum is the fifth most important cereal crop grown after wheat, maize, rice and barely (FAOSTAT, 2014). In Burkina Faso, sorghum is the main cultivated crop and constitutes the staple diet for the rural population. It is cultivated only under rain-fed conditions and over all the different climatic zones. Around 3.9 million hectares of sorghum are grown during the rainy season and about 5.6 million metric tons of sorghum grain is harvested (MASA/DGESS, 2014). In semi-arid tropics, the rainfall is very low with an erratic distribution (Zougmoré, 2003) and, therefore, crop production is regularly exposed to drought that considerably reduces yield. Drought is the main abiotic constraint to crop cultivation worldwide and the major source of yield instability and food shortage (Abdalla and Gamar, 2011). Sorghum is mainly susceptible to terminal drought stress that can reduce grain yields more than 50% (FAO, 2011). During this stage, drought causes premature leaf senescence leading to stalk lodging and stalk rot disease. It also leads to barrenness, kernel abortion or shrivelled grain, which has a negative impact on the grain yield (Prasad et al, 2008). However, some genotypes have the ability to cope with post-flowering drought stress due to the mechanism of stay-green. These genotypes maintain longer leaf greenness, resist precocious plant death, have normal grain filling during post-flowering drought (Tenkouano et al, 1993) and are recognized as stay-green genotypes. The stay-green trait has been characterized in limited number of genotypes such as BTx642 (B35), ET36-1, M35, SC56 and
K19. The most common source of stay-green trait used has been BTx642. Using different stay-green sources, considerable research has been undertaken to investigate suitable molecular markers linked to post-flowering drought resistance loci, and numerous stay-green QTLs have been mapped (Subudhi et al., 2011; Sanchez et al., 2002; Harris et al., 2007 and Kassahun et al., 2009). Molecular markers linked to these QTLs are available (Harris et al., 2007 and Kassahun et al., 2009). The post-flowering drought studies identified four major stay green QTLs labelled as Stg1, Stg2, Stg3 and Stg4 which were consistently identified in a range of different environments and in different genetic backgrounds (Subudhi et al., 2000). Some minor QTLs for stay-green were also identified as StgA and StgB. Stg1 and Stg2 were mapped to sorghum chromosome 3, and are responsible for the phenotypic variation of about 20 and 30% (Sanchez et al., 2002; Harris et al., 2007). Stg3 and Stg4 were mapped on chromosomes 2 and 5 and explain respectively 16 and 10% of the phenotypic variation (Sanchez et al., 2002; Harris et al., 2007). After incorporation into different genetic backgrounds, a positive effect of stay-green QTLs on grain yield under drought stress has been reported (Bonnett et al., 2005 and Kassahun et al., 2009). In this study, QTLs of stay-green were introgressed into elite variety (Sariaso09) in Burkina Faso to improve its ability to cope with terminal drought through Marker-Assisted Backcross methodology.
MATERIALS AND METHODS
Plants materials : The parental lines (varieties) used in this study were BTx642 (donor parent), formerly named B35, a low yielding BC1 derivative of durra sorghum
germplasm accession IS 12555, post-flowering drought tolerant from Ethiopia and an elite local improved variety, Sariaso09, guinea race and post-flowering drought susceptible was used as recurrent parents.
Methodology
Backcrosses generation: A recurrent parent (Sariaso09) and B35 were sown in a breeding nursery at the research centre of the Institute of Environment and Agricultural Research (INERA)/Farako-Bâ in February 2014 to develop the F1 generation. The F1 plantswere then sown
along with the recurrent parent (Sariaso09) in July 2014. At flowering, the recurrent parent was hand emasculated and artificial pollinations were done with the pollen of their respective F1 plants to obtain the BC1F1 generation. A
total of 107 BC1F1 progenies were generated and
genotyping was done using CERAAS genotyping platform in 2015.
Samples collection and DNA extraction: The BC1F1
progenies were sown and leaf samples were collected from three weeks old plants and dried in an oven at 40°C for three days. After drying leaf, samples were ground using a Geno-grinder (RETSCH) at 500 strokes per minute for 9 minutes (3 times, 3 minutes each) and then
10869 DNA extraction was conducted according to the Mixed Alkyl Trimethyl Ammonium Bromide (MATAB) procedure described by Frost et al. (2007). Determination of the quality and purity of the isolated DNA were done using agarose gels (0.8%) and the working concentration of about 5ng per µl was obtained from dilution of initial DNA solution.
Polymerase chain reaction (PCR) and polyacrylamide gel electrophoresis: PCR was performed in a 10 µl reaction volume containing 25ng of genomic DNA template, 0.1mM of dNTPs, 1x buffer, 200µM of MgCl2,
0.1µM of both forward and reverse primers, 0.1µM of IRdye, 0.1U of ampliTaq polymerase enzyme and double distilled water. The PCR were realized in 35 cycles using a thermal cycler (MWG AG Biotech). Thermal cycler was programmed as followed: a denaturation at 94°C for 4 min, followed by 10 cycling composed of 45s of denaturation at 94°C and annealing at TM-5°C with a reduction of 0.5°C/cycle for 1min and extension at 72°C for 1min15s. The process was repeated in 25 cycles. Each cycle included a chain of denaturation (94°C during 45s) and, annealing (at TM- 5°C for 1min) and then an
extension (at 72°C for 1min15s). Finally, the reaction was ended by 5 min extension at 72°C. PCR products were subjected to electrophoresis in 6.5% polyacrylamide gels with a licor 4300 DNA Analyser system. Electrophoresis was carried out using 20 ml of polyacrylamide 6.5% polyacrylamide, 200ml 10X TBE diluted to 1L, 175 µl ammonium per sulphate (APS), and 25µl TEMED). The gel was run at 1500V and 35mA constant power supply, for 2 hours using a licor 4300 DNA analyser unit. Data analysis: For polymorphism assessment within parents, the bands on the gel were coded as ‘‘a’’, ‘‘b’’, ‘‘c’’, ‘‘d’’ and ‘‘e’’ based on their allele band size (position) compared with that of the donor parent allele. For BC1F1
progenies, the bands were coded as ‘‘a’’, ‘‘b’’ and ‘‘h’’ according to their pattern compared to those of the parents. The code ‘‘a’’ indicated homozygous plant for allele from non stay-green parent (Sariaso09). Code ‘‘b’’ indicated homozygogous plant for allele from donor parent (B35) and code ‘‘h’’ indicated heterozygote plant with both parental allele for marker loci. The missing data were scored as ‘‘x’’.
RESULTS
Polymorphism assessment : The genotypes displayed a common allele at several loci. However, 35 loci out of 74 SSRs markers showed polymorphism among the parents. From 33 markers used for the screening in the QTL regions, 17 polymorphic markers were retained and
from 41 markers in non-target regions of the genome, 18 polymorphic markers were retained for background selection. The list of polymorphic markers is presented in table 1 and the figure 1 illustrates the screening for polymorphism.
Figure 1: Illustrations of polymorphism assessment among donor and recurrent parents with 7 SSRs markers. Legends: Lanes 1 to 5 are B35, kapelga, Grinkan, Sariaso01 and Sariaso09 respectively.
10870
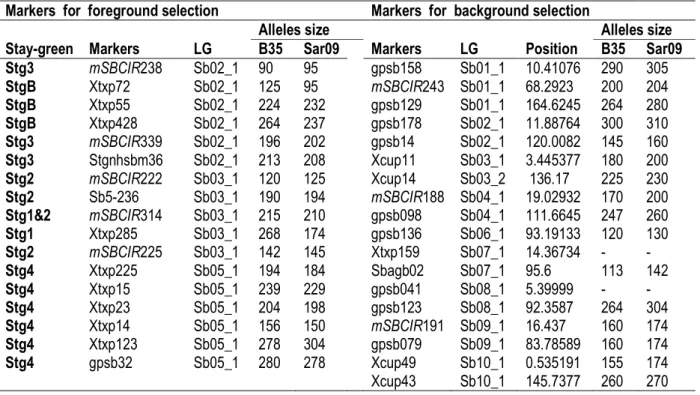
Table 1: SSR markers (for foreground and background selection) retained after polymorphism assessment within B35 and Sarisao09
Markers for foreground selection Markers for background selection Stay-green Markers LG
Alleles size Alleles size
B35 Sar09 Markers LG Position B35 Sar09
Stg3 mSBCIR238 Sb02_1 90 95 gpsb158 Sb01_1 10.41076 290 305 StgB Xtxp72 Sb02_1 125 95 mSBCIR243 Sb01_1 68.2923 200 204 StgB Xtxp55 Sb02_1 224 232 gpsb129 Sb01_1 164.6245 264 280 StgB Xtxp428 Sb02_1 264 237 gpsb178 Sb02_1 11.88764 300 310 Stg3 mSBCIR339 Sb02_1 196 202 gpsb14 Sb02_1 120.0082 145 160 Stg3 Stgnhsbm36 Sb02_1 213 208 Xcup11 Sb03_1 3.445377 180 200 Stg2 mSBCIR222 Sb03_1 120 125 Xcup14 Sb03_2 136.17 225 230 Stg2 Sb5-236 Sb03_1 190 194 mSBCIR188 Sb04_1 19.02932 170 200 Stg1&2 mSBCIR314 Sb03_1 215 210 gpsb098 Sb04_1 111.6645 247 260 Stg1 Xtxp285 Sb03_1 268 174 gpsb136 Sb06_1 93.19133 120 130 Stg2 mSBCIR225 Sb03_1 142 145 Xtxp159 Sb07_1 14.36734 - - Stg4 Xtxp225 Sb05_1 194 184 Sbagb02 Sb07_1 95.6 113 142 Stg4 Xtxp15 Sb05_1 239 229 gpsb041 Sb08_1 5.39999 - - Stg4 Xtxp23 Sb05_1 204 198 gpsb123 Sb08_1 92.3587 264 304 Stg4 Xtxp14 Sb05_1 156 150 mSBCIR191 Sb09_1 16.437 160 174 Stg4 Xtxp123 Sb05_1 278 304 gpsb079 Sb09_1 83.78589 160 174 Stg4 gpsb32 Sb05_1 280 278 Xcup49 Sb10_1 0.535191 155 174 Xcup43 Sb10_1 145.7377 260 270 Marker-Assisted Introgression of Stay-green QTLs:
Foreground selection was focused on five consistent stay-green QTLs (Stg1, Stg2, Stg3, Stg4 and StgB) located on three linkage groups (SB02-1 on LG2, SB03-1 on LG3 and SB05-1on LG 5) and 17 SSRs flanking markers were used. Out of 107 backcross progenies, 30 had incorporated at least one QTL from the donor parent (B35). Eighteen progenies derived from Sariaso09 (S9B1, S9B40, S9B52, S9B68, S9B74,S9B88, S9B39, S9B50, S9B51, S9B7, S9B66, S9B67, S9B18, S9B65, S9B91, S9B24, S9B97 and S9B107) were heterozygous at all targeted marker loci and had incorporated the five target
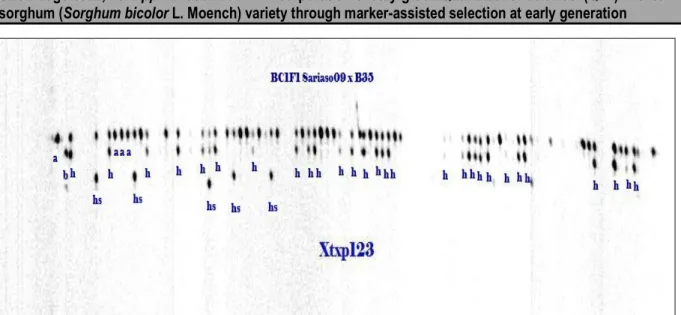
QTLs (Stg1, Stg2, Stg3, Stg4 and StgB). Five progenies (S9B37, S9B43, S9B46 S9B85 and S9B13) had incorporated 3 of these QTLs. Four plants (S9B34, S9B38, S9B73 and S9B16) incorporated double QTLs (Stg3 and StgB) and three plants (S9B44, S9B48 and S9B20) were heterozygous for Stg1. Examples illustrating the genotyping screening for foreground selection of backcross progenies are presented in Tables 2 and 3 and heterozygous individuals with the donor and the recurrent parent alleles of the marker Xtxp123 are shown in the Figure 2.
10871
Figure 2: Output showing heterozygous individuals with the donor and the recurrent parent alleles of the marker Xtxp123. Legends: a= allele of Sariaso09, b=allele of B35, h=heterozygote, hs= off type.
Marker-Assisted background selection: Progenies with 5, 3, 2 or 1 stay-green QTLs also incorporated a part of the non-target regions of the donor parent (B35) chromosome. Background genotyping was used to determine the recovery rate of the recurrent parent genome of BC1F1 progenies having incorporated 5, 3, 2 or
1 stay-green QTL. Eighteen markers (two in each linkage group) were used. One marker was located at or near the one end and the other was located at or near the other
end of each linkage group. Among the BC1F1 progenies,
28 (S9B1, S9B40, S9B52, S9B68, S9B74, S9B88, S9B39, S9B50, S9B51, S9B7, S9B66, S9B67, S9B18, S9B65, S9B91, S9B24, S9B97, S9B107, S9B37, S9B43, S9B46 S9B85, S9B13, S9B34, S9B38 S9B16, S9B44 and S9B20) descendants from Sariaso09 had a low recovery rate (below 75%). Two progenies (S9B73 and S9B48) had recovery rates between 75-83%. The results are presented in Tables 4.
Table 4: Background screening of BC1F1 progenies
Sample Name No. of Heterozygous loci No. of RcP loci % of RcP loci
S9B1 9 9 50 S9B7 9 9 50 S9B16 9 9 50 S9B17 9 9 50 S9B18 9 9 50 S9B24 8 10 56 S9B34 10 8 44 S9B37 8 10 56 S9B38 8 10 56 S9B39 9 9 50 S9B40 9 9 50 S9B41 8 10 56 S9B43 7 11 61 S9B44 8 10 56 S9B46 9 9 50 S9B48 4 14 78 S9B50 7 11 61 S9B51 10 8 44 S9B52 8 10 56 S9B64 7 11 61
10872 S9B65 8 10 56 S9B66 7 11 61 S9B67 10 8 44 S9B68 11 7 38 S9B73 3 15 83 S9B74 9 9 50 S9B85 10 8 44 S9B88 10 8 44 S9B91 9 9 50 S9B96 9 9 50 S9B97 8 10 56 S9B107 7 11 61 RcP: Recurrent parent DISCUSSION
The allelic pattern indicated that there were at least two alleles per locus and the presence of common alleles in several loci meant that donor and recurrent parents’ genomes did not exhibit polymorphism at these precise loci. However, the polymorphism revealed at 35 loci indicated dissimilarity between genotypes and exhibited the presence of genetic distance that is important for QTLs introgression. According to Langridge et al. (2001), useful markers in breeding should reveal polymorphism in different populations derived from a wide range of different parental genotypes. Foreground selection was conducted to identify the B35 marker allele (s) at the target loci in the heterozygous state in the progenies until the backcross procedure was completed. The number of progenies was low but the majority had incorporated the target QTLs from the donor parent. Only a few did not carry chromosomal regions with stay-green QTLs at the BC1 generation. Ngugi et al. (2010) reported that 22
genotypes in BC1F1 were enough to capture one QTL with
about 95% confidence. Results from this study revealed rates beyond the expected and beyond that obtained by Ngugi et al. (2010). Supposedly, all the QTLs contributing to a trait of interest (stay-green) could be taken into account (Collard et al., 2005), but, concerning MAS for multiple genes or QTLs, it was suggested to limit the number of genes in a selection procedure to three or four when the QTLs selected are on the basis of linked markers, and five to six if they are known select loci directly (Hospital, 2003). Ribaut and Bertrand (1999) reported that three QTLs are appropriate and feasible for MAS, although, Lecomte et al. (2004) used five QTLs in the improvement of fruit quality traits in tomato via marker-assisted introgression. Kassahun et al. (2009) used B35 as the donor parent and found backcross families that carried four putative stay-green (Stg1, Stg3, Stg4 and StgB) QTLs in the BC2F1 generation. Ngugi et
al. (2010) used another donor parent (E36-1) and identified at BC2F1 generation, individuals with double and
single introgression of stay-green QTL (Stg1 and or Stg2). In this study, emphasis is given to progenies that have the major QTLs (Stg1, Stg2 and Stg3). Previous studies have revealed that Stg1 and Stg2 incorporated in different genetic backgrounds (Subudhi et al., 2000) were able to explain about 20 and 30% of the phenotypic variance respectively (Sanchez et al., 2002; Harris et al., 2003). Stg1 and Stg2 interactions resulted in explanation of 49.8% phenotypic variation (Subudhi et al., 2000). Stg3 and Stg4 accounted for 16% and 10% of the phenotypic variation, respectively (Sanchez et al., 2002). The majority of BC1F1 progenies had a recovery rate of the
recurrent parent genome below 75%. Only a few had adequately recovered the recurrent parents’ genome (75-83%). Plants carrying single or double QTLs had incorporated less of the donor parent genome compared to progenies with more QTLs (five). This reduces the chance to identify plants carrying all donor alleles with high background genomes of the recurrent parent. This limits the number of progenies to be selected in the next generation. Sebolt et al. (2000) reported that the rate of success decreases when large numbers of QTLs are selected. According to Newbury (2000), if many QTLs are incorporated, the proportion of undesirable genes will be larger due to linkage drag. Bonnett et al. (2005) reported that efficient implementation of MAS involves several issues, e.g. breeding systems or schemes, population sizes, number of target loci. Their strategies include F2
enrichment, backcrossing and inbreeding. In case of conventional selection, breeders need a larger number of individuals at each backcross generation to be sure that there are sufficient plants for background selection after the foreground and recombinant selection has been performed. This procedure requires the evaluation of the
10873 material at each generation to select those progeny carrying the target QTLs or gene and, therefore, it is time
consuming whereas MAS requires fewer generations.
CONCLUSION
The screening allowed the selection of 40 BC1F1
progenies from Sariaso09 with at least one QTL of stay-green. Eighteen progenies incorporated all five QTLs of stay-green (Stg1, Stg2, Stg3, Stg4 and StgB). Seven plants have incorporated two QTLs of the stay-green and 15 have single QTL for stay-green. The use of
background markers allowed the identification of BC1F1
with high proportion (75 to 83%) of the recurrent parents’ genomes. The introgression of these QTLs into local elite variety is an important step to obtain promising lines with ability to withstand terminal drought and surely to ensure food security in rural drone prone areas.
ACKNOWLEDGEMENTS
The authors would like to thank, West Africa Centre for Crop Improvement (WACCI) for the breeding training program, the Alliance for Green Revolution in Africa (AGRA) for the award of the grant to conduct the
research, ICRISAT for provision of sorghum germplasm and list of SSRs flanking markers, CERAAS genotyping platform for the genotyping service and INERA for the breeding nursery.
REFERENCES
Abdalla HM and Gamar YA, 2011. Climate change: Selection of sorghum genotype with wide adaptation, AG-17, for rain-fed areas of Sudan. International Journal of AgriScience 3: 144-555. Bonnett DG, Rebetzke GJ, Spielmeyer W, 2005. Strategies for Efficient Implementation of Molecular Markers in Wheat Breeding. Mol. Breeding 15:75-85.
Collard BCY, Jahufer ZZM, Brouwer JB, Pang RCE, 2005. An introduction to markers, quantitative trait loci (QTL) mapping, and marker-assisted selection for crop improvement: The basic concepts. Euphytica 142:169-196.
FAO: FAO Quart. Bull. Statis 1999. 12 (1/2):33. FAOSTAT: FAO Statistics Data base 2014,
http://www.faostat.fao.org.
Frost R, Xi Y, He H, 2007. Modification of the surfaces of Wyoming montmorillonite by the cationic surfactants alkyl trimethyl, dialkyl dimethyl and trialkyl methyl ammonium bromides. Journal of Colloid and Interface Science 305 (1): 150-158. Hospital F, 2003. Marker-assisted breeding. In Plant molecular breeding: 2003, edited by Newbury HJ: Blackwell Publishing, CRC Press, Birmingham, UK 30-56.
Harris K, Subudi PK, Borrell A, Jordan D, Roseonw D, Nguyen H, klein R, Klein P, Mullet J, 2007. Sorghum stay-green QTL individually reduce post-flowering drought-induced leaf senescence. Journal of Exp Bot 58 (2): 327:38.
Kassahun BB, Bidinger RF, Hash TC, Kuruvinashetti SM, 2009. Stay-green expression in early generation
sorghum [Sorghum bicolor (L.) Moench] QTL introgression lines. Euphytica 172:351-362. Langridge P, Lagudah ES, Holton TA, Appels R, Sharp
PJ Chalmers KJ, 2001. Trends in genetic and genome analyses in wheat. Australian Journal of Agricultural Research 52: 1043-1077.
Lecomte L, Duffe P, Buret M, Servin B, Hospital F, Causse M, 2004. Marker-Assisted Introgression of Five QTLs Controlling Fruit Quality Traits Into Three Tomato Lines Revealed Interactions Between QTLs and Genetic Backgrounds. Theoretical and Applied Genetics 109: 658-668. MASA/DGESS, 2014. Résultats définitifs de la campagne agricole et de la situation alimentaire et nutritionnelle 2013/2014. Rapport annuel. Ouagadougou, Burkina Faso.43P.
Newbury HJ, 2003. Plant molecular breeding. Blackwell Publishing, CRC Press, Birminghan, UK 30-56. Ngugi k, Kimani W, Kiambi D, 2010. Introgression of
stay-green trait into a Kenyan farmer prefered sorghum variety. African Crop Science Journal 18 (3): 141-146.
Prasad PVV, Pisipati SR, Mutava RN, Tuinstra R, 2008. Sensitivity of grain sorghum to high temperature stress during reproductive development. Crop Sci 48: 1911–1917.
Ribaut JM, Betran J, 1999. Single large-scale marker-assisted selection (SLS-MAS). Mol. Breed 5: 531-541.
Sanchez AS, Subudi PK, Rosenow DT, Nguyen HT, 2002. Mapping QTLs associated with drought resistance in sorghum (Sorghum bicolor L. Moench). Plant Mol Biol 48 (5-6): 713-726.
10874 Sebolt AM, Shoemaker RC, Diers BW, 2000. Analysis of
a quantitative trait locus allele from wild soybean that increases seed protein concentration in soybean. Crop Sci 40: 1438-1444.
Subudhi PK, Rosenow DT, Nguyen HT, 2000. Quantitative trait loci for the stay green trait in sorghum (Sorghum bicolor L. Moench): consistency across genetic backgrounds and environments. Theoretical and Applied Genetics 101:733-741.
Tenkouano A, Miller FR, Frederiksen RA, Rosenow DT, 1993. Genetics of non-senescence and charcoal rot resistance in sorghum. Theoretical and Applied Genetics 85:644-648.
Zougmoré R, 2003. Integrated water and nutrient management for sorghum production in semi-arid Burkina. Tropical resources management papers no 45, Wageningen University and Research center, Wageningen, the Netherlands. 205 pp.
10875
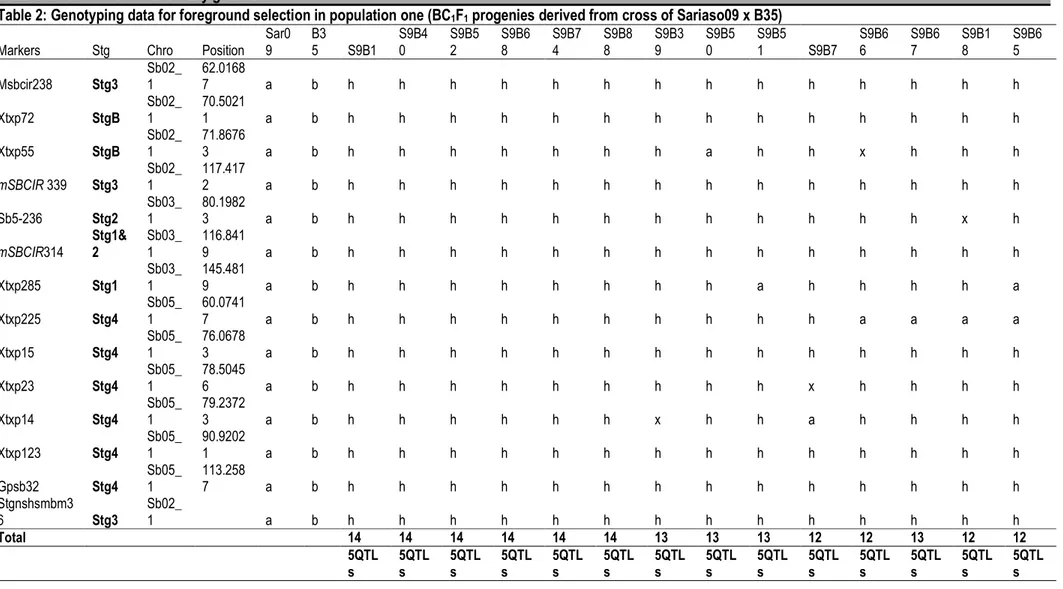
Table 2: Genotyping data for foreground selection in population one (BC1F1 progenies derived from cross of Sariaso09 x B35)
Markers Stg Chro Position Sar0 9 B3 5 S9B1 S9B4 0 S9B5 2 S9B6 8 S9B7 4 S9B8 8 S9B3 9 S9B5 0 S9B5 1 S9B7 S9B6 6 S9B6 7 S9B1 8 S9B6 5 Msbcir238 Stg3 Sb02_ 1 62.0168 7 a b h h h h h h h h h h h h h h Xtxp72 StgB Sb02_ 1 70.5021 1 a b h h h h h h h h h h h h h h Xtxp55 StgB Sb02_ 1 71.8676 3 a b h h h h h h h a h h x h h h mSBCIR 339 Stg3 Sb02_ 1 117.417 2 a b h h h h h h h h h h h h h h Sb5-236 Stg2 Sb03_ 1 80.1982 3 a b h h h h h h h h h h h h x h mSBCIR314 Stg1& 2 Sb03_ 1 116.841 9 a b h h h h h h h h h h h h h h Xtxp285 Stg1 Sb03_ 1 145.481 9 a b h h h h h h h h a h h h h a Xtxp225 Stg4 Sb05_ 1 60.0741 7 a b h h h h h h h h h h a a a a Xtxp15 Stg4 Sb05_ 1 76.0678 3 a b h h h h h h h h h h h h h h Xtxp23 Stg4 Sb05_ 1 78.5045 6 a b h h h h h h h h h x h h h h Xtxp14 Stg4 Sb05_ 1 79.2372 3 a b h h h h h h x h h a h h h h Xtxp123 Stg4 Sb05_ 1 90.9202 1 a b h h h h h h h h h h h h h h Gpsb32 Stg4 Sb05_ 1 113.258 7 a b h h h h h h h h h h h h h h Stgnshsmbm3 6 Stg3 Sb02_ 1 a b h h h h h h h h h h h h h h Total 14 14 14 14 14 14 13 13 13 12 12 13 12 12 5QTL s 5QTL s 5QTL s 5QTL s 5QTL s 5QTL s 5QTL s 5QTL s 5QTL s 5QTL s 5QTL s 5QTL s 5QTL s 5QTL s
10876
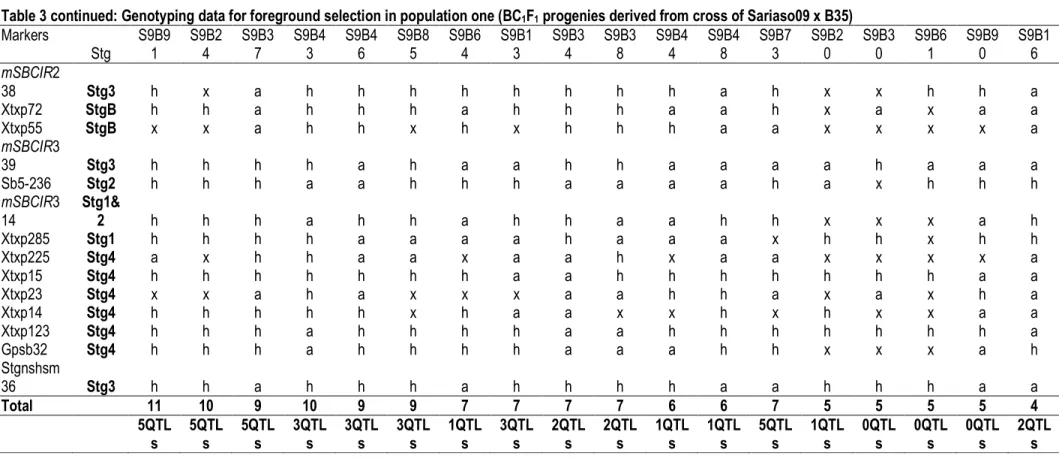
Table 3 continued: Genotyping data for foreground selection in population one (BC1F1 progenies derived from cross of Sariaso09 x B35) Markers Stg S9B9 1 S9B2 4 S9B3 7 S9B4 3 S9B4 6 S9B8 5 S9B6 4 S9B1 3 S9B3 4 S9B3 8 S9B4 4 S9B4 8 S9B7 3 S9B2 0 S9B3 0 S9B6 1 S9B9 0 S9B1 6 mSBCIR2 38 Stg3 h x a h h h h h h h h a h x x h h a Xtxp72 StgB h h a h h h a h h h a a h x a x a a Xtxp55 StgB x x a h h x h x h h h a a x x x x a mSBCIR3 39 Stg3 h h h h a h a a h h a a a a h a a a Sb5-236 Stg2 h h h a a h h h a a a a h a x h h h mSBCIR3 14 Stg1& 2 h h h a h h a h h a a h h x x x a h Xtxp285 Stg1 h h h h a a a a h a a a x h h x h h Xtxp225 Stg4 a x h h a a x a a h x a a x x x x a Xtxp15 Stg4 h h h h h h h a a h h h h h h h a a Xtxp23 Stg4 x x a h a x x x a a h h a x a x h a Xtxp14 Stg4 h h h h h x h a a x x h x h x x a a Xtxp123 Stg4 h h h a h h h h a a h h h h h h h a Gpsb32 Stg4 h h h a h h h h a a a h h x x x a h Stgnshsm 36 Stg3 h h a h h h a h h h h a a h h h a a Total 11 10 9 10 9 9 7 7 7 7 6 6 7 5 5 5 5 4 5QTL s 5QTL s 5QTL s 3QTL s 3QTL s 3QTL s 1QTL s 3QTL s 2QTL s 2QTL s 1QTL s 1QTL s 5QTL s 1QTL s 0QTL s 0QTL s 0QTL s 2QTL s