Active bond strategies: What link between forecasting ability, excess return and
performance?
Keywords: international portfolio management, bond management, active strategy, performance
Hubert de La Bruslerie Professor of finance
CREFIB University Paris I Sorbonne 17, rue de la Sorbonne
75231 Paris Cedex 05 (France) [email protected]
Active bond strategies: What link between forecasting ability, excess return and performance?
Summary
The active management of a portfolio should not be appreciated only in term of excess profitability vis-à-vis a reference benchmark. It takes place in a complete process where upstream a manager's superior expertise is supposed to exist. That skill is analyzed as a forecasting ability and appears by choices of asset allocation corresponding to the manager's anticipations. The article wants to analyze the tie between forecasting ability and excess performance in an active management. It limits itself to the bond portfolio management, but takes in account the international dimension. Two types of asset allocation decisions are hereafter considered: the choice of the maturity and the choice of the markets in an environment with four currencies: the dollar, the euro, the pound sterling and the yen. A simulation on the period 1998-2001 will show if it exists a link between forecasting ability and the expectation of excess return. The opening to the international dimension shows a superior potential of gain compared to a domestic active management. However the comparison with a set of a priori useful information doesn't enable to transform this potential in a real excess gain in performance. The bond portfolio management in an international context introduces a strong complexity with regard to a domestic active management. The risks of errors of forecasting are increased in a dynamic allocation between markets. The operational conclusion of the paper is to underline the interest of an international active bond management but restricted to constant market weights.
An active strategy in bond portfolio management expresses itself by choices of asset allocation that don't respect the structure of the reference index or that of the benchmark portfolio. The literature often uses the term of tactical asset allocation (TAA). The main decisions of allocation deal with the maturity, the international market or the sector choices. The individual asset decisions are not considered below; they are devoted to stock-picking choices.
The first question laid by the active management of bond portfolio is its forecasted performance. Is an active allocation of bond positions paid of a sufficient performance addition? The immediately done comparison is the calculation of the excess return in relation to the one of a passive strategy that would consist in following an index of reference or a benchmark portfolio. One knows that the excess return, even a positive one, is not in itself sufficient information. It is necessary, on a long period, to complete it by an analysis of the stability of the performance of an active manager in relation with the return of the benchmark index. The tracking error (TE) is measured by the standard deviation of the difference in return between the managed portfolio and the benchmark. With regard to the active portfolio management, the performance indicator is classically the information ratio (IR), which is an efficiency measure between the gain of return and the risk of deviation in relation to the “benchmark”. An information ratio greatly positive founds the superiority of an active management in relation to a passive management.
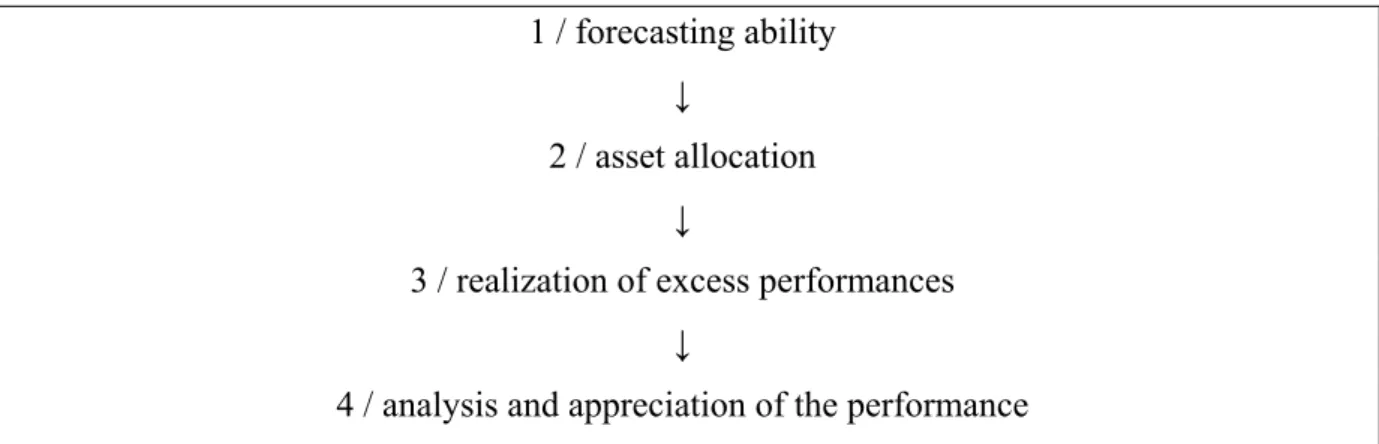
However, the analysis of an active management set only on these indicators privileges the downstream of an active management, that is to say the final results. To go to the origin of the performance gain, it is necessary to go back upstream on the specific expertise of the active bond manager. This expertise expresses itself in term of capacity to forecast the market and its evolution. The raw material of an active management is the forecasting ability, good or bad, real or supposed, of the decision-maker who allocates his positions in portfolio in different ways from the one of the reference index. The global performance of an active bond manager finds its origin in a whole process:
INSERT TABLE 1
This process takes place on a horizon of time of a certain length that gives a temporal depth, for example 1 month or 3 months.
The purpose of this research is to value the consistency of the active management process upstream in the manager's behavior. We wonder about his capacity to transform a forecasting ability on a given horizon into a positive ex post performance. It limits itself to the first 3 stages of the process in table 1. The methodology will follow the one proposed by Fjelstad (1999) who analyzed the efficiency of allocation decisions from choices of maturity and choices of sector rotation in the bond market in euroi. By opposition to this research and to the others that have been done in a domestic setting, we will consider an international setting. The choice of the currency bond market is of first importance in a global and open international management. The asset allocation is characterized at a given time by two positions in the dimension of the maturities and of the currencies. The same analysis as the one developed within Franck Russel Co, based on the simulations of active strategies and the empirical test of performance of a so-called “informed” strategy, will be followed here after.
In a first part we will present a review of the literature; the second part will detail the methodology. The third part will present the simulated performances of active strategies. Finally, the last part will verify "upstream", on the basis of information revealing an ex ante superior forecasting ability, if a clear link exists, downstream, with an improvement in bond performance.
I – Review of the literature
The analysis of the ex post results of active bond management has been often made from the performances of different mutual investment funds. The traditional measures of performance based on return or measures adapted to the risk have been used to verify if active managers beat or not the market; other studies tried to verify if there were persistence through time of the performances of some bond managers. Blake, Elton and Gruber (1993) calculated and put on evidence the under-performance of American bond mutual funds. Kahn and Rudd (1995) estimated the performance of 300 bond funds. They concluded to identical results.
Maag and Zimmermann (2000) analyzed the performances of 40 German mutual bond funds. There again an under-performance in relation to one or several indexes of reference is noticed by these authors. The gap of performance seems to correspond roughly to the costs and expenses supported by the funds. Other studies aimed to verify if persistence in the performances can be revealed. Kahn and Rudd (1995) identified such a persistence in clean net returns, meanwhile Magg and Zimmermann (2000) are led to opposite conclusions in the German bond market.
Others studies consist in going back up in the analysis of the performance while analyzing closer the styles of management. The Sharpe (1992)’s article proposed a model to decompose the performance of stock funds managers according to their allocation in “value”, “growth” or “small caps”. The analysis of bond performance obviously doesn't refer to the same typology. Dynkin and Hyman (1986) proposed to decompose the performance achieved according to several components:
- the changes of interest rate, - the variations in volatility, - the variations of sector spreads.
Brown and Marshall (2001), for instance, simulated this decomposition to identify the styles in bond management.
The analysis of the performance consecutive to an active asset allocation dynamic ("tactical asset allowance or TAA ") leads to models of simulation of which one of the essential parameters are the level of information and the skill of the manager. One of the first, Fox (1998) simulated the manager's behavior while adding to the forecasting ability, the notion of size of the bets of positions in gap of the benchmark index. Fjelstad (1999) applies this to analyze an active bond management within the euro denominated bond markets during the year 1998. She finds that a forecasting ability of 55% results favorably in an excess return of 6 basis points (bp) for sector rotation bets and 30 bp for bets of duration.
II - Methodology
The methodology aims to establish, or no, a correspondence between the forecasting ability with regard to the evolution of interest rates and the realization of an excess performance. This implies the definition of benchmarks. This analysis will first be done at the domestic level within the four bond markets denominated in dollar, in euro, in pound sterling and in Japanese yen. We will limit ourselves to the default free domestic markets represented by the government bonds. The decisions of sector allocation are not taken in account. The main reason is that the choices between issues of the governments, or state-controlled agencies, or corporate bonds, or mortgage backed securities, has a sense in the American domestic bond market where these sectors distribute themselves in a roughly balanced mannerii. This is not the case in the domestic markets of euro, British pound or yen bonds where the corporate sector is often young and sometimes narrowiii. We will therefore privilege the maturity dimension in the domestic bond management choices; that is to say the one aiming to actively profile the sensitivity of the portfolio in relation to the average sensitivity of the domestic market.
In an internationally opened bond management, on the other hand, two strategic decisions are the ground of the performance:
- the choice of the maturity,
- the choice of the currency bond market.
The first choice is classic and relief of the traditional domestic bond management. It consists in lengthening the sensitivity of the portfolio or on the contrary to reduce it according to anticipation of the rates. An offensive or defensive position is decided in relation to the duration of the benchmark. The manager who anticipates a decrease of rate will keep a higher sensitivity than the one of the reference portfolio.
The second decision drives to overweight (or underweight) some currency bond markets corresponding to anticipations of relative over-performance (or under-performance) of the market in relation to the general average. The choice is then made more complicated by the presence of many currencies which are at the origin of an exchange risk that combines itself to risky positions in interest rate. In what follows, we will only consider international bond positions covered with the exchange risk. The local returns are supposed "hedged" since
we want to analyze the manager's forecasting ability in the dimension of the interest rates set in an international context. The choice of the different international markets in a configuration without exchange risk is quite close to the sector allocation decision that exists in a domestic bond market. This type of approach is usually followed by domestic managers switching between government and corporate bonds on the basis of the "spreads" and their evolution.
If the different sectors in a given domestic market all share the same default free interest rates, this is not true in an international context. The following study considers the markets of government bonds denominated in dollar, in euro, in pound sterling and in yen. These four currencies are, since the setting of the European Monetary Union beginning in January 1999, the main in the world. It is in fact a global sector management at the world level. The importance of the performance variations according to the markets appear clearly from the table 2 that compares the average monthly returns on the period 1998-2001. The American and British markets beat the return of the world portfolio by respectively 11 and 18 bp. The Japanese market suffers an important under-performance of 23 bp per month.
INSERT TABLE 2
The analysis of the asset allocation decisions of an international bond portfolio makes necessary the setting of a benchmark. We didn't keep the JPMorgan’s "Government Bond Index GBI-Global Index" because it covers 17 countries instead of the 4 privileged markets here (cf. annex 1). The outstanding bond markets in these 4 currencies represent 95% of the GBI Government world index of return calculated by JPMorgan. While limiting itself to the 4 main currencies, it seemed preferable to privilege a structure for an international bond portfolio that avoids the important weight given to the Euro zone because of the inclusion of low size and less liquid bond markets of some European countries. The weight of the two French and German markets represents 17,5% of the outstanding bonds of the GBI-Global index, whereas the total of the European bond markets represents 42% of the whole. In the following, we will consider a specific reference portfolio with a simple structure. The weights of the 4 bond markets considered in the test is 30% for the government bonds markets in dollar, in yen and in euro, and of 10% for the pound sterling bonds market. The monthly average return of that benchmark portfolio on the same period is nearly equal to 1 bp to the one of the world GBI index.
The analysis is done on a period of 4 years from January 1998 to November 2001. The indexes of bond return taken into consideration are the domestic ones for government bonds published by JPMorgan. The index of government bonds in euro is only available from September 1st, 1999. On the previous period, it was rebuilt taking to parity the returns of French and German government bonds.
The importance of the allocation decision between bond markets springs clearly as comparing the monthly returns of the 4 considered markets. The average monthly return of the international benchmark portfolio was 54bp on the period, or 5,4% per year.
- Modeling active management
The calculation of the profitability of an active strategy of domestic maturity allocation (AD) and the one of the profitability of an international allocation by market (AIM) is done for horizons of 1 month and 3 monthsiv. A given strategy is defined with two variables: the bet and the ex ante skill of the manager in forecasting well the movement of the market. The bet is the size of the position in deviation of the structure of the reference benchmark. The sizes of bets refer to choices that can increase or decrease the duration of portfolio in relation to the one of the benchmark. A 20% bet has been used by Fjelstad by reference with the practices of American active managers. About the AD strategies, we consider two sizes of 10 and 30% bets of the global position. It means that a domestic manager whose domestic benchmark has a duration of 6, can increase according to the cases his portfolio by carrying it to a duration of 6,6 or 7,8 (respectively by decreasing it to 5,4 or 4,2). The return of a position that is under a bet of rise in price has been calculated while supposing that the manager borrows 10 or 30% of his bond portfolio to acquire additional securities. Conversely, in case of lowering the sensitivity, he sells a proportion of his portfolio that is invested in the money market; these placements have zero sensitivity by definition.
R(AD) = (1 + b). R(DB) - b.MM (1)
R(AD): return of active duration management R(DB): return of the domestic benchmark MM: return on the money market
b: size of the bet, 10 or 30%
- Integration of a skill level
The manager can have a more or less good forecasting ability. The expertise of an active manager expresses itself in relation to a probability of 50% to beat the market. A manager who has a skill level of 60% is able 6 times on 10 to make a good position choice in relation to the benchmark. This choice is binary since it is about either to increase, or to reduce the duration of the portfolio of the size given by the bet. It means that if the rates lower and if the return of the more sensitive portfolio was superior, the manager lengthened cleverly its duration. In 40% of the cases, he made the erroneous choice to shorten his duration whereas the rates lower during the following period. A skill level of 60% means that it made a good choice in 60% of the cases. The simulation consists therefore, for each domestic market on the period, to take into consideration different skill levels of 45% (manager a priori not skilled), 55% and 60%. The manager's choices are symmetrical in the size of the bet since the cost of the loan to lengthen the maturity and the income of the money investment to shorten the duration are equal to the money market rate. By construction, a manager with an expertise level of 50% gets a return equal to the benchmark. According to Fjelstad (1999), skill levels of 55% or 60% are reasonable values compared to the behavior of active bond managers in the American domestic marketv.
The simulation of an international active management (AIM strategies) makes reference to choices to modify the target structure by overweighting or underweighting some domestic markets. It exists here 4 ex ante possible choices in the international market that can give the best performance on the period. The manager's expertise consists in choosing with accuracy the best performer and overweighting it by a ratio of 10 or 30% of the portfolio value. The weight of the 3 other markets is then proportionally reduced. The worst choice will be to overweight the market that will be the least performer on the period.
R(AID)=skill. R(best) + (1-skill). R(worst) (2)
with:
best, worst : active strategy on weighting the most profitable market i (least profitable) R(Mi): return of the best (or worst) ex post performer market (i=1 to 4)
R(other markets): average weighted return of the other markets without the over-weighted (underweighted) market i
wi: weight of the over-weighted (underweighted) market i
skill: skill level
The reference to an error in an international allocation decision is important. A bad choice results in a relative under-performance in relation to the structure of the benchmark. For a skill level of 50%, we must have a performance of the AIM strategy close to one of the international benchmarkvi.
III - Results
A- Active domestic duration strategies (AD)
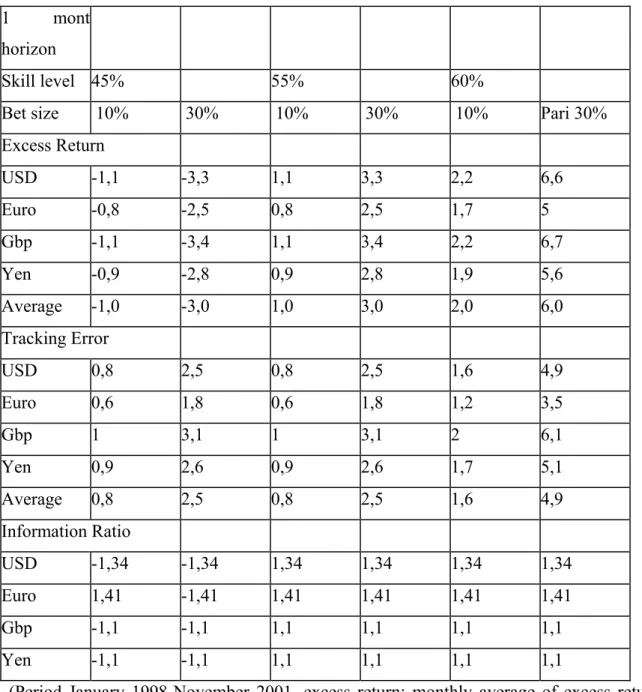
The tables 3 and 4 give the results of the simulation of a domestic active management of the maturities in the 4 bond markets. We distinguished two horizons of investment of 1 and 3 months. We first put in evidence the monthly excess return in relation to the domestic currency benchmark. We took the domestic JPMorgan indexes. The standard deviation of the monthly excess profitability (i.e. tracking error) is indicated underneath, as well as the information ratio. This indicator is important to appreciate the stability of the return of an active management.
INSERT TABLE 3
For a one month horizon, an active management brings average annualized gains of return from 12 bp (i.e. 0,12%) for bets of 10% with a skill level of 55% until 72 bp (0,72%) for bets of 30% with a skill level of 60%. Considered globally, these figures are important. They confirm the results of Fjelstad (1999) which conclude to a yearly excess return of 30
basis points (0,30%) on the bond market in euro and 18 basis points on the bond market in dollar for a skill level of 55% and bets of 15%.
However, the volatility of these excess returns is very important. The tracking error (TE) that measures the volatility of an active management in relation to the simple follow-up of the benchmark is from 1 to 5 bp per month. A general conclusion can be made about TE increasing with the size of the bets and the skill level. We find the tracking error here are lower compared to those simulated by Fjelstad in an AD strategy in the euro bond market euro during the year 1998 (annualized TE of 1,04%) and in the American bond market (annualized TE of 1,33%)vii. Otherwise, in the absolute, information ratios of the order of 1 can be considered as very satisfactory.
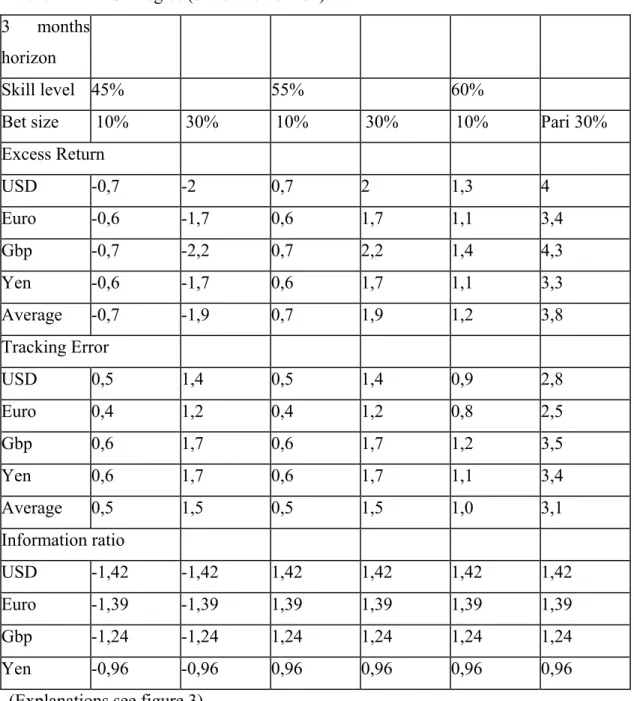
Considering a horizon of active positions on 3 months damages the annualized excess profitability: the gains of return are now between 8 bp per year (skill level of 55%, bet of 10%) and 46 bp (skill level 60%, bet of 30%). The information ratios remain identical with the growth of the horizon, rather superior to the unit.
INSERT TABLE 4
Even in case of a strong capacity to succeed some bets, a bond manager doesn’t know a priori and don't control his gains of on-returns therefore. These are very variable on any period of assumed positions. The information ratios, which are above one, show a good efficiency of an active management in term of additional risk-reward.
B-Active international strategies (AIM)
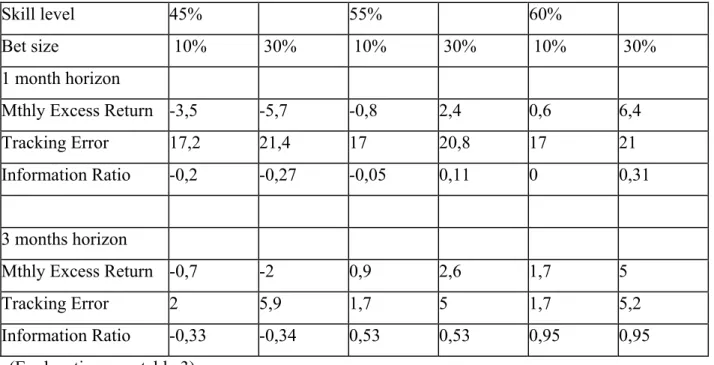
The international allocation between the 4 currency markets shows non symmetrical results. A mistake in international asset allocation leads to privilege the least profitable market. According to the figures; it means a lower under-performance than the gain in the opposite hypothesis. The table 5 shows a non symmetry of the excess returns for rates of skill levels of 45 and 55% for a horizon of 1 month. This one disappears almost considering a horizon of 3 months.
INSERT TABLE 5
On a 1 month horizon, it is necessary to consider a skill level of 60% to materialize a meaningful excess return of 77 pb per year; again it only concerns the bets of 30%. However, this a priori interesting excess return must be crossed with a strong volatility. The average performance of an international bond allocation strategy clearly appears with weak or quasi-null ratios of information, at the most of 0,31 for a 1 month horizon.
The interesting result concerns the superiority of an allocation horizon of 3 months. The forecasting of the relative interest rates between markets on such a period, when it is associated to bets of 30%, shows the utility of an AIM strategy. We put into evidence an annualized excess return of 31 bp to 60 bp depending on whether the skill level is of 55% or 60%. We find, in this last case, additional profits higher than those generated by an AD strategy. The excess return deriving from an international management shows a more important profit potential than the one that would result from a domestic sector management. Fjelstad’ results display a yearly excess return of 33 bp for a domestic sector management in the United States (government/corporate/mortgages), and of the order of 6 to 12 bp for a domestic sector management on the bond market in euro (government/corporate). An international management brings a larger perspective of profit than a simple widened sector rotation management. The potential seems higher for an active manager who would wish to express his expertise there.
The variability of excess returns of an international management, measured by the tracking error, is however very strong. It leads to information ratios which are simply fair for a skill level of 55% (IR equal to 0,53) and rather interesting in the absolute for higher skill level (0,95). The information ratios are of the same order that the ones of active AD strategies. In summary, an international active management is less efficient and of weaker potential for expertise level of 55% that a domestic duration management in what it leads a stronger risk of deviation in relation to the benchmark. It is reserved to the managers who have a high skill level of 60% and are able, at a time, to move off the structure of the benchmark by strong bets and at the same time who consider a 3 months horizon of forecasting. On the opposite, a constrained and limited international management in terms of
horizon or size of the bets doesn't appear through the simulations as more interesting than a domestic management.
IV – Using the ex ante forecasting ability of a model
The previous results are drawn of parameterized simulations using standard positions (in terms of size of the bets and expertise level). We try here to build tables of sampling that start from an input upstream, to get downstream values of performances in terms of excess return and information ratios.
Analyzing the real behavior of active managers as it has been in the real world, would imply a lot of information. It would be necessary to have a sample of managers followed on a given period of time. It would be necessary, besides, to be able to join every allocation decision to a financial calculation or to a forecast of the managers. The difficulty is to clarify such forecasting: often the choices of allocation proceed from implicit logics and combine some very different approaches : strategic views, book value profit from the past, constraints imposed by global management of the institution, regulation limits, changes in the benchmark… It is difficult to isolate the pure cases where forecasts are one to one linked to strategic choices of allocation. In practice, we don’t have access to such observations that are often implicit in the managers’ behavior.
We proceeded using an exogenous model generating forecasts of interest rates in an international context. The features and the average accuracy of this model on one period horizon are known. The informational input of that model has been used then to simulate active allocations of portfolio on real data while applying the strategies AD and AIM.
The objective is at the beginning of the management process, from exogenous information which quality is known; it is to verify if an active strategy can to transform a forecasting ability in real performance.
A - The model
Expertise Asset Management Co developed an internal model of forecasting the international interest rates. It is based on a macro-econometric modeling of the interest rates of the largest economic countries or currency zones: USA, Euro, yen and pound sterling. The interest rate of the euro displayed by the model is derived from the forecasts of the French and the German economy, assumed to represent the European Monetary Union. This model is run every month and provides a forecast of the 10 years bond rates on horizons of 1 and 3 months. The annex 2 presents the features of the model.
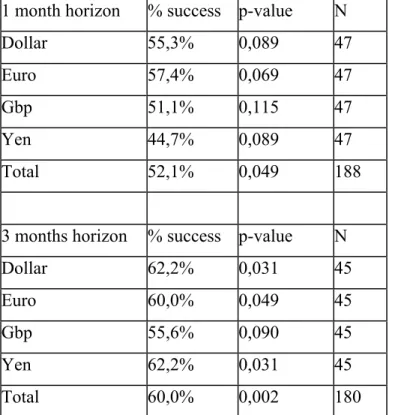
Since January 1998 until November 2001, we have 47 sets of observations of interest rates. The model forecasts have been crossed with real data. It gives rather satisfactory results since the sign of the movement of the bond rates is anticipated correctly to 52% on a horizon of 1 month and to 60% on a horizon of 3 months. In this last, the successes of forecasting are meaningfully superior for every market to what would ensue of a 50% toss probability.
INSERT TABLE 6
The table 6 presents these results. It calculates the number of movements of the rates correctly forecasted. This simple numbering is only the indication of a potential upstream in the process of strategic allocation of an international bond portfolio. A counted success means merely that a forecast of decrease of the rates of x basis points corresponded on the same period to a decrease of the rates of some y basis points. The magnitude of the movement is not taken in account. However, the effective bond performances are very dependent of the size of the variations. A decrease of 1 basis point in rates, even correctly foreseen, can be at the origin of a loss of opportunity at the international level if the manager decided, for example, to leave a bond market whose rates remained steady but whose current return was higher.
B - Performance of an informed active strategy
The forecasting has been considered on the two horizons of 1 and 3 months. Positions had only been initiated if the forecasted variations of interest rate were superior to a minimal
threshold that played the role of filter. This minimal variation aims to avoid the setting up of a re-allocation if the variations of rate on the horizon are not enough significant. We fixed the threshold to 2,5pb for the horizon of one month and to 7,5pb for 3 monthsviii. In the domestic strategies of modified duration management, a decrease in interest rate entails an increase of 10 or 30% in the sensitivity compared to the one of the domestic benchmark. Conversely, an expectation of a rise in interest leads to reduce the duration of the portfolio.
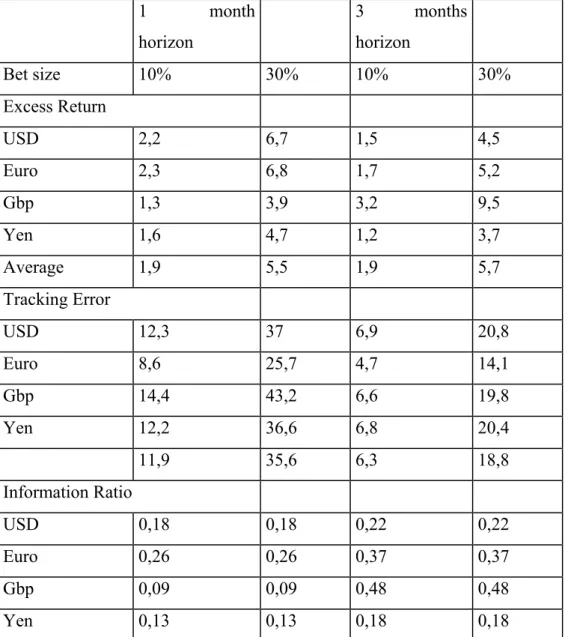
The profitability of an informed active strategy AD is presented in table 7. We can outline an effective yearly excess return of 23 pb for bets of 10% and 65 to 70 bp for bets of 30%. These figures ensuing of a supposedly well informed management process are completely in line with the excess returns of the blind simulation of active strategies of bets on the curve of the rates as described in the previous part. We get values of same order for horizons of investment of 1 and 3 months. What are different are the volatilities that are very generally higher to what was tabulated at the time of the simulations (see previous part).
The active strategy tested on an ex ante rather valuable information set is characterized by higher tracking errors. It can be explained by the a priori uncertainty attached to information which is globally useful but not totally reliable. It follows clearly lower information ratios compared to those tabulated on the ex post simulations which were superior to 1. The IR values of table 7 are of the order of 0,10-0,20 for an active management on 1 month horizon and 0,30-0,40 for a horizon of 3 months. They are still positive and favorable. What has to be noticed here is that the better performance of the model on a horizon of 3 months comes from better stability of the excess gain (i.e. TE) and better information ratios, and not from an improvement in simple returns. We find confirmation that the worthwhile quality of information is translated upstream to downstream by a globally improved performance. The relevance of an active domestic bond management is confirmed. The choice of the exposure on the term structure, that is to say the sensitivity of the portfolio in relation to the benchmark, is the decision that is at the heart of the domestic active management. If, on top of it, the manager has an effective forecasting ability superior to the average, he can transform his expertise and/or his informational superiority, in excess return and performance. Incidentally, the idea of lengthening the forecasting horizon in the setting of an active management is confirmed. An active management takes a certain length of time to find (or not) its confirmation on the market. An active management doesn't rise in its principle of one merely reactive very short term behavior.
INSERT TABLE 7
In a similar manner, an international active and informed strategy (AIM) has been simulated from the variations of interest rate forecasted from the model. Here, are only considered the variations of rate on 1 and on 3 months over a certain threshold, leading to reallocationsix. The calculation of the global excess profitability of the active and supposedly well informed strategy AIM is presented table 8. The excess returns are negligible, sometimes negative, and sometimes positive. The real implementation of an informed international strategy AIM doesn't permit to convert an ex ante expertise in an increase of performance. The volatility of the excess return is important and undermines the possible domination of this type of international strategy in relation to the international benchmark. The IR value is close to zero. An international active strategy, even with the input of some valuable information, is clearly not rewarded.
INSERT TABLE 8
The explanation of this difficulty to transform an ex ante valuable information in a real performance at the level of a portfolio results from the superior complexity of an international active strategy. A domestic active bond strategy is simple. It expresses itself by 2 possible choices: i.e. to lengthen or to reduce the duration of the portfolio according to a binary input which is a forecasting of rise or decrease. An international strategy takes into consideration several markets, here 4, according to 4 inputs: the different rises or decreases of interest rates forecasted on each of these markets. The configurations are multiple. The manager is driven either to overweight, either to underweight every market, since it exists 16 possibilities. The decision of portfolio allocation must therefore aggregate the 4 forecasts through complex over and under weightings. Besides, at the beginning the manager is supposed to have a given expertise and/or valuable information. His expertise is not certain, as for the quality of the information he uses. So the uncertainties attached to a priori information cumulate themselves 4 times, even though each piece of information is worthy in the absolute. A bigger risk exists therefore in the development of the strategy aiming to transform this ex ante favorable input
in an asset allocation. The risks of errors of expectation accumulate themselves in a dynamic allocation between markets. The implementation of an active international strategy is more delicate, more ungrateful, and less profitable because the risk is more important to make mistakes in the structure of portfolio. When it occurs, the added value of an active bond management in an international context is much more remarkable. The operational consequence is to restrict the international active strategies to a juxtaposition of domestic choices while reserving to the manager the decisions of domestic active management of the duration and while freezing the structure of the international portfolio by market in order to follow to the benchmark.
Conclusion
This paper underlines the relevance and the profitability in itself of an active management of bond portfolio. It appears as the final expression of a management process that transforms a superior expertise or useful information upstream, in a resulting over-performance. The over-performance is itself defined as domination in relation to a benchmark portfolio of reference. The excess return is not negligible according to the types of considered strategies at the international level: annualized 40 or 60 bp are extensively comparable to results from other authors. The performance must also rely on the relative stability of the excess return in relation to the benchmark. The values of the information ratios confirm the global efficiency of an active management based on skill rates of 55 or 60% on the domestic markets (AD strategies) or of 60% on the international markets (AIM strategies).
The change of an expertise into a performance implies an allocation decisions that tries to materialize the expected gains into real profitability. Several active strategies have been simulated with various parameters. The comparison with an ex ante set of valuable information aims to show the process of transformation of an expertise into a real performance. The active management of duration appeared to be completely relevant and justified at the domestic level with gains of returns of the order of 50 bp and information ratios of 0,4. This result is however poorer than the one hoped to the departure that let glimpse tabulated information ratios higher than one for skill levels of 60%. If on top of it, the manager has a forecasting ability in fact superior to the average, he can transform this expertise and/or his informational superiority in relation to the market, in excess return and
performance. Incidentally, the interest of the lengthening of the forecasting horizon in the setting of an active management is confirmed. The idea that an active management needs a certain length of time to find (or not) its confirmation on the market, is outlined in the paper. An active management doesn't proceed from a merely reactive and short term behavior.
It appeared that an international active management based on an allocation of positions between bond markets is of different order of the one of the choice of maturity. This type of active management is a priori worthwhile when considering the tabulated simulations. They display annualized excess returns up to 60 bp and information ratios of the order of 1. However, this potential was not confirmed when we implemented a strategy supposedly based on a superior ex ante information given by a model. It was not possible with simple rules of portfolio allocation to materialize an increase of performance. The explanation probably results from the biggest degree of complexity of an international bond management process. The implementation of an active strategy is more delicate, more ungrateful because the risk of error in the structure of an international portfolio is more important. The operational consequence is to restrict the international active strategies to a juxtaposition of domestic choices while reserving to the manager the decisions of domestic active management of the duration and while freezing the structure of the international portfolio by markets.
References
Blake C., Elton E., Gruber M. “The performance of bond mutual funds“, Journal of Business, vol. 66 n°3 1993, p371-403
Brown S., Goetzman W. “Performance persistence”, Journal of Finance, vol. 50, 1995, p679-698„
Brown D. Marshall W. “Assessing fixed-income fund manager style and performance from historical returns”, Journal of Fixed income, mars 2001, p15-25
Detzlere M., “The performance of global bond mutual funds”, Journal of Banking and Finance, vol.23, 1999, p.1195-1217
Dynkin L. Hyman J. “The Lehman Brothers return attribution model” Lehman Brothers Fixed Income Research, 1996
Elton E., Gruber M., and Blake C. “Fundamental economic variables, expected returns, and bond performance”, Journal of Finance, 50, n°4, sept. 1995, p.1229-1256
Fjelstad M. “Modeling the performance of active managers in the Euroland bond market”, Journal of Fixed Income, june 1999, p32-45
Fox S., “Assessing TAA manager performance”, Russell Research Commentary, may 1998, Franck Russel Co, Tacoma, Wash.
Grinblatt M. Titman S., “Performance persistence in mutual funds”, Journal of Finance, vol. 47, 1992, p1977-1984
Kahn R. Rudd A. “Does historical performance predict future performance?” Financial Analyst journal, nov./dec. 1995, p.43-52 1965
Maag F, Zimmermann H. „On benchmarks and the performance of DEM bond mutual funds“, Journal of Fixed Income, december 2000, p31-45
Sharpe W. « Asset allocation: Management style and performance measurement », Journal of Portfolio Management, vol. 18 n°2, winter 1992, p7-19
Sorensen E., Miller K. Samak V. « Allocation between active and passive management », Financial Analyst Journal, sept./Oct. 1998, p18-31
ANNEX 1 - Structure of the index JP Morgan Government Bond Index (source: JP Morgan, given at 29/11/2001)
Market Weight Macaulay Duration Remaining Maturity Global 100% 5.886 8.122 Europe 41.93% 5.693 8.076 Non-US 72.81% 5.675 7.368 Australia 0.46% 4.591 5.742 Belgium 3.02% 5.504 7.261 Canada 2.62% 6.192 9.622 Denmark 1.19% 4.575 5.799 France 8.38% 5.462 7.444 Germany 9.08% 5.372 7.567 Italy 8.26% 5.600 8.418 Japan 27.80% 5.618 6.114 Netherlands 2.38% 5.299 7.349 Spain 3.45% 5.384 7.352 Sweden 0.86% 4.560 5.587 United Kingdom 5.31% 7.669 11.588 United States 27.19% 6.453 10.142
Annex 2 - The VAR model of forecasting
The VAR model is a vector autoregressive model using a structure of overlapped blocks which aims to model the main economic and financial data of the 5 major developed countries (G5). The vector modeling allows expressing the joint realization characteristics of the economic variables of country which economies are interdependent and which markets are internationally integrated. The structure on overlapped blocks can express a link of causality from previous block which is restored as a vector of explanatory variables in the evaluation of the following block. Classically, the “real” variables constitute the upstream blocks vectors that conditions the downstream blocks vectors relative to markets variables. The variables are taken in first differences because of the well-known non stationarity of the economic and financial variables.
The real blocks are the growth of the money supply, the industrial production (as proxy of the real production) and the inflation. These variables condition the short-term rates of interests, those themselves are taken as explanatory variables of the long-term interest rates. The other forecasted variables of markets are the variations of the stocks indexes and the exchange rates. The passage of the economic forecasts for France and Germany to the interest rates of the European Monetary Union is done by weighting for half the forecasts of interests for France and for Germany.
The VAR model is run monthly from the last known values of the variables. Estimates are taken for non published current data. The auto-regressive structure of every block has been estimated at the time of the initial calibration of the model. In general, the number of optimal lags is limited to 3 or 5 months. The evaluation of the model is done from monthly data from January 1985.
The ex post simulations show that the VAR international model displays an enough satisfactory prediction power for the bond rates and to a least degree the stocks indexes. The forecasting ability of the money rates and the one of the exchange rates is even smaller.
1 / forecasting ability ↓
2 / asset allocation ↓
3 / realization of excess performances ↓
4 / analysis and appreciation of the performance Table 1 - Process of active management of a portfolio
Table 2 - Performance monthly average
(period January 1998-November 2001; source: JPMorgan) Return US 0,57% Return Euro 0,50% Return U. Kgd 0,64% Return Japan 0,23% Return JPM-GBI 0,46% Return Benchmark International 0,45%
Table 3 –AD Strategies (1 month horizon) 1 mont
horizon
Skill level 45% 55% 60%
Bet size 10% 30% 10% 30% 10% Pari 30% Excess Return USD -1,1 -3,3 1,1 3,3 2,2 6,6 Euro -0,8 -2,5 0,8 2,5 1,7 5 Gbp -1,1 -3,4 1,1 3,4 2,2 6,7 Yen -0,9 -2,8 0,9 2,8 1,9 5,6 Average -1,0 -3,0 1,0 3,0 2,0 6,0 Tracking Error USD 0,8 2,5 0,8 2,5 1,6 4,9 Euro 0,6 1,8 0,6 1,8 1,2 3,5 Gbp 1 3,1 1 3,1 2 6,1 Yen 0,9 2,6 0,9 2,6 1,7 5,1 Average 0,8 2,5 0,8 2,5 1,6 4,9 Information Ratio USD -1,34 -1,34 1,34 1,34 1,34 1,34 Euro 1,41 -1,41 1,41 1,41 1,41 1,41 Gbp -1,1 -1,1 1,1 1,1 1,1 1,1 Yen -1,1 -1,1 1,1 1,1 1,1 1,1
(Period January 1998-November 2001, excess return: monthly average of excess returns in relation to the benchmark in bp, tracking error: standard deviation of the monthly excess returns, information ratio: return excess means divided by the tracking error)
Table 4 – AD Strategies (3 months horizon) 3 months
horizon
Skill level 45% 55% 60%
Bet size 10% 30% 10% 30% 10% Pari 30% Excess Return USD -0,7 -2 0,7 2 1,3 4 Euro -0,6 -1,7 0,6 1,7 1,1 3,4 Gbp -0,7 -2,2 0,7 2,2 1,4 4,3 Yen -0,6 -1,7 0,6 1,7 1,1 3,3 Average -0,7 -1,9 0,7 1,9 1,2 3,8 Tracking Error USD 0,5 1,4 0,5 1,4 0,9 2,8 Euro 0,4 1,2 0,4 1,2 0,8 2,5 Gbp 0,6 1,7 0,6 1,7 1,2 3,5 Yen 0,6 1,7 0,6 1,7 1,1 3,4 Average 0,5 1,5 0,5 1,5 1,0 3,1 Information ratio USD -1,42 -1,42 1,42 1,42 1,42 1,42 Euro -1,39 -1,39 1,39 1,39 1,39 1,39 Gbp -1,24 -1,24 1,24 1,24 1,24 1,24 Yen -0,96 -0,96 0,96 0,96 0,96 0,96
Table 5 – AIM strategies
Skill level 45% 55% 60%
Bet size 10% 30% 10% 30% 10% 30%
1 month horizon
Mthly Excess Return -3,5 -5,7 -0,8 2,4 0,6 6,4
Tracking Error 17,2 21,4 17 20,8 17 21
Information Ratio -0,2 -0,27 -0,05 0,11 0 0,31
3 months horizon
Mthly Excess Return -0,7 -2 0,9 2,6 1,7 5
Tracking Error 2 5,9 1,7 5 1,7 5,2
Information Ratio -0,33 -0,34 0,53 0,53 0,95 0,95
Table 6 – Percentage of successful forecasts – (from the VAR model to 1 month and to 3 months)
1 month horizon % success p-value N
Dollar 55,3% 0,089 47
Euro 57,4% 0,069 47
Gbp 51,1% 0,115 47
Yen 44,7% 0,089 47
Total 52,1% 0,049 188
3 months horizon % success p-value N
Dollar 62,2% 0,031 45
Euro 60,0% 0,049 45
Gbp 55,6% 0,090 45
Yen 62,2% 0,031 45
Total 60,0% 0,002 180
(Source: EAM, January 1998-November 2001, success of forecasting of evolution of the interest rates, p-value,: hypothesis of difference in relation to a binomial law resulting from a 50% toss, N: number of observations)
Table 7 - Performance of an AD domestic strategy informed from the model 1 month horizon 3 months horizon Bet size 10% 30% 10% 30% Excess Return USD 2,2 6,7 1,5 4,5 Euro 2,3 6,8 1,7 5,2 Gbp 1,3 3,9 3,2 9,5 Yen 1,6 4,7 1,2 3,7 Average 1,9 5,5 1,9 5,7 Tracking Error USD 12,3 37 6,9 20,8 Euro 8,6 25,7 4,7 14,1 Gbp 14,4 43,2 6,6 19,8 Yen 12,2 36,6 6,8 20,4 11,9 35,6 6,3 18,8 Information Ratio USD 0,18 0,18 0,22 0,22 Euro 0,26 0,26 0,37 0,37 Gbp 0,09 0,09 0,48 0,48 Yen 0,13 0,13 0,18 0,18
Table 8 - Performance of an international strategy AIM informed from the model Bet 10% Bet 30% 1 month horizon Excess Return 0,1 0,4 Tracking Error 4,5 13,6 Information Ratio 0,03 0,03 3 months horizon Excess Return -0,2 -0,6 Tracking Error 1,7 5,1 Information Ratio -0,11 -0,11
i Cf. op. cit. The author works for Franck Russel Co in the Policy and Research Department.
ii The weights of these sectors in the Lehman US Aggregate were 39%, 9%, 21% and 31% at end october 1998.
iii The Lehman Euro Aggregate Bond index gives a weight of only 12% to the « corporate » sector in the euro
bond market at end october 1998.
iv In the first case, we consider the indexes variations the following periods: january-february, february-march,
march-april…In the second case, observations will be overlap: january-april, february-may, march-june…
v cf. op.cit., p.37
vi Close but not identical because the returns of the « best » and the « worst » strategies are not symmetrical
vis-à-vis the benchmark return.
vii See art. cit., p.41, table 7.
viii It means, for a duration of 5, a profit potential of 0,12% on one month and of 0,37% on a 3 month period.
ix We used a 5 bp threshold for a 1 month horizon and a 15 bp threshold for a 3 months horizon. The results are