EXAMINING RESOURCESAND COMPETENCIES VIEWAGAINST TRANSACTIONAL COSTS APPROACHIN THE FRENCHPOULTRYINDUSTRY: TREADINGUPONEGGS
INTRODUCTION
Determinants of firm boundaries have undergone careful examination in the last 40 years, and empirical evidence for and against explanations rooted in different theories has been accumulating rapidly, resulting in heterogeneous results. Despite the multiplicity of approaches tested (i.e. transaction cost approach, resource based view, real options perspective, inter-organizational coordination perspective and so forth); approaches affiliated to knowledge and resources, and transaction cost remain clearly the two leading competitors. While Transaction Cost Approach (henceforth TCA) provides direct insights into vertical integration decisions, Resources and Competencies View (henceforth RCV) started as a competitive advantage approach, with an “economic” orientation focusing on the type of resources and competencies that could offer a sustainable competitive advantage to its owner over its competitors. Yet, RCV has rapidly extended its interest to the firm boundary decisions. In that last field, it immediately emerged as an important competitor to the already well-established TCA, offering an alternative answer to the transactional framework, criticizing its basic foundations: unit of analysis focusing on transaction, priority given to the role of opportunism (Kogut and Zander, 1996, Conner and Prahalad, 1999), as well as cost minimization quest logic (Zajac and Olsen, 1993, Heiman and Nickerson, 2002).
Since then, several empirical researches confronted these two approaches (Argyres, 1996, Poppo and Zenger, 1998, Leiblein Miller, 2003, Hoetker, 2005, Jacobides and Hitt, 2005, Parmigiani, 2007 and so forth). While the majority of studies attempt to proclaim about the global dominance of one over the others, authors such as Conner (1991:143)1 believe that there is in fact no reason why there cannot be a “contextuality” of their dominance. Indeed,
1 “Empirically, there is no reason why it might not be observed that some integration decision seem to turn on specific asset creation/ redeployment issues, and others on reducing opportunistic potential. A fruiteful area for further theory development may be exploration of situations in which integration decisions can be expected to depend on one or the other of this consideration, or a combination ».
contextual variables can probably influence the relevance of an approach over another in a particular context, thus explaining disparity of results among empirical studies. Following this standpoint, Steensma and Corley (2001) building on Chiles and Mc Mackin (1996) for example, demonstrated how managers’ risk aversion can sharpen TCA’s relevance. They also showed that the resource-based rationale, grounded on the opportunity to develop sustainable advantages play a larger role when a firm has lower levels of recoverable slacks and risk-seeking orientation. Argyres (1996) also showed how a capability issue is likely to appear most when there is little or very significant overlap between the bases of generic technological knowledge related to activity performance.
This article aims at testing the degree of empirical support to the resources and competencies view as compared to the transactional approach. Therefore, our model addresses the degree to which each of these perspectives explains firm boundaries through a set of predictions declined from the main conceptual and empirical literature. Results are based on a research conducted in the French poultry industry from 2003 to 2006. Data was developed through a series of interviews with chief executives in the 14 leading companies, constituting the quasi total population, as the latter represent 96% of the total volume produced in France. For each company studied, we tested whether TCT or RCV was more relevant in explaining the degree of vertical integration in the two primary stages of the poultry production chain that are hatchering and feed production. Quantitative tests undertaken through SPSS studied the correlation between these two variables. The paper proceeds as follows. A first section discusses the two competing approaches, building predictions that emerge from main conceptual and empirical literature and mainly focusing on the under-developed RCV’s conceptualization. The second section introduces data, sector and method used. It also highlights what we call a “temporality” problem that has led us to use a method based on interviews. Finally, the last section presents our findings and discussion.
1.
DETERMINANTS OF VERTICAL INTEGRATION: CONCEPTUALIZING TCA AND RCV.
PREDICTING THE DEGREE OF VERTICAL INTEGRATION THROUGHOUT TRANSACTIONAL LENSES
Transactional approach represents a highly discussed approach that has imposed its domination through conceptual as well as empirical literature. As emphasized by David and Han (2004), since the publication of Williamson's 1975 and 1985 books, starting from the early 1990s, TCA has been cited between 250 to 500 citations yearly, and, empirically tested across several business fields (Boerner and Macher, 2002). Because exhaustive theoretical developments of the TCA can be found elsewhere (Williamson, 1979, 1985, 1991), we only provide a compact version here, highlighting the main predictions that are tested.
The basic insight of TCE is to recognize that in a world of positive transaction costs (Coase, 1937), exchange agreements must be governed, and that, contingent on the transactions to be organized, some forms of governance are better than others. Therefore, Williamson (1979, 1985)
offers a parameterization of the tautological “transaction cost” concept (Fisher, 1977:22)2. He first sets two main hypotheses relative to limited rationality and opportunistic human behaviour that increases ex ante and ex post transaction costs. Hence, individuals are limited in their ability to plan for the future and these limits are sharpened by the high propensity of actors to behave opportunistically (Williamson 1979:234)3. Then, he identifies three critical dimensions with respect to which transaction costs differ: specificity, uncertainty and frequency. Simultaneously, Williamson categorizes generic forms that are supported by different contract laws. His model is rooted in Macneil’s (1974, 1978) contract typology which advances three contractual classifications: classical (market form), neo-classical (hybrid form) and relational contracts (Bilateral or unified). The last step of the reasoning connects transaction costs with modes of organization. He links the two pieces through what he calls the “discrete alignment” principle. Concretely, the arbitration between the three generic forms is based on a transaction costs minimization quest, called “economizing” where each generic form is a syndrome of transaction attributes.
This framework provides a set of testable propositions concerning the degree of vertical integration. In fact, Williamson (1979) argues that vertical integration will be relatively more efficient with recurrent transactions, and when investments are idiosyncratic (high asset specificity) and uncertainty is either high or medium. Indeed, vertical integration results from the need to prevent ex-post hold-up problems, resulting from transaction specific investments.
2 « Transaction costs have a well deserved bad name as a theoretical device...[partly] because there is suspicion that almost anything can be rationalized by invoking suitably specified transaction costs”.
These predictions have been extensively operationalized with an emphasis on “positive” rather than on “normative” analysis (Masten, 1993, Poppo and Zenger, 1998). In effect, the majority of empirical research stress the variation of the discriminating alignment hypothesis identified above, where organizational mode is the dependent variable, while transactional properties, as well as other control variables, serve as independent variables. Aiming to assess the most achieved framework, a deep reading of the main conceptual and empirical literature showed that frequency is rarely tested, whereas specificity, uncertainty and the effect of opportunism on the degree of vertical integration are the three leading dimensions (Rindfleisch and Heide, 1997). In the following sections, we will briefly present the main transactional predictions.
ASSETSPECIFICITY
Specificity of assets is the cornerstone of the transactional approach. It has been defined as the value of investments that would be lost in any alternative use (Williamson, 1985). In fact, highly specific assets create mutual dependence that opens the possibility of “hold-up”, defined as the detrimental ex-post appropriation of the quasi-rent by one or some partner(s) (Klein & al., 1978). Following Williamson’s logic, the first prediction is set as follows: Prediction 1: The greater the degree of specificity, the more likely a firm is to select a
higher degree of vertical integration.
This prediction can be declined into different types of specificity including physical assets, human assets and site specificity.
Prediction 1a: The greater the degree of physical assets specificity, the more likely a firm is to select a higher degree of vertical integration.
Prediction 1b: The greater the degree of human assets specificity, the more likely a firm is to select a higher degree of vertical integration.
Prediction 1c: The greater the degree of site specificity, the more likely a firm is to select a higher degree of vertical integration.
OPPORTUNISM
Opportunism is the assumption that, given the opportunity, decision makers may unscrupulously seek to serve their self interest, and that is difficult to determine a priori who
is trustworthy and who is not. This risk increases facing small number situations, where “replaceability” problems are sharpened. This gives rise to our second prediction:
Prediction 2: The greater the degree of opportunism surrounding a transaction, the more likely a firm is to select a higher degree of vertical integration.
UNCERTAINTY
Uncertainties surrounding the organization of a transaction may also involve significant costs, whether it comes out of agents’ behaviour or organizational deficiencies; or from inadequate institutions. Uncertainty is therefore an external “disturbance” that can generate opportunistic behaviour, as changes can lead to difficulties with modifying agreements to changing circumstances. While empirical studies do not automatically take into account the importance of linking uncertainty to specificity (Slater and Spender, 2002, David and Han, 2004, Klein, 2004), Williamson clearly points out the important role of uncertainty only once it deals with specific assets. The following prediction underlines the importance of combining uncertainty to specificity.
Prediction 3: The greater the asset specificity and the greater the uncertainty surrounding a transaction, the greater is the likelihood of the firm to select a higher degree of vertical integration.
This prediction has then been declined into two main types of uncertainty including environmental unpredictability and behavioural uncertainty. While the former refers to unpredictability due to fluctuation of factors such as demand, price or technology, the latter refers to a performance evaluation problem, that is, difficulties in verifying whether compliance with established agreements can be easily verified.
Prediction 3a: The greater the asset specificity and the greater the environmental uncertainty surrounding a transaction, the greater is the likelihood of the firm to select a higher degree of vertical integration.
Prediction 3b: The greater the asset specificity and the greater the behavioural uncertainty surrounding a transaction, the greater is the likelihood of the firm to select a higher degree of vertical integration.
PREDICTING THE DEGREE OF VERTICAL INTEGRATION THROUGHOUT RESOURCES AND COMPETENCIES LENSES
Mid-eighties witnessed the emergence of a growing body of work collectively labelled the resource and capability-based view of the firm4. In reality, RCV first adopted an “economic” orientation. Pioneer studies (Wernerfelt, 19845, Barney, 1986, 1991, Dierickx and Cool, 1989, Peteraf, 1993) focused on the type of resources and competencies that could offer to its owner a sustainable competitive advantage. Therefore, resources and competencies approach first appeared as a theory of competitive advantage or a theory of “performance of the firm” (Argyres & Zenger, 2007). Issues were mainly concerned with putting in place resources and competences that offer a sustained competitive advantage; as well as resources that provide greater value.
This section aims to focus on RCV’s insights into vertical integration decisions. As, no universal framework is available through literature; we will proceed by putting in light conceptual studies that seem to offer fruitful foundations, as well as the most tested predictions across empirical studies. Concepts such as competencies, core competencies, dynamic competencies, knowledge, as well as routines have been progressively integrating. The following table reviews branches that compose RCV (Koeing, 1999). For each, we extract general predictions that emerge, and then, suggest predictions that could directly be applied to the “make or buy” decision.
Ta
ble 1 : Predictions among main branches.
MAINBRANCHES Resource
Based View Core competencies Approach capabilities Dynamic Approach
Evolutionnist Approach
MAINAUTHORS Barney,
Wernerfelt
Hamel & Prahalad Amit & Shoemaker
Teece, Pisano & Shuen
Nelson & Winter
UNITOFANALYSIS Resources Core Competencies Dynamic
capabilities Path dependence routines GENERAL PREDICTIONS In order to obtain a sustained competitive advantage, firms should identify and acquire resources that possess
Firms should identify and exploit key competencies. The latter must be declined into central
- Firms should develop dynamic capabilities so as to face No clear predictions. This approach rather describes how
4 In reality, RCV draws inspiration from Edith Penrose’s (1959) influential book On the Theory of Growth of the Firm (1959). Conceptual article such as Wernerfelt’s 1984 and Barney’s 1986, clearly pointed out the existence of a new approach. However, empirical tests only took form from the early nineties.
5 His article won the Strategic Management Journal “Best Paper” reward.
VRIS6 characteristics. products and then
into final products ; market, product and technology’s rapid evolution. firm structures’ result from routines. PREDICTIONS RELATIVETO “MAKE ORBUY” DECISION - Verify whether activities that rely on resources possessing VRIS characteristics help to obtain a sustained competitive advantage ;
-Then, verify whether these activities are integrated7 or not.
- Verify whether
firms integrate
activities for which they possess core competencies. - Verify whether firms integrate activities for which they possess dynamic capabilities. No clear predictions can be declined.
This brief review shows a disparity among units of analysis, as well as tautological predictions (Priem and Butler, 2001) based upon concepts that are also difficult to observe (Godfrey and Hill, 1995). Moreover, among this set of predictions, none does explicitly make reference to the “make or buy” decision. However, the main idea that appears from these branches is that vertical integration should concern activities that can offer greater value to the firm.
STRATEGICASPECTOFANACTIVITY
The above branches point out the importance of internalizing activities for which it possesses resources, core or dynamic competencies that offer a sustained competitive advantage. In other words, vertical integration should concern strategic activities. This argument is also underlined by Zajac & Olsen (1993) and Gosh & John (1999) throughout the “strategizing” concept. This leads to a first prediction emerging from the “competitive advantage” branches. Prediction 4: The more strategic the activity is perceived the more likely it will be integrated Further review of firm boundary’s conceptual studies emphasizes three recurrent dimensions that offer other fruitful foundations to the RCV’s framework.
DIFFERENTIALCAPABILITIES
6 Ressources valorisables, rares, non imitables et non substituables.
7This prediction is extracted from Steensma et Corley (2001)’s article in which RBV is tested throughout these two propositions..
RCV featuring as a “theory of the firm” first appeared as an alternative answer to the transactional approach framework, criticizing its basic foundations: unit of analysis focusing on transaction, priority given to the role of opportunism (Conner and Prahalad 1996), as well as cost minimization quest (Heiman and Nickerson 2002). Indeed, some of the impetus behind the development of competence-based theories stems from dissatisfaction with exclusively transaction cost explanations. According to Hodgson (1998), it is this debate undertaken through the successive articles published in the Organization Science in 1996 (Kogut and Zander, 1996, Foss 1996) that transformed RCV into an alternative “theory of the firm”. Earlier, scholars such as Demseltz (1988: 147)8 or even Richardon (1972) had already pointed out the importance of boundary explanations encapsulating concepts such as know-how and capabilities. In fact, the main contend of RCV as a theory of the firm is that the reason an activity is conducted within a firm is not necessarily market failure but rather firm success, since it manages to put in place “a higher order of organizing principles”. Therefore, internal structures can become a “creator of positive” rather than an “avoider of negative” (Kogut and Zander, 1996). Nonaka & Al. (2000) argue that internal interactions among members result in a rapid coordination that can enhance internal know-how as well as skills transfer; emphasizing that the “ba” (firm) is a place where an individual transcend him/herself through an amplified knowledge creation.
Following that standpoint, vertical integration decisions should result from a capability comparative logic. Since firms differ in their ability to undertake an activity, the former should integrate activities for which they possess superior capabilities. This argument leads to the second following prediction:
Prediction 5: Firms will vertically integrate into those activities in which they have greater production experience and/or organizational skills than potential suppliers.
COMPLEMENTARITIES
8 “The emphasis that has been given to transaction costs dims our view of the full picture by implicitly assuming that all firms can produce goods and services equally well…Since firms may not be perfect substitutes in the production of goods and services, it might be of interest to the firm to produce its own input event if the transaction costs were zero and management costs were positive. Or, if the production cost incurred by other firms is sufficiently low, it might serve the firm to purchase its inputs, even though the costs of managing “in-house” production is zero”.
In her article comparing RBV to industrial economics, Conner (1991) offers important insights into boundary decisions. She stresses the fact that heterogeneity among firms can explain different performances among firms. Therefore, a given asset can be more efficiently combined within a firm X than another firm Y since the former already possesses a stock of complementary resources. In fact integrating complementary assets offers synergies that emerge from “co-specialization”. Firms can therefore integrate because of assets “reladness”. Dierickx and Cool (1989) follow the same standpoint, putting in light the importance of “interconnectedness”, arguing that firms will therefore integrate activities for which they already possess a “stock” of assets, termed “assets mass efficiencies”. Montgomery and Wernerfelt (1988) also underlined the role of complementary throughout what they termed « super-additive » assets. This argument gives rise to the following prediction :
Prediction 6: The greater an activity is perceived as complementary to firm’s assets the more likely it will be integrated.
INTERDEPENDENCIES
Conceptual literature relative to RCV’s insights to boundary decisions also shows the important role played by interdependence. Indeed, Grant (1996) highlights the importance of interdependence in determining whether an activity should be integrated or not. He argues (1996:114) that “Knowledge-based view of the firm encourages us to perceive interdependence as an element of organizational design and the subject of managerial choice”. Building on the earlier Demseltz (1991)9, he argues that if markets transfer knowledge inefficiently, vertical adjacent stages of production A and B will be integrated within the same firm if production at stage B requires access to the knowledge utilized in stage A. If, on the other hand, the outside A can be processed at stage B without the need to access the knowledge utilized at stage A, then A and B are efficiently conducted by separate firms linked by market interface. This argument leads to our last prediction:
Prediction 7: The greater an activity is perceived as interdependent considered, the more likely it will be integrated.
9 Demseltz H., (1991), The Theory of the Firm Revisited, In O. Williamson (eds.), The Nature of the Firm, Oxford University Press, NY, pp. 159-178.
So as to make sure of the completeness of the outlined predictions, we have undertaken an empirical review. For each research considered, we controlled whether the model tested is included in the four predictions presented above. The following table synthesizes this survey, classifying empirical studies depending on the methodology used (qualitative vs quantitative and positive vs normative), as well as the branches on which it is based.
Table 2: Synthesis of RCV’s predictions in the empirical literature
METHODOLOGYUSED TESTOF RCV
Qualitative Positive KBV - Comparison between firm and supplier’s capabilities
(Argyres, 1996). Normative × NO STUDIES FOUND Quantitative Normativ e KBV RBV
- Effect of increased specificity on firm’s governance performance. (Poppo & Zenger, 1998).
- Relationship between integration and improvement of the competitive positioning (Kale & Puranam, 1994)
- Relationship between uniqueness-imitation barriers and sustained competitive advantage (Steensma & Corley,
2000: first and second hypothesis). Positi ve KBV & Evolutionnist approach RBV RBV KBV
- Effect of transferability (measured by codifiabilty, teachability, complexity, number of previous transfers and age of the technology) on the technological mode of transfert
(Kogut & Zander, 1992).
- Effect of the perceived contribution of the activity to a compettitive advantage and vertical integration (Steensma
& Corley, 2001; Schilling & Steensma, 2002 : third hypothesis).
- Effect of « Strategic aspect » of an activity on vertical integration (Delmond, 1994).
- Comparison between firm and suppliers’s capabilities and vertical integration (Leiblein and Miller, 2003, Jacobides
& Hitt, 2005, Hoetker 2005, Parmigiani, 2007). The foundation of any theory of the firm is a set of initial premises which form the basis for the logical development of propositions concerning the structure of the firm. These foundations are still heterogeneous in RCV approach. Even though several empirical studies exist, there still is no consensus about the propositions to be tested. As related by Jacobides and Hitt (2005), two main traditions dominate; the first focuses on competitive advantage, while the second focuses on comparative advantage. We can also notice that complementarity and interdependence that emerge from conceptual literature have not been tested.
2.
METHODS
PRESENTATION OF THE FRENCH POULTRY INDUSTRY
The above predictions were tested on survey data from the French poultry industry. We selected one industry rather than several in order to detect real differences in practice that might otherwise be confound with industry-specific effects.
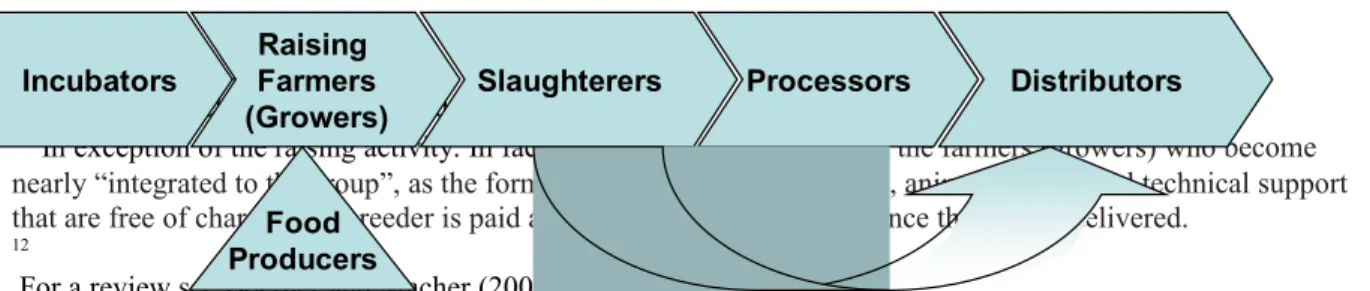
The choice of this particular sector results from two main reasons. First, it offers different stages constituting the whole production chain that is represented as follows: Hatching eggs are transformed into hatching baby chicks through a selection and incubation process, once the baby chicks produced; they are transported to growers (raising farmers). In parallel, a feed mill mixing ratios for raising chicks is operated by the feed producers. Growers then feed animals for a seven week period time (in average) for standard chicken10. Finally, chicken are slaughtered and processed so as to be distributed (see figure 1). Despite the same transactional context, these activities are not undertaken similarly among different operators. Indeed, while the leader, LDC relies upon contracts, his challenger, DOUX wholly integrates these activities11. Second, this sector has also been chosen as, even though theories of the firm have been tested in many sectors12, it appears that aviculture remains poorly studied. Interesting studies do exist (Knoeber, 1989, Allen & Lueck, 1993, Ménard 1996), however, they focus on the sole relationship between integrators and producers (raising farmers), notwithstanding integration decisions within other activities constituting the poultry chain. Moreover, these studies are exclusively based upon primary data, neglecting operators’ beliefs and perceptions that influence boundaries decisions.
Figure 1: Representation of t he poultry chain
10 An eleven week period is required for certified chicken
11In exception of the raising activity. In fact, the group orders chicken to the farmers (growers) who become nearly “integrated to the group”, as the former provides them with chicks, animal feeding and technical support that are free of charge. The breeder is paid an amount called a “façon”, once the animal delivered.
12
For a review see Boerner and Macher (2002).
11 Incubators Slaughterers Raising Farmers (Growers) Food Producers Processors Distributors
French aviculture is leading the European production, and is second in world exports13. It remained for a long time organized in a traditional way and the first symptoms of industrialization only appeared in 1950 (Diry, 1985). Since then, the industrial operators usually called “integrators” started holding an increasing role in the sector. Nowadays, the sector is concentrated and twenty two companies (see Annexe 1) account for the whole volume of production.
These companies are composed of private groups and agricultural cooperatives. Private groups were at the beginning generally14 slaughterers that decided (or not) to integrate upward activities, whereas cooperatives15 started to be involved with upward activities, dealing with the combination of “feeding and growing” activities, and then decided whether to downward integrate slaughtering and distributing activities or not16. In most cases, private groups are directly in contact with the distribution channel (i.e. Carrefour, Géant, Monoprix...), which orders products with technical and sanitary requirements. Starting from that order, these private groups organize their own production chain (if they are integrated), or, buy through spot market or contracts with farmers, incubators, and feed producers. They can also contract with a single entity which already masters the entire production chain. However, variants do exist, and while slaughterers can be more or less integrated, cooperatives can also integrate the slaughtering activity being therefore directly in contact with the distribution channel.
13
1 For more details see Ménard (1996).
14
1 One exception exists as the private group “Arrivé”, started as a feeder, and extended progressively its activities,
integrating the other activities of the production chain. 15
1 A cooperative is a combination of members that own it. In fact, to become a member, farmers must pay an
“entry ticket” transforming the member in a sort of “stockholder” of the cooperative. The cooperative holds property rights on the brand name and is responsible for controlling quality, and, the respect by all parties of the requirements contractually agreed upon. It is in charge of marketing the products and of contract negotiations with retailers. Consequently, members will not negotiate buying and selling prices individually, as the cooperative will be the single negotiator.
16 In fact, cooperatives never own breeding buildings, they define technical requirements to their members through a document the “cahier des charges” (it sets a list of technical and sanitary requirements), provide them with technical support, collect and select the products, and take care of the packaging of their members.
Hence, these two types tend to be organized in the same way, each of them being more and more involved in the upward and downward activities; we decided to study both types.
Among the twenty two companies studied, further analysis revealed that the eight lastly ranked groups are in reality “pure slaughterers” that are not at all involved in upward activities (neither hatchering nor feed production). They contract with a unique “production entity” that takes in charge the whole production chain. For the latter, as we can not gather the same nature of data17, we decided to exclude them from the study, focusing on the 14 first groups that account for 96% of the total production.
Finally, following Zott and Amit (2006), we decided to focus on the internalization of an activity as a whole, rather than on a single product as it is often the case within empirical tests (Monteverde and Teece 1982, Walker and Weber 1984). The survey studied two activities that are hatchering and feed production who were not chosen at random, but rather based on the fact that they were heterogeneously integrated within French poultry groups.
METHODOLOGY AND TEMPORALITY ISSUE
This study follows the positive tradition, as it tests the degree of confirmation of theories’ predictions (Friedman, 1953). Therefore it is based upon a classical questionnaire measuring at one hand the degree of vertical integration throughout the two activities, and on the second hand the perceived context at the moment of the decision. Questionnaires were directly filled out during the interviews which were either conducted directly or through telephone meeting. Conceptual items were measured on a five point Likert-scale ranging from “completely disagree” to “completely agree”.
Data was gathered through interviews with key informants that had to meet the “knowledgeability criteria” by being involved in the boundary decision at the time the decision was taken either as a chief executive, or as an “upward director”18. This constraint required time to identify the right respondent19. Data collection first included quantitative measures. Then, respondents were asked to discuss the answers given through direct
17 The informants are not involved in these activities and do not really have an opinion about the degree of specificity, uncertainty, differential capabilities and so on…
18 The person in charge of coordinating the whole production chain.
19In many cases, the present director was not in the company at the moment the decision was taken. In two cases we had to meet with persons who had already retired.
interviews. This data collection method emerged from the need to overpass what we called the “temporality problems”20. In fact, this method helped to make sure data concerned the perceived situation at the moment of the decision that led to the present firm boundaries. Walker and Poppo (1991) already pointed out the risk of studies simply testing whether activities that are performed inside are more specific than those outsourced. They argue that this method does not specify the cause of vertical integration since assets could have become more specific after their internalization. Even though authors do not make imply the temporality problem explicitly, they implicitly highlight a problem due to the different moments of the decision-making process. Concretely, consider the following example relative to verifying impact of feed production’s differential capability in a group that has already integrated this activity. The group asked today will more likely answer that he possesses superior capabilities. Hence, it is difficult to imagine the same answer if that group had been questioned at the moment the decision was taken. Let’s now consider the example of the same integrated group whom we ask if it feels difficulties in evaluating its (internal) supplier. Its integrated structure will more probably deliver a negative answer whereas it could have been exactly this same difficulty that made it integrate at the moment the decision was taken. These two examples demonstrate how a static data collection method can respectively lead to a wrong confirmation of RCV’s predictions as well as a wrong infirmation of TCA’s predictions.
This temporality problem is sharpened by “governance inseparabilities” (Argyres and Libeskind, 1999) that limit the firm in realigning its governance mode to transition’s attributes. Indeed, the governance mode can be linked inseparably to the governance mode of another transaction in which the firm is engaged. Consequently, a change in transaction attributs will not necessarily result in the firm’s governance mode realignment. More recently, Argyres and Zenger (2007: 11) pointed out the need for interpreting boundary decision in a dynamic way so as to separate the “origin” of the decision from its “persistence”. The chosen method based on a mix between a questionnaire ad interviews constitutes an answer to overpass the problem described above.
MEASURES
20 Risks inherent to temporality problems have been discussed in Ghozzi H., « Des difficultés de test de la TCT et des précautions à prendre : Illustration du secteur avicole français », 2008, Association Internationale du Management Stratégique- Nice, Sophia- Antipolis.
Conceptual dimensions were hypothesized to be representable by a pool of items. These latter were developed from commonly accepted theoretical definitions that were readapted to poultry industry’s specific issues. Measures were then discussed with professors and Phd students familiar with that problematic. Finally, the questionnaire was pilot-tested with five “upward” directors, met during a professional workshop21 so as to make sure that the vocabulary used reflected as much as possible issues of the present sector.
DEPENDANTVARIABLEOPERATIONALIZATION
Dependant variables reflected the degree of vertical integration of each group studied in the two activities considered. Groups were asked to determine the percentage of activity undertaken through spot market, contractual agreement and vertical integration. For each activity, four main options exist: spot market, contractual arrangement, vertical integration, or a mixed mode22 (Parmigiani, 2007), including the use of different modes at a time.
Empirical survey showed that these different modalities were not used with the same intensity. The following table (See table 3) shows that spot market is never used (neither as a unique mode nor as a mixed mode), whereas groups use integration, contractual agreements or a combination of both. Moreover, while hatchering activity is more often undertaken through contractual agreements, feed production is generally fully integrated.
As the spot market is never used, dependant variable has first been reduced to a binary modality. However, the importance of mixed modes including the combination of integration and contractual agreements added more complexity to the treatment of the dependant variable. Following Monteverde and Teece (1982) who define as “integrated” as when an activity is integrated at more than 80%, we reduced dependant variable to a binary modality quoting “0” non integrated groups and “1” groups that integrated at least a part of the activity23.
Table 3 : G overnance modes through hatchering and feed production.
21 The « SPACE », Salon des Productions Animales.
22 This form has also been qualified as « plural mode » by Bradach and Eccles (1989). 23 Groups studied integrated at least 60% of the activity.
INDEPENDENTVARIABLESOPERATIONALIZATION
Ten constructs were hypothesized24 to be represented by a pool of 31 item measures that were all measured on a five point Likert-type scale. Measures presented below concern hatchering activity; they are duplicated for what concerns feed production.
Asset Specificity. Williamson stresses essentially the degree of transferability of assets that supports a given transaction. However, it appears important to distinguish between at least three types of transferabilities: towards another activity, another user (Amit et Zott, 2006), as well as transferability of the final output (Brousseau, 1993). Hence, an activity can become specific as it is supported by assets that cannot be redeployed to another activity, i.e. hatchering equipments cannot easily be used for producing feed or for growing chicks. Activity can also become specific as requirements differ from a user to another resulting in difficult redeployments towards another user. Finally, specificity can also concern the final output, as a product ordered with specific characteristics cannot be easily transferred to another group in case of contract suspension.
Measures relative to specificity are abundant; David and Han (2004) underline at least 27 measures. Five statements adapted from prior work were included in the survey:
(i) Your groups orders chick’s with particular characteristics (Chick-spec)
(ii) Hatchering equipements can be used in another activity without loosing their value (Spec-eq-hat)
(iii) Your group had to invest with hatcherers (Inv-gp-hat)
(iv) Hatcherers needed to put in place particular investments to meet your requirements (Inv-eqp-hat)
(v) Modifications undertaken by hatcherers limited them in putting in place a contract with another group (Contr-lim-hat)
24 If we take into account the tree types of specificity and the two types of uncertainty.
Hatchering
Total Frequency
Feed production
Total Frequency
Three mixed modes Spot market/Contract/ Integration 0 0% 0 0%
Two mixed modes
Spot market/ Contract 0 0% 0 0%
Contract/Integration 5 35,7% 4 28,6% Spot market/integration 0 0% 0 0% A unique mode Spot market 0 0% 0 0% Contract 8 57,2% 2 14,2% Integration 1 7,1% 8 57,2% 16
Human Specificity. The two items included in the survey are essentially declined from Anderson and Schmittlein (1985) and Klein, Roth, and Frazier (1990). They represent the degree to which the activity requires personalized skills.
(i) Hatcherers need a lot of time to be able to deliver products that meet your own requirements (Spec-tim-hat)
(ii) A Hatcherer that has assimilated your way of working could cause important damages if he worked with your competitors (Spec-risk-hat)
Site specificity. Two items were included to measure whether the group and its supplier are in a “cheek-by-jowl” relationship, leading to a geographical dependence.
(i) Hatcherers have voluntarily been sited next to your group (Sit-hat) (ii) Your group has voluntarily been sited next to hatcherers (Sit-gp-hat)
Opportunism. Measures reflect the extent to which the group perceives the supplier as unique and difficult to replace. The five items included in the survey are adapted from John and Weitz (1989), Heide (1994) and Poppo & Zenger (1998)’s operationalizations of the small number situation that sharpens opportunistic behaviour.
(i) Hatcherers are easily replaceable (Replac-hat)
(ii) Hatcherers can easily contract with another group (Oth-cont-hat) (iii) It is costly to change hatcherer (Cost-chg-hat)
(iv) It takes a lot of time to replace a hatcherer (Tim-replc-hat) (v) It is costly to modify hatcherers’ contracts (Cost-mod-hat)
Environmental uncertainty. This variable was operationalized by asking respondents to answer about the perceived unpredictability of chicken demand as well as price volatility of each product, respectively chicks delivered by hatchereres and feed product delivered by feed producers. We also measured the perceived difficulty of bargaining if disturbances do occur.
(i) Chicken demand is easy to forecast (Dd-hat) (ii) Chicks prices’ are volatile (Pric-Chick)
(iii) If the demand exceeds forecast, it is easy to order a greater volume of chicks
(Increa-vol-hat)
(iv) If the demand is below forecast it is easy to diminish volumes ordered
(Deacr-vol-hat)
Behavioural uncertainty. This dimension was operationalized as the degree of difficulty associated with assessing partners’ performance. Two main items were included in this survey:
(i) It is easy to evaluate hatcherers’ contribution to the final output (Contrib-hat) (ii) In case of inefficient output or sanitary problems, it is easy to determine
Strategic aspect. This dimension has fewer operationalizations. Moreover, it appeared difficult to put in place measures that are not tautological. Three items aimed at measuring the degree to which an activity is perceived to be close to the firm’s core competencies, therefore offering value as well as differentiation from competitors.
(i) Hatcherering activity seems to be a strategic stage of the whole chain (Strat-hat) (ii) Hatcherering activity seems close to your core competencies (Core-hat)
(iii) Hatchering activity offers to the group a better differentiation from its competitor
(Differ-hat)
Differential capabilities. This dimension is the most frequently used when testing knowledge- based view. Operationalization is mainly adapted from Argyres (1996), Hoetker (2005) and Parmigiani (2007). “Temporality problem” discussed above made us employ the concept of “expected superior capabilities” rather than “effective superior capabilities”. Indeed as stressed by Argyres and Zenger (2007) and Jocobides and Hitt (2005), a group undertaking an activity for the first time can hardly possess superior capabilities. However, we think that a group, dissatisfied with the quality of his supplier, expects he can obtain superior capabilities. This dimension was measured throughout three items:
(i) Hatchering is based upon a complex process (Complex-hat)
(ii) You possess (can easily put in place) greater production experience and/or organizational skills (i.e., 'capabilities') than potential suppliers (Poss-comp-hat) (iii) It is difficult to put in place skills and know-how to undertake hatchering activity (Diff-comp-hat)
Complementarity. This measure represented the degree to which the activity is considered to be related to other assets of the firm. Only a few studies attempted to measure complementarity (Steensma and Corley, 2000). We introduce three concepts:
(i) Hatchering activity needs competencies that the firm already possesses
(Comp-hat)
(ii) Your group owns assets (buildings, transport materiel..) that could be used to undertake hatchering activity (Equip-hat)
(iii) Internalizing hatchering activity would result in important synergies with the other activities of the group (Synerg-hat)
Interdependence. We could not find any empirical study attempting to operationalize this concept. We therefore chose two items measuring the degree to which the activity is perceived to be linked to the other activities of the group, as well as the difficulty to exchange with an external supplier:
(i) Changes in Hatchering activity considerably affects the other activities of the group (chg-hat)
(ii) It is easy to coordinate with hatcherers (Coord-hat)
3. RESULTS AND DISCUSSION ANALYSISPROCEDURES
TCA and RBV predictions were confronted to a total of 28 vertical integration decisions: 14 relative to hatchering activity and 14 to feed production. Quantitative method was chosen to offer an overview of groups’ perceptions, since a qualitative analysis seemed insufficient to deliver global conclusions. Even though the population was narrow for using such a method, it remained possible to undertake descriptive statistics over almost the entire population. Therefore, descriptive statistics based upon simple regressions undertaken under SPSS constituted an appropriate method.
Following Maltz (1993), we compared integrated and non-integrated groups’ perceptions. Hence, if predictions are correct, the two groups should differ on the dimensions studied. Coefficient of determination R² offered a first representation of the extent to which the studied dimension explains the different degrees of vertical integration among the two groups. Then, coefficient of regression β checked whether the correlation between the two variables followed theory’s prediction25. Finally, as our study relying on descriptive statistics, we had to build our own decision rule for classifying the degree of confirmation of the predictions tested. The following table clarifies the classification chosen.
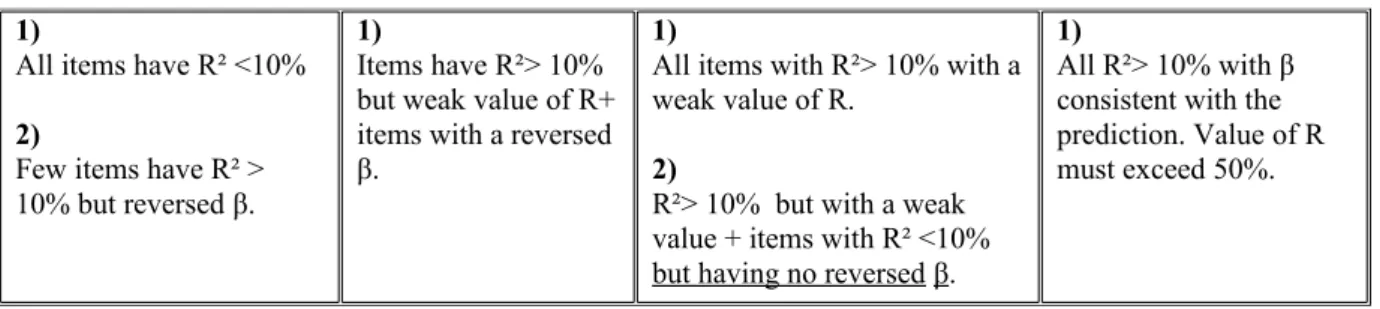
Table 4: Classification citerions
Seems Inconsistent Seems partly
inconsistent Seems partly consistent Seems consistent
25 Studying the only R² was insufficient. Indeed, R² expresses differences between the two groups without indicating if the perceived situation is adequate to the prediction or reversed. In fact, an important R² can possess a reversed effect, leading to a high contradictory prediction. Therefore, β tells if the groups that integrate have a higher (or lower) average perception than those who don’t.
1)
All items have R² <10%
2)
Few items have R² > 10% but reversed β.
1)
Items have R²> 10% but weak value of R+ items with a reversed β.
1)
All items with R²> 10% with a weak value of R.
2)
R²> 10% but with a weak value + items with R² <10% but having no reversed β.
1)
All R²> 10% with β consistent with the prediction. Value of R must exceed 50%.
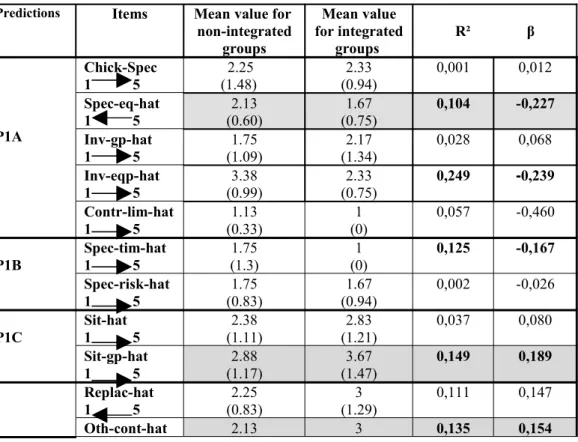
Even though this decision rule is limited, it enables to compare global degree of confirmation (or infirmation) of the predictions studied. Let us now illustrate this method considering a detailed example of physical asset specificity in hachering activity. The present table reports for each item, the mean value within groups, standard deviations, R² and β. Coloured rows emphasize items that follow the theory’s prediction.
Table 5: Illustration based e xample.
TCT Hatchering
Item décrit Mean value for non-integrated groups Mean value for integrated groups R² β P1A Physical asset Specificity Chick-Spec 1 5 (1.48) 2.25 (0.94)2.33 0,001 0,013 Spec-eq-hat 1 5 (0.60)2.13 (0.75)1.67 0,104 -0,227 Inv-gp-hat 1 5 1.75 (1.09) 2.17 (1.34) 0,028 0,068 Inv-eq-hat 1 5 3.38 (0.99) 2.33 (0.75) 0,249 -0,239 Contr-lim-hat 1 5 1.13 (0.33) 1 (0) 0,058 -0,460
This table first shows that mean values between the two groups are quite similar. Two items possess an R² superior to 10%. “Inv-equip-hat” possesses an R² explaining 25% of the differences among the two groups. However, the negative coefficient of regression indicates that the more hatcherers invest, and the less likely do groups integrate, which is contrary to the prediction. “Spec-eq-hat” explains 10,4% of vertical integration variation. However this item remains weak as non-integrated group also consider that equipments used for this activity are difficult to redeploy towards another activity. Consequently, among the five tested items, three possess an R² inferior to 10%, “Inv-eq-hat” shows a reversed relationship, and, even though its R² remains weak (10,4%), “Spec-equi-hat” follows theories’ prediction. Therefore, it appears that prediction P1A seems to be inconsistent with TCA.
This same method has been applied for each prediction studied. Results presented in what follows only provide aggregated conclusions.
RESULTS
T
ransactional predictions
TCT confronted to Hatchering activity
Results reported in table 6 indicate that transaction cost predictions do not explain vertical integration variance activity among groups. We can first notice homogeneous perceptions whether they are integrated or not. Then, a study of coefficients of determination and regression for each item studied shows that predictions seem to be partly inconsistent with this approach. Indeed, among the 20 items tested, 15 are inconsistent with the prediction (representing 75%); since they do not explain the variation, or show a reversed relationship. Therefore, as detailed in table 8, 12 items possess a low R² (inferior to 10%) and 3 offer a reversed correlation. Even though the five remaining items possess an R² superior to 10%, the value of R² remains low, as it is ranges between 10 and 14.9%. As explained above, equipments transferability has a weak effect on the degree of vertical integration variance; it is also the case for site specificity, supplier’s contribution, cost of contract modification, as well as demand volatility. Indeed, even though perceptions do differ, variance is too slight, and items tested only weakly predict differences among groups.
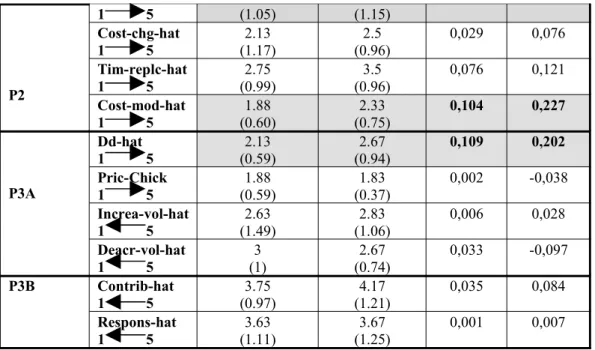
Table 6: TCT confronted to feed production activity. Predictions Items Mean value for
non-integrated groups Mean value for integrated groups R² β P1A Chick-Spec 1 5 (1.48) 2.25 (0.94)2.33 0,001 0,012 Spec-eq-hat 1 5 (0.60)2.13 (0.75)1.67 0,104 -0,227 Inv-gp-hat 1 5 (1.09)1.75 (1.34)2.17 0,028 0,068 Inv-eqp-hat 1 5 (0.99)3.38 (0.75)2.33 0,249 -0,239 Contr-lim-hat 1 5 1.13 (0.33) 1 (0) 0,057 -0,460 P1B Spec-tim-hat 1 5 1.75 (1.3) 1 (0) 0,125 -0,167 Spec-risk-hat 1 5 1.75 (0.83) 1.67 (0.94) 0,002 -0,026 P1C Sit-hat1 5 (1.11)2.38 (1.21)2.83 0,037 0,080 Sit-gp-hat 1 5 (1.17)2.88 (1.47)3.67 0,149 0,189 Replac-hat 1 5 (0.83)2.25 (1.29)3 0,111 0,147 Oth-cont-hat 2.13 3 0,135 0,154
P2 1 5 (1.05) (1.15) Cost-chg-hat 1 5 2.13 (1.17) 2.5 (0.96) 0,029 0,076 Tim-replc-hat 1 5 2.75 (0.99) 3.5 (0.96) 0,076 0,121 Cost-mod-hat 1 5 (0.60)1.88 (0.75)2.33 0,104 0,227 P3A Dd-hat 1 5 (0.59)2.13 (0.94)2.67 0,109 0,202 Pric-Chick 1 5 (0.59)1.88 (0.37)1.83 0,002 -0,038 Increa-vol-hat 1 5 (1.49)2.63 (1.06)2.83 0,006 0,028 Deacr-vol-hat 1 5 (1)3 (0.74)2.67 0,033 -0,097 P3B Contrib-hat 1 5 3.75 (0.97) 4.17 (1.21) 0,035 0,084 Respons-hat 1 5 (1.11)3.63 (1.25)3.67 0,001 0,007
Table 9 synthesizes the degree of confirmation of the different predictions tested. In fact, none seems to be completely consistent with TCA. While specificity and behavioural uncertainty are completely inconsistent, opportunism and environmental uncertainty are at least partly inconsistent. However, the latter is infirmed as soon as it is combined to specificity.
Relying on informants’ perceptions, specificity, opportunism and uncertainty do not seem to explain different extents of vertical integration as groups show quite similar perceptions whether they are integrated or not. Moreover, it is worthy to underline the fact that non-integrated groups’ perceptions seem to be consistent with their present structure. Indeed, for former, assets specificity, uncertainty and opportunism are perceived as low, which can explain their non- integrated structure.
TCT confronted to feed production activity
Results reported in table 7 also indicate that transaction cost predictions do not explain different degrees of vertical integration in feed production activity among groups and neither do they in hatchering activity. Indeed, we can notice similar perceptions among groups whether they are integrated or not. Then, the study of R² and β for each of the 20 items tested in feed production reveals that 18 are inconsistent with the prediction (representing 90%); either since they do not explain the variation, or that they show a reversed correlation. 16 items possess a low R² (below 10%) and 2 are inconsistent with the prediction (see table 8).
Non-integrated groups more likely agree with the fact that equipments can be easily used within another activity than integrated groups. Indeed, “Spec-eq-fp” explains differences among groups at over 23%. Furthermore, price volatility seems explicative of vertical integration differences at 26%. Yet, this dimension is annihilated as soon as uncertainty is combined with specificity.
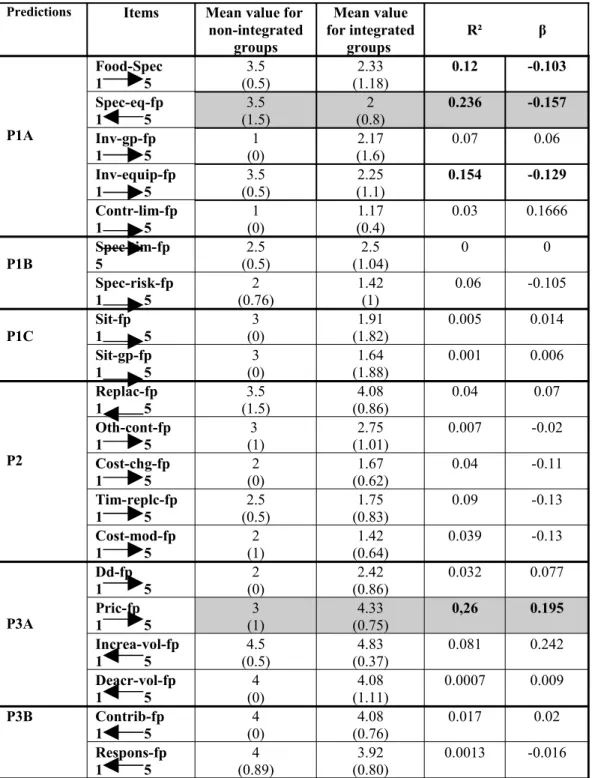
Table 7 : TCT confronted to feed production activity Predictions Items Mean value for
non-integrated groups Mean value for integrated groups R² β P1A Food-Spec 1 5 (0.5)3.5 (1.18)2.33 0.12 -0.103 Spec-eq-fp 1 5 (1.5)3.5 (0.8)2 0.236 -0.157 Inv-gp-fp 1 5 (0)1 (1.6)2.17 0.07 0.06 Inv-equip-fp 1 5 (0.5)3.5 (1.1)2.25 0.154 -0.129 Contr-lim-fp 1 5 (0)1 (0.4)1.17 0.03 0.1666 P1B Spec-tim-fp 5 2.5 (0.5) 2.5 (1.04) 0 0 Spec-risk-fp 1 5 2 (0.76) 1.42 (1) 0.06 -0.105 P1C Sit-fp1 5 (0)3 (1.82)1.91 0.005 0.014 Sit-gp-fp 1 5 (0)3 (1.88)1.64 0.001 0.006 P2 Replac-fp 1 5 (1.5)3.5 (0.86)4.08 0.04 0.07 Oth-cont-fp 1 5 (1)3 (1.01)2.75 0.007 -0.02 Cost-chg-fp 1 5 (0)2 (0.62)1.67 0.04 -0.11 Tim-replc-fp 1 5 2.5 (0.5) 1.75 (0.83) 0.09 -0.13 Cost-mod-fp 1 5 (1)2 (0.64)1.42 0.039 -0.13 P3A Dd-fp 1 5 (0)2 (0.86)2.42 0.032 0.077 Pric-fp 1 5 (1)3 (0.75)4.33 0,26 0.195 Increa-vol-fp 1 5 (0.5)4.5 (0.37)4.83 0.081 0.242 Deacr-vol-fp 1 5 (0)4 (1.11)4.08 0.0007 0.009 P3B Contrib-fp 1 5 4 (0) 4.08 (0.76) 0.017 0.02 Respons-fp 1 5 4 (0.89) 3.92 (0.80) 0.0013 -0.016
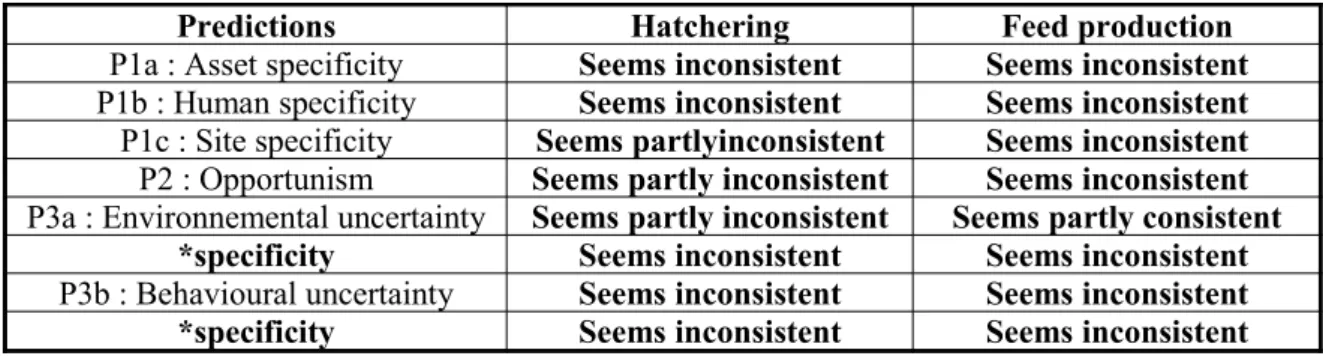
Table 9 synthesizes the predictions tested, showing that none seem to be consistent with TCA’s predictions. Indeed, all the predictions tested are inconsistent or party inconsistent with transactional predictions. Environmental specificity is the only prediction that is partly consistent with TCA, however it loses its consistency when combined with specificity. Informants’ perceptions show that specificity, opportunism and uncertainty do not seem to explain the reason why groups integrate this activity at different degrees. Once more, it is important to mention that non-integrated groups’ perceptions are consistent with their structure. Indeed, assets specificity, uncertainty and opportunism are perceived as low which can explain non integrated structure.
Table 8 : Transactional items within the two activities.
TCT within hatchering TCT within Food prediction
Total items tested 20
Total items rejected - R²<10% - β inversé 15 (75%) 12 (60%) 3 (15%) 18 (90%) 16 (80%) 2 (10%) Total items confirmed 5 (25%) 2 (10%)
Average R² of items with R²>10%
12% 24,8% Highest R² 14,9% 26%
Table 9 : Transactional predictions consistency within the two activities.
Predictions Hatchering Feed production
P1a : Asset specificity Seems inconsistent Seems inconsistent
P1b : Human specificity Seems inconsistent Seems inconsistent
P1c : Site specificity Seems partlyinconsistent Seems inconsistent
P2 : Opportunism Seems partly inconsistent Seems inconsistent
P3a : Environnemental uncertainty Seems partly inconsistent Seems partly consistent
*specificity Seems inconsistent Seems inconsistent
P3b : Behavioural uncertainty Seems inconsistent Seems inconsistent
*specificity Seems inconsistent Seems inconsistent
RCV predictions
RCV confronted to Hatchering activity
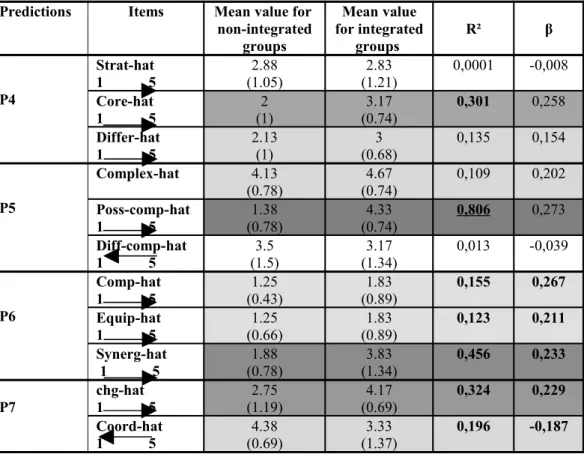
Items representing RCV’s main dimensions seem to offer important insights into vertical integration decisions. Among the 11 items tested, only two are eliminated (representing less than 20%), and none show a reversed relationship (see table 10 and 12). And, among the 9 remaining items, 4 possess coefficients of determination that are superior to 30%.
Even though the activity isn’t considered as strategic by the two groups, integrated groups more likely consider that the activity is included in their core competencies. Furthermore, it is worthy to highlight that “poss-comp-hat” accounts for 80% of the variation among groups. Therefore, it appears that if groups perceive they can put in place superior capabilities, they will increase the use of vertical integration. This item is even more significant than this activity seems highly complex and difficult to master26. Complementarity also plays an important role on vertical integration decisions as groups that integrate consider that the activity is highly strategic, and this item accounts for nearly half the variation of data (45%). Finally, interpendence seems more important for integrated groups, which is consistent with Grant’s prediction.
Table 10: RCV confronted to hatchering activity.
Predictions Items Mean value for non-integrated groups Mean value for integrated groups R² β P4 Strat-hat 1 5 (1.05)2.88 (1.21)2.83 0,0001 -0,008 Core-hat 1 5 (1)2 (0.74)3.17 0,301 0,258 Differ-hat 1 5 2.13(1) (0.68)3 0,135 0,154 P5 Complex-hat 4.13 (0.78) (0.74)4.67 0,109 0,202 Poss-comp-hat 1 5 (0.78)1.38 (0.74)4.33 0,806 0,273 Diff-comp-hat 1 5 3.5 (1.5) 3.17 (1.34) 0,013 -0,039 P6 Comp-hat 1 5 1.25 (0.43) 1.83 (0.89) 0,155 0,267 Equip-hat 1 5 (0.66)1.25 (0.89)1.83 0,123 0,211 Synerg-hat 1 5 (0.78)1.88 (1.34)3.83 0,456 0,233 P7 chg-hat1 5 (1.19)2.75 (0.69)4.17 0,324 0,229 Coord-hat 1 5 (0.69)4.38 (1.37)3.33 0,196 -0,187
Therefore, it clearly appears that even though all items are not completely consistent with RCV’s predictions, they are much more consistent in explaining different vertical integration among groups than TCA’s items (see table 13).
It is also important to underline that items that are not highly supported do not explain vertical integration variances. However, they are confirmed for non-integrated groups. Indeed, the
26 These two item constitue meditor variables that influence (increase or decrease) the importance of the role of differential capabilities.
latter consider that the activity is not strategic; it does not differentiate the group. They also consider they do not possess skills and equipment that can be used for this activity.
RCV confronted to feed production activity
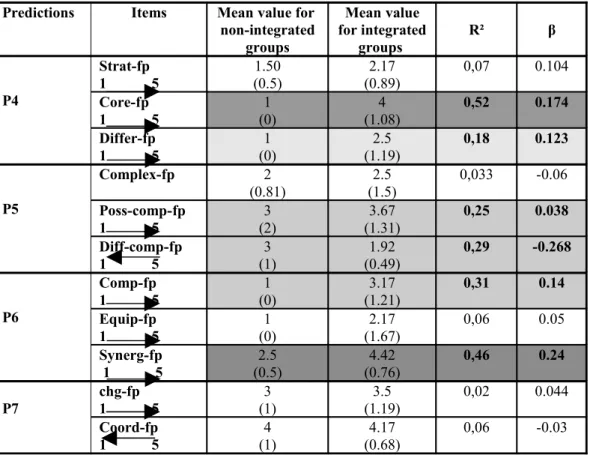
A detailed analysis shows that among the 11 tested, 5 are eliminated (representing 45%) since they possess low R², and no items show a reversed correlation. The six remaining items possess R² ranged between 18% and 52% (see table 11and 12). The most significant items are relative to the “core competencies” and “synergies” dimensions.
Table 11: RCV confronted to feed production activity.
Predictions Items Mean value for non-integrated groups Mean value for integrated groups R² β P4 Strat-fp 1 5 1.50 (0.5) 2.17 (0.89) 0,07 0.104 Core-fp 1 5 (0)1 (1.08)4 0,52 0.174 Differ-fp 1 5 (0)1 (1.19)2.5 0,18 0.123 P5 Complex-fp 2 (0.81) (1.5)2.5 0,033 -0.06 Poss-comp-fp 1 5 (2)3 (1.31)3.67 0,25 0.038 Diff-comp-fp 1 5 3 (1) 1.92 (0.49) 0,29 -0.268 P6 Comp-fp 1 5 1 (0) 3.17 (1.21) 0,31 0.14 Equip-fp 1 5 1 (0) 2.17 (1.67) 0,06 0.05 Synerg-fp 1 5 (0.5)2.5 (0.76)4.42 0,46 0.24 P7 chg-fp1 5 (1)3 (1.19)3.5 0,02 0.044 Coord-fp 1 5 (1)4 (0.68)4.17 0,06 -0.03
Among the 4 predictions tested in feed production, 3 seem to be partly consistent whereas one is inconsistent. Therefore, even though RCV is more consistent than TCA in explaining vertical integration variance in feed production, still, the former is less confirmed than in hatchering activity ( See table 13).
Furthermore, it is important to mention that RCV predictions are more often confirmed for non-integrated groups. In fact, the two types of group consider that the activity is not strategic and does not differentiate the group from its competitors. Moreover, both consider not possessing complementary assets.
Table 12 : RCV’s items within the two activities.
RCV within hatchering RCV within feed production
Total items tested 11
Total items rejected - R²<10% - β inversé 2 (18%) 2 (18%) 0 (0%) 5 (45%) 5 (45%) 0 (0%) Total items confirmed 9 (82%) 6 (55%)
Average R² of items with R²>10%
29% 33,5% Highest R² 80,6% 52%
Table 13 : Transactional predictions consistency within the two activities.
Predictions Hatchering activity Feed production
P4 : Strategic aspect of the activity Partly inconsistent Partly consistent
P5 : Differential capabilities Consistent Partly consistent
P6 : Complementarity Partly consistent Partly consistent
P7 : Interdependence Partly consistent Inconsistent
DISCUSSION
Results emerging from this study first show that central predictions constituting these approaches are not highly confirmed; the highest item explains the variance at 80%, and the others between 10% and 53%. Moreover, the simultaneous consistency of predictions related to the two approaches suggests that vertical integration decisions are influenced by both approaches (Madhok, 2002). Finally, these results put in light a “contingent” empirical support for each theory studied.
Indeed, the two approaches tested are not equally confirmed or infirmed depending on the activity considered, and more surprisingly, according to the degree of vertical integration studied. In fact, TCA’s central predictions are less confirmed than RCV’s. On the one hand, TCA is slightly more confirmed in hatchering activity than in feed production. Hence, while 25% of the items are partly consistent with the prediction in hatchering activity, only 10% of the former are consistent in feed production. On the other hand, RCV seems to be more relevant in hatchering activity than feed production activity, especially for what concerns the prediction relative to differential capabilities. This result is sharpened by the fact that hatchering activity is more often undertaken under contract (14%) than feed production (57%) which confirms TCA more frequently in the latter. This raises the question about the reason
explaining the high integration in feed production27. This first result is unsurprising; Conner (1991:143) already stipulated this point:
« Empirically, there is no reason why it might not be observed that some integration decision seem to turn on specific asset creation/ redeployment issues, and others on reducing opportunistic potential. A fruitful area for further theory development may be exploration of situations in which integration decisions can be expected to depend on one or the other of these considerations, or a combination».
Moreover, it has also been empirically demonstrated by Argyres (1996). He showed that different stage in the production of television cables within a group can be determined by factors related either to TCA or to RCV.
Besides, a second finding also worthy of discussion is that the two approaches are more consistent for the non-integrated structure. Thus, these approaches are in fact more relevant in explaining non-integration decision, especially TCA. Indeed, it appeared that items that predict non-integrations decisions do not manage to take in charge the explanation of integration decision; the latter being probably driven by other dimensions. This result follows the same standpoint than Parmigiani (2007: 286) which explains that « The choices that motivate the firm toward making may not be the same as those motivating it away from buying ». As a result, an approach can be relevant for explaining a particular structure and without necessarily providing motivating forces along the whole continuum.
CONCLUSION
We have attempted to provide some substance to the long-standing debate over the dominance of the two leading approaches dealing with the “make or buy” decisions. This research has therefore put in light the central predictions constituting these approaches, and operationalized key dimensions by a pool of items. The model has been tested within the main groups of the French poultry industry. Data was collected through a method combining interviews and quantitative tests to overpass the “temporality problem”. Results essentially pointed out a “contingent” confirmation of these approaches that are not equally confirmed depending on the activity considered, and, in regard to the degree of vertical integration considered.
27 Further test undertaken throughout our Phd thesis shows that this activity is in fact integrated for reasons belonging to « Industrial Economics », especially scale and scope economies.