HAL Id: tel-02882220
https://pastel.archives-ouvertes.fr/tel-02882220
Submitted on 26 Jun 2020HAL is a multi-disciplinary open access archive for the deposit and dissemination of sci-entific research documents, whether they are pub-lished or not. The documents may come from teaching and research institutions in France or abroad, or from public or private research centers.
L’archive ouverte pluridisciplinaire HAL, est destinée au dépôt et à la diffusion de documents scientifiques de niveau recherche, publiés ou non, émanant des établissements d’enseignement et de recherche français ou étrangers, des laboratoires publics ou privés.
Tao Xiang
To cite this version:
Tao Xiang. Combined purebred and crossbred information for genomic evaluation in pig. Zootechny. Institut agronomique, vétérinaire et forestier de France; Aarhus universitet (Danemark), 2017. English. �NNT : 2017IAVF0014�. �tel-02882220�
T
HESE DE
D
OCTORAT
préparée à
l’Institut des sciences et industries du vivant et de l’environnement
(AgroParisTech)
pour obtenir le grade de
Docteur de l’Institut agronomique, vétérinaire et forestier de
France
Spécialité : Génétique Animale
École doctorale n°581
Agriculture, alimentation, biologie, environnement et santé (ABIES)
par
Tao XIANG
COMBINED PUREBRED AND CROSSBRED INFORMATION FOR
GENOMIC EVALUATION IN PIG
Directeur de thèse : Andres LEGARRA
Co-directeur de la thèse : Ole Fredslund CHRISTENSEN
Thèse présentée et soutenue à Aarhus University, Denmark, le 8 septembre, 2017 : Composition du jury:
M. Bernt GULDBRANDTSEN, Associate professor, Aarhus University Rapporteur, Président
M. Mario CALUS, Senior Researcher, Wageningen University Rapporteur
M. Jörn BENNEWITZ, Professor, University of Hohenheim Rapporteur
Mme Zulma Vitezica, Associate professor, Institut National Polytechnique de Toulouse Examinateur
Mme Birgitte ASK, Chief researcher, Danish Pig Research Center, SEGES Examinateur
M. Andres LEGARRA, Research director, INRA Directeur de thèse
M. Ole Fredslund CHRISTENSEN, Senior researcher, Aarhus University Co-directeur de thèse
GenPhySE, INRA QGG MBG, Aarhus University
The thesis is dedicated to the memory of my paternal grandfather and maternal grandfather.
I deeply miss you.
Table of Contents
Preface ... 1
List of Abbreviations ... 3
Chapter 1: General Introduction ... 5
Chapter 2: Paper I ... 25
Chapter 3: Paper II ... 55
Chapter 4: Paper III ... 79
Chapter 5: Paper IV ... 97
Chapter 6: General Discussion ... 127
Chapter 7: Conclusions ... 141
Individual Training ... 142
Dissemination of Knowledge ... 143
Abstract ... 145
1
Preface
This thesis is submitted to The Graduate School of Science and Technology (GSST), Aarhus University, Denmark and Doctoral School of Agriculture Food Biology Environment Health (ABIES), AgroParisTech, France in fulfilment of requirements for the double PhD degrees. The PhD project was carried out at the Center for Quantitative Genetics and Genomics (QGG), Department of Molecular Biology and Genetics, Aarhus University, Tjele over the period 2013.09~2015.08 and 2016.09~2017.06, and Génétique Physiologie et Systèmes d'Elevage (GenPhySE) laboratory, Animal Genetics Division, INRA, Toulouse over the period 2015.09~2016.08. This PhD project was funded by Erasmus-Mundus Joint Doctorate program “European Graduate School in Animal Breeding and Genetics (EGS-ABG)”, Aarhus University and Danish Pig Research Center, SEGES, Denmark.
My deepest gratitude goes first and foremost to my main supervisors, Ole Fredslund Christensen and Andres Legarra. Thank you very much for your great guidance and constant encouragement during the 4 years! I have been incredibly fortunate to have such two outstanding and gracious supervisors. You gave me enough freedom to explore areas of interest and guidance to a correct direction. You always taught and inspired me with great patience. Your continuous help and support made me more and more confident, independent and be fond of doing research. You two make my graduate experience be one that I will cherish forever!
I am also deeply indebted to my co-authors of papers. They are: Bjarne Nielsen and Tage Ostersen, from Danish Pig Research Center; Guosheng Su and Peipei Ma, from QGG; Zulma Gladis Vitezica, from INP, ENSAT, Université de Toulouse. Thank you for making substantial contributions to this thesis. Your valuable comments and instructions made my PhD study go straightforward.
I would like to express my gratitude to all those who helped me to make the PhD study possible. Particularly, I owe a special debt of gratitude to Per Madsen, for many instructive advices that helped me to solve practical problems in running DMU; Bernt Guldbrandtsen, for great help in programming in Perl and shell scripts; Elise Norberg and Louise Dybdahl Pedersen, on whom I can rely, for giving many useful suggestions and promoting my family reunion; Luc Janss, Jan Lassen, Daniel Sorensen, Beatriz Castro Dias Cuyabano, Pernille Merete Sarup, Goutam Sahana, and Anders Christian Sørensen for giving me a first look into the world of quantitative genetics, linear models, Bayesian theories, gene mapping, and breeding program etc.; Tina Vammen, Cindie Deleuran, and Karin Smedegaard, for expert guidance in coping with practical issues; Mogens Sandø Lund, and Just Jensen for their constructive advices to the thesis through different kinds of discussions; Llibertat Tusell Palomero, Eduardo Manfredi and Jérôme Raoul, for timely help to make my life in France convenient and enjoyable.
My sincere thanks would go to my current and former office mates: Dario Fe, Rafael Pimental Maia, Xiujin Li, Silvia Rodriguez Ramilo, Carolina Andrea Garcia-Baccino, Ahmed Sayed Ismael, Grum Gebreyesus, Lu
2
I would like to acknowledge my Chinese friends and buddies in Denmark and France. You made my life so colorful and wonderful! Excuse me for not listing a long list of your names.
Finally, my heart swells with gratitude to my beloved parents and wife - Fang Fang. I greatly appreciate your continuous support, understanding, tolerance, and endless love. Thanks for having you along the way! I love you!
Tao Xiang (项韬) June 6, 2017, Tjele
3
List of Abbreviations
EBV: Estimated breeding value
GBLUP: Genomic best linear unbiased prediction GLS: Generalized least squares
GS: Genomic selection LD: Linkage disequilibrium LL: Landrace
LY:
Landrace_Yorkshire crossbreds
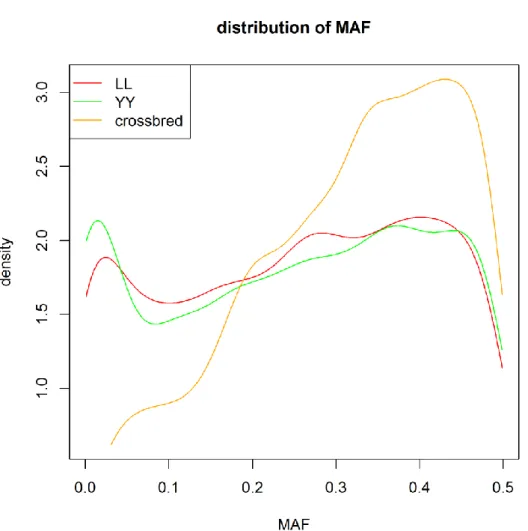
MAF: Minor allele frequencyNUH: Number of unique haplotypes PCA: Principal components analysis PSH: Proportion of shared haplotypes QTL: Quantitative trait locus
SEP: Standard error of prediction SNP: Single nucleotide polymorphism
ssGBLUP: Single-step genomic best linear unbiased prediction TNB: Total number of piglets born
YL: Yorkshire_Landrace crossbreds
5
CHAPTER 1
General Introduction
The “crossbred animals” section in page 10 and “single-step GBLUP method” section in page 15
are expansions of the introduction part in my mid-term qualifying examination progress report.
6
In this general introduction, the use of crossbred animals in meat production is first introduced. It is well known that crossbred animals perform better than purebred animals due to the heterosis and complementarity. The genetic background of heterosis and researches on heterosis and dominance effects are then reviewed. Genomic selection in pigs, especially for crossbred performance is described in the next paragraph. Among approaches for genomic selection, the single-step method can overcome the issue that not all the involved animals are genotyped. The current development of single-step method is then described. Next, a new concept of metafounder is introduced. With this new concept, single-step method can be executed in another way for crossbred performance. Then studies about genotype imputation and the trait of total number of piglets born are introduced. Finally, the general goals of this thesis are presented.
Crossbred animals
Crossbreeding is used for producing final production animals whose sires and dams originate from different breeds or lines (Falconer and Mackay, 1996). Crossbreeding is used in almost all species of livestock, especially intensively for pig and chicken (Wei, 1992). In the pig industry, usually, breeding companies manage the pure breeds and run the selection program. Purebred animals are bred in nucleus herds, where the environment is controlled in high hygienic status and performance recording systems are standardized (Dufrasne, 2015). Two-way crossbred sows (F1 sows) are produced and fed in the multiplier herds, where environment is controlled at a medium hygienic status, and sold to the sow farmers. Then sow farmers produce the three-way crossbred pigs by using F1 sows and boars that are from a third breed. Three-way crossbred pigs in fattening farms are sold to the slaughterhouses and finally, pork enters the market (Van Arendonk et al., 2010). In Denmark, Danish Landrace (L) and Yorkshire (Y) are used as dam lines to reproduce the F1 sows (either LY or YL) while the Danish Duroc (D) is used as boar line in the three-way crossbreeding programs (Sørensen, 2003). This thesis will concentrate on the two-way crossbreeding system. The increased performance of crossbred animals compared to purebred animals is attributable to heterosis effects and complementarity between breeds (Wei and van der Werf, 1994). In crossbreeding, heterosis is a specific combining ability of two breeds, instead of two individuals, that lead to the crossbred offspring performs better than the average of the purebred parental breeds (Falconer and Mackay, 1996). Another advantage of using crossbreeding is to utilize breed complementarity. For instance, F1 sows have good maternal abilities whereas purebred boars have good meat production traits that are transmitted to the terminal pig. Crossbreeding can be optimized because it benefits from mating individuals from different breeds to maximize their strengths and minimize their weaknesses (Falconer and Mackay, 1996). In pig industry, pork producers widely use crossbred animals to improve commercial production traits (Hidalgo, 2015). However, the superiorities from the hybrids cannot be retained across generations. Thus, genetic selection programs mostly focus on pursuing genetic process in pure breeds, with the hope that this genetic
7 progress is also expressed at the crossbred performance level. Programs that select explicitly to improve the crossbred performance rather than purebred performance have always been proposed (Comstock et al., 1949; Hartmann, 1992), but their use is limited due to practical constraints (Wei and van der Werf, 1994).
Heterosis, dominance and inbreeding depression
There are two types of heterosis: individual and maternal heterosis (Falconer and Mackay, 1996). Individual and maternal heterosis originates from the genes of the individual itself and its dam, respectively. The maternal heterosis may influence the offspring through providing an environment related to dams. A typical example is that crossbred sows perform better in mother-care than purebred sows, and their offspring also show better performance than offspring of purebred sows (Van Arendonk et al., 2010). This is one of the reasons why fattening pigs usually have a crossbred mother.
In livestock and plant breeding, dominance has been widely considered as one of the main genetic basis for heterosis (Davenport, 1908; Bruce, 1910; Falconer and Mackay, 1996; Visscher et al., 2000). Dominance is a form of phenotypic robustness to mutations and a consequence of the behavior of the multi-enzyme systems (Bagheri and Wagner, 2004). In terms of gene action, interactions between alleles at the same QTL cause dominance (Su et al., 2012a). Through suppressing expression of the recessive deleterious alleles inherited from one parent and increasing expression of the dominant alleles inherited from another parent in the heterozygous loci, dominance contributes to the phenomenon of heterosis (Bruce, 1910; Jones, 1917). More specific, Falconer and Mackay (1996) formulated that, when parental populations are in Hardy-Weinberg equilibrium and random mating holds between the sires and dams, the heterosis in one locus in the F1 crossbred animals is equal to the dominance effect multiplied by the square of the differences of allele frequencies between the parental populations. Data analysis demonstrated that heterosis is mostly positive (Anous and Mourad, 1993; Mavrogenis, 1996; Shikano and Taniguchi, 2002). However, if the dominance effect in the heterozygous loci is negative, heterosis may be negative. Negative heterosis means the performance of the heterozygotes is lower than the average of both homozygotes (Hedgecock et al., 1995). With many loci, the overall heterosis is the effect summed over all the interactions between alleles, both due to dominance and epistasis (Falconer and Mackay, 1996). However, epistasis is commonly considered as playing a secondary or minor role in heterosis (Luo et al., 2001; Li et al., 2008) and the epistasis effects are ignored in this thesis.
According to studies, accuracies of estimated breeding values increase if dominance effects are included in the animal breeding genetic evaluation models (De Boer and Hoeschele, 1993; Zeng et al., 2013; Moghaddar et al., 2014; Sun et al., 2014). Theoretically, estimating dominance genetic effects accurately is beneficial for estimating allele substitution effects and improving the accuracies of estimated breeding values in genomic prediction (Toro and Varona, 2010). Compared with additive genetic variances, although dominance
8
variations are smaller, they are non-negligible (Misztal, 1997; Esfandyari, 2016). For purebred populations, dominance variation is expected to account for around 10% of total genetic variation (Toro and Varona, 2010), although it varies dramatically depending on the traits and species. In crossbred animals, dominance variation is expected to be larger than that in purebred animals (Su et al., 2012a) and the inclusion of dominance effects in the model is expected to yield higher accuracies in genetic evaluation for crossbred performance than for purebred performance (Lo et al., 1997; Su et al., 2012a). However, dominance effects haven’t been frequently used in traditional animal breeding models because it is very difficult to estimate dominant genetic parameters and effects accurately and the computational complexity for the inverse matrix of dominance relationships is high (Henderson, 1985). To estimate the dominance effects, usually, a large amount of dataset including a large ratio of full sibs is required (Misztal et al., 1998), but this is rarely the case.
With the continuously declining costs of genotyping, SNP markers are available for many specials. Estimates of dominant variations and dominance effects become feasible through using SNP markers. Recently, some studies were carried out on dominance effects, but mainly for purebred performances (Su et al., 2012a; Zeng et al., 2013; Ertl et al., 2014; Lopes et al., 2015). Limited number of studies tried to extend it to crossbred performance (Hidalgo, 2015; Esfandyari et al., 2016; Vitezica et al., 2016). For the crossbred performance, they used univariate genomic models, with variance components estimated based on either purebred genomic information or crossbred animals only. However, their conclusions on the needs of including dominance effects explicitly in the model are not consistent. More studies are needed to investigate the role of dominance in crossbred performance.
For modern animal breeding systems, because the earliest known ancestors arose from a common base population (VanRaden, 1992) and high intensity of long-term selection are kept processing (Rauw et al., 1998), all animals within a population are related and inbred to some extent. Inbreeding can be described as deviation of genotypic frequencies towards lower heterozygosity from expected proportions under Hardy-Weinberg. Genealogical inbreeding is due to mating of related individuals. The effect of inbreeding is to increase the number of homozygous loci per animal and increase the frequency of homozygote genotypes in an inbred population (Keller and Waller, 2002). The increased homozygotes lead to higher chances of deleterious alleles becoming homozygous and expressing themselves and the performance of associated traits decreased. This is known as the inbreeding depression (Charlesworth and Charlesworth, 1987). Inbreeding coefficient of an individual is the probability that at a random locus, both alleles are identical by descent (Falconer and Mackay, 1996). Several algorithms exist for calculating pedigree-based inbreeding coefficients (Tier, 1990; Meuwissen and Luo, 1992). With the availability of SNP markers, inbreeding coefficient of an individual can be easily calculated, directly from the genotypes, as the fraction of homozygous markers; for a general overview, see Silio et al. (2014). To distinguish such inbreeding
9 coefficient from the pedigree based one, SNP-based inbreeding coefficient is termed as “genomic inbreeding coefficient” (Leutenegger et al., 2006).
Genomic selection in (crossbred) pigs
Genomic selection was initially put forward by Meuwissen et al. (2001) and became feasible for the pig industry after the release of the commercial 60K SNP chip in 2009 (Knol et al., 2016). In genomic selection, genome wide distributed SNPs are used to capture the genetic variances for traits and the QTLs are assumed to be in LD with at least one of these SNP markers (Meuwissen et al., 2001). Factors that potentially affect the accuracy of genomic selection are: the density of SNP markers (Calus et al., 2008; Solberg et al., 2008), the LD between SNP and QTLs (Meuwissen et al., 2001; Wientjes et al., 2013), relationships between animals in the reference population and validation population (Habier et al., 2007; Hayes et al., 2009), the size of reference population (Goddard and Hayes, 2007; VanRaden et al., 2009), etc. It has been proved that the reliability in genomic prediction is higher than the pedigree-based prediction (BLUP), but the advantages vary according to the traits and species (Hayes et al., 2009; Tusell et al., 2013).
Genomic selection has been successfully applied in purebred performance (Hayes et al., 2009; Lillehammer et al., 2011), but has been rarely investigated in crossbred performance. Due to the genotype-by-environment interactions, the presence of non-additive genetic effects and the allele frequencies are dissimilar in different breeds (Wei and Steen, 1991; Dekkers, 2007), the genetic correlation of breeding values between purebred and crossbred performances (𝑟𝑝𝑐) is usually lower than 1 (Wei and van der Werf, 1994; Lutaaya et al., 2001). The performance of purebred parents cannot be used to predict the performance of their crossbred offspring accurately when the 𝑟𝑝𝑐 is considerably lower than 1 (Dekkers, 2007). Ideally, to implement genetic
evaluation for crossbred performance, collecting data from both purebred and crossbred animals is required (Wei and van der Werf, 1994). However, due to the complexities of collecting pedigree information and high costs of collecting phenotypes from crossbred animals, it is rare to have access to both purebred and crossbred information.
Several studies have been carried out on crossbred performance by using genomic selection. Dekker (2007) found crossbred selection resulted higher genetic gains in crossbred performance and lower rates of inbreeding than purebred selection or combined purebred and crossbred selection. They concluded that estimates of marker effects on crossbred performance enable an effective genomic selection for crossbred performance.
Ibáñez-Escriche et al. (2009) investigated crossbred performance by using phenotypes and SNP genotypes from crossbred animals and then applied the estimated SNP effects to genotypes obtained from purebred animals to predict their crossbred breeding values. Additionally, because effects of SNP markers may be
10
breed specific, they applied a model with breed-specific SNP effects to fit crossbred phenotypes. However, they concluded that when the marker density was high and purebred lines were closely related, a model that fit breed-specific SNP effects did not perform better than a model that fit across-breed SNP effects.
These conclusions were further confirmed in real dataset by Lopes (2016). He found accuracies of estimated breeding values from a model with breed-specific effects were equal to or only slightly higher than those from a model with across-breed effects, but prediction of crossbred sows was more accurate when training population consisted of crossbred animals rather than purebred animals.
The above mentioned approaches require collecting genotypes and phenotypes from crossbred animals, which is costly. Esfandyari et al. (2015) explored the possibilities of improving crossbred performance by using reference population consisted of only purebred animals. They compared the accuracy to that obtained by using a reference population consisting of only crossbred animals. However, results showed that to optimize the genomic selection on purebred animals for their crossbred performance, marker effects were better estimated based on crossbred data than on purebred data.
Hidalgo et al. (2016) also compared accuracies of genomic selection for crossbred performance by using reference populations consisting of either only crossbred or only purebred animals. They found that it is possible to predict crossbred performance by using crossbred training data alone, but the accuracies were lower than those from purebred training data, which were opposite to the above mentioned results. Nevertheless, Hidalgo et al. (2016) attributed their results to the data structure that (1) the reference size of crossbred population was small; (2) the low relationships between purebred and crossbred animals; (3) the high 𝑟𝑝𝑐(>0.90) lead to favor the purebred training population; and thus they announced that the results were not general.
All of the studies above commonly indicate that genomic selection offers opportunities for selecting purebreds for crossbred performance in pigs. All these studies used genomic models that assume that all animals belong to a single population, and variance components were only estimated based on either the genotyped purebred or crossbred animals. Wei and Van der Werf (1994) multiple-trait model was more sophisticated than these trait models, because not all the phenotypic records were used in these single-trait models and the potential genotype by environment or genotype by genotype interactions cannot be accounted as well in the single-trait models as in the multiple-trait model. Therefore, on the basis of the Wei and Van der Werf model, Christensen et al. (2014) incorporated genomic information to the model and extended the marker-based relationship matrices to the non-genotyped animals. This model can evaluate both purebred and crossbred performances simultaneously and integrate all the genomic and phenotypic information, which is a breakthrough. This method is an extension of a single-step BLUP method (Legarra et al., 2009; Christensen and Lund, 2010) from purebred performance to combined purebred and crossbred
11 performances. This method had not been evaluated in real dataset before this thesis, although Tusell et al. (2016) successfully applied a simplified Christensen model, which is also an extension of Wei and Van der Werf model, but only including purebred genotypes, in crossbred performance.
Single-step GBLUP method
Approaches of genomic selection generally require that all the involved individuals are genotyped (Meuwissen et al., 2001; VanRaden, 2008), which is currently unfeasible due to the restriction of high cost and practical constraints (Legarra et al., 2009). There is often no phenotype for the genotyped individual and vice versa. Legarra et al. (2009) and Christensen and Lund (2010) in parallel proposed a genomic evaluation method - “single-step genomic BLUP”, which can handle the situation where only parts of animals are genotyped. The method applies an integrated relationship matrix (𝐇 matrix) for all animals by blending the information of pedigree and genomic markers:
𝐇 = [
𝐀
11+ 𝐀
12𝐀
−122(𝐆 − 𝐀
22)𝐀
−122𝐀
21𝐀
12𝐀
−122𝐆
𝐆𝐀
−122𝐀
21
𝐆
],
where 𝐀 is the pedigree-based numerator relationship matrix, and matrices 𝐀11, 𝐀12, 𝐀21, 𝐀22 are
submatrices of 𝐀 matrix; subscript 1 and 2 indicated non-genotyped and genotyped individuals, respectively.
In the traditional BLUP method, pedigree-based numerator relationship matrix (𝐀 matrix) accounts for the family relationships, while in the classical GBLUP method, marker-based genomic relationship matrix (𝐆 matrix) accounts for relationships among all the genotyped individuals. GBLUP method performs better than traditional BLUP because the 𝐆 matrix is an improved estimator of true relationships among the genotyped individuals compared to the 𝐀 matrix (VanRaden, 2008). If all the involved animals are genotyped, the single-step method is the same as GBLUP method; if none of animals are genotyped, the single-step method becomes the traditional BLUP method. This method is termed as “single-step” method because it can handle both genotyped and non-genotyped animals at once. The influence of marker genotypes from genotyped animals on the non-genotyped animals is via the numerator relationships (Legarra et al., 2014). Alternatively, in a multiple-step genomic evaluation, usually, traditional genetic evaluation is processed as the first step and the estimated breeding values are used to create pseudo phenotypes (e.g: deregressed proofs) for the genomic evaluation step (Mäntysaari et al., 2011). Such multiple-step method could cause loss of information and lead to inaccuracies and biases (Legarra et al., 2014), which can be avoided by using single-step method (Aguilar et al., 2010; Forni et al., 2011).
Single-step method was shown to have the power of producing at least the same accuracies of GEBVs as GBLUP for genotyped pigs, but higher accuracies for estimating the EBVs in non-genotyped pigs than pedigree-based method (Christensen et al., 2012; Guo et al., 2014). Therefore, pig breeding companies Topigs Norsvin and PIC nowadays use single-step method as the standard tool for routine genetic evaluation.
12
Also, since October 2011, a routine single-step genomic evaluation system has been set up in DanAvl in Denmark. Single-step genomic evaluation was also tested in other species, such as dairy cattle (Gao et al., 2012), dairy sheep (Baloche et al., 2014) and broiler chicken (Simeone et al., 2012). However, all of these studies were carried out on purebred performance.
As mentioned above, crossbred performance is vital in pig industry, but the existing genomic selection methods for crossbred performance commonly require genotyping all the pigs. Therefore, Christensen et al. (2014) developed a single-step method for genomic evaluation of both purebred and crossbred performance in a two-way crossbreeding system. In this novel approach, two breed-specific partial relationship matrices (García-Cortés and Toro, 2006) across purebred animals and crossbred gametes were used. This approach was later termed as “partial genetic approach” by Christensen et al. (2015). Later, Christensen et al. (2015) further developed single-step method for three-way crossbred animals. Genomic evaluation for the three-way crossbred animals used either partial genetic approach or a “common genetic approach”, which was developed based on a new concept of metafounder (Legarra et al. 2015). Overall, single-step genomic method is theoretically available for both purebred and crossbred performance.
Metafounder
Christensen (2012) summarized two issues raised by the single-step genomic evaluation method. First, how to choose the allelic frequencies used in the genomic relationship matrix 𝐆. Theoretically, matrix 𝐆 depends crucially on the assumed base allelic frequencies (Toro et al., 2011). The allelic frequencies in the base population of the pedigree should be used (VanRaden, 2008), but these frequencies are rarely available (Christensen, 2012). The assumed base allelic frequencies change as the start of pedigree changes arbitrarily (Legarra et al., 2014). Second, single-step GBLUP requires that both genomic and pedigree-based relationship matrices (𝐆 and 𝐀 respectively) refer to the same (base) population so that the average of breeding values and genetic variances of base populations are comparable across the different measures of relationships (Legarra, 2016), but this is difficult in practice (Legarra et al., 2015). Thus, the second problem is how to achieve the compatibility between genomic relationships and pedigree-based relationships.
To overcome these two issues, Christensen (2012) modelled the likelihood of genotypes given the pedigree as a quantitative trait and then he marginalized (integrated out) the allelic frequencies from this likelihood. This resulted in an arbitrary reference for genomic relationship matrix with the allelic frequency fixed at 0.5 and referring the pedigree-based relationships to this base population. As a byproduct, the founders of base population become related, described by a parameter 𝛾 that determines the relationship and inbreeding of individuals in the base population. The assumption that founders of base populations are related is in accordance with the observed relatedness across base individuals based on the marker information from
13 genotyped animals (Ter Braak et al., 2010; VanRaden et al., 2011), although this assumption is contradictory to the usual assumption that base animals are unrelated. Then, instead of inferring the base allelic frequencies, ssGBLUP was altered to infer γ and another scaling parameter 𝑠, which can be interpreted as a counterpart of the heterozygosity of the markers in the base population (García-Baccino et al.,2017), that makes pedigree-based and genomic relationship matrices compatible (Christensen, 2012). García-Baccino et al. (2017) concluded that in a single population, methods of generalized least squares and maximum likelihood can efficiently estimate an unbiased γ in single-step approach with one metafounder. Overall, contrary to the usual adjustment of genomic relationships to be compatible with pedigree-based relationships (Vitezica et al., 2011; Christensen et al., 2012), the pedigree-based relationship matrix needs to be adjusted to be compatible with marker-based matrix.
On the basis of Christensen (2012), Legarra et al. (2015) showed an equivalent idea about relationships within and across base populations as Christensen (2012) and developed a new concept of metafounders. A metafounder is a generalization of unknown parent groups (Kennedy, 1991) and can be understood as a finite-size pool of gametes, from which the founders of pedigree are drawn. The advantages of using the concept of metafounder over Christensen’s idea (2012) are (1) With metafounders added to the pedigree, regular methods to build and invert pedigree relationships in the new matrix 𝐀(γ)can be used with only minor modifications, and 𝐀(γ) is still a very sparse matrix; (2) genomic relationships and pedigree-based relationships are automatically compatible by construction if γ is estimated from marker genotypes (Christensen, 2012); (3) when analyzing multiple populations simultaneously, the concepts of metafounders can be easily extended from one to multiple base populations with relationships 𝚪 (a matrix instead of a scalar) across base populations. In short, the two mentioned issues in ssGBLUP can be resolved conveniently by the use of 0.5 allelic frequencies and metafounders.
Simulation studies on purebred performance showed that ssGBLUP with metafounders performed more accurate and less biased than the regular ssGBLUP method (Christensen, 2012; García-Baccino et al., 2017), but how genomic evaluation with metafounders perform in real data and for several populations and crosses was unknown before the thesis.
Genotype imputation
Genotype imputation is defined as the prediction of genotypes that are not genotyped (Marchini and Howie, 2010). Although the development of genotyping technologies has made it feasible to genotype animals in large scale, genotyping is still costly. Thus, to reduce the cost of genotyping, a possible way is to genotype a large number of animals by low-density SNP chips, while a limited number of individuals are genotyped with a high-density chip and regarded as a reference population for imputation. Then imputation is processed from low density to high density (Habier et al., 2009).
14
Imputation is generally considered as an initial step for genomic selection. As mentioned above, accuracies of genomic selection are affected by marker density and reference population size. Imputation can improve the call rate for SNP markers and individuals and thus it improves accuracies of genomic selection (Su et al., 2012b). Moreover, imputing missing genotypes that are not called by genotyping techniques is also required prior to genomic selection (Hickey et al., 2012a). For crossbred performance, genotypes come from multiple breeds and populations and sometimes are obtained from different chips. To combine different datasets, imputation should be used to infer those missing genotypes and it is essential to get same amount of markers for animals in different populations (Ma, 2013).
Several kinds of software have been developed for genotype imputation. Among them, some methods are based on the construction of a library of inferred haplotypes in the reference populations, and then the missing markers in the imputed animals are filled in according to the existing markers aligning to the inferred haplotypes (Ma et al., 2013). These methods depend crucially on local LD pattern across markers. Software based on such algorithms are e.g: Beagle (Browning and Browning, 2009), IMPUTE2 (Howie et al., 2009) and fastPHASE (Scheet and Stephens, 2006). Other imputation software rely on the combination of these libraries with the use of pedigree information, such as AlphaImpute (Hickey et al., 2012b) or FImpute (Sargolzaei et al., 2011). Ma et al. (2013) compared those software in imputing genotypes in dairy cattle and concluded that Beagle and IMPUTE2 are most accurate and robust for imputing genotypes from low density panel (3K) to moderate density panel (54K).
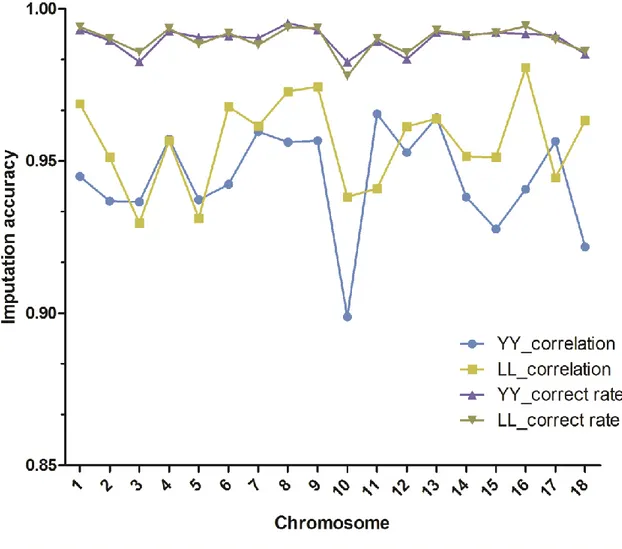
To measure the accuracies of imputation, most studies used correct rates between imputed and true genotypes, which is defined as the proportion of correctly imputed alleles (Zhang and Druet, 2010; Brøndum et al., 2012). However, this accuracy is allele-frequency dependent and favors markers with low minor allele frequencies. Therefore, correlation coefficients between true genotypes and imputed ones, which do not suffer these problems, are considered as a better way of measuring imputation accuracies (Hickey et al., 2012a).
It is rare to genotype crossbred animals, especially with moderate or high density chips. In this thesis, 8K SNP marker genotypes in crossbred pigs and 60K SNP marker genotypes in purebred pigs were provided by Danish Pig Research Centre. To implement genomic prediction for crossbred performance, imputation from low density (8K) to moderate density (60K) in crossbred animals is needed. However, the extent of LD between SNP markers and QTL may differ between crossbred and purebred populations (Dekkers, 2007). Thus, when using an imputation method based on local phasing haplotypes (e.g: Beagle), the performance of genotype imputation may be different in crossbred and purebred populations. For instance, Ventura et al. (2014) reported that in taurine beef cattle, accuracies of imputation for purebreds was much higher than those for crossbreds, but this has not been evaluated in crossbred pigs before this thesis.
15
The trait: Total Number of Piglets Born
Litter size is considered as a vital reproduction trait in pig production (Guo et al., 2014). It depends on both the ovulation rate of the dam and the embryonic survival of the offspring (Johnson et al., 1999). Lund et al. (2002) stated that litter size at weaning is the most important reproduction trait in pig production because of its high economic importance. However, due to cross fostering in pig farms, it is difficult to measure litter size at weaning. Instead, litter size at birth or the total number of piglets born (TNB), has been used as an alternative (Lund et al., 2002). The TNB in the first parity is considered as a different trait from later parities, because the genetic correlations between first and later parities are significantly lower than 1 (Irgang et al., 1994; Hanenberg et al., 2001). The trait of TNB is well known as a lowly heritable trait. Rothschild et al. (1998) reviewed that the average heritabilities were about 0.11 for TNB in both Landrace and Yorkshire populations, in line with results from Nielsen et al. (2013). Guo et al. (2014) also reported heritability of 0.11 for Landrace, but 0.09 for Yorkshire. Su et al. (2007) reported even lower heritablities for Landrace (0.07) and Yorkshire (0.05). For traits with low heritability, conventional selection cannot efficiently increase the genetic gain, which leaves room for the application of genomic selection. Genomic selection increases the genetic gain by increasing the accuracies of EBVs in pigs. The genetic gain in purebred populations was reported to increase up to 55% when compared to the conventional selection (Lopes, 2016).
Outline of this PhD thesis
This thesis aims at investigating genomic evaluation in pigs for crossbred performance for TNB. More specifically, the aims of this PhD project are:
First, apply single-step genomic evaluation method for crossbred performance in different scenarios with data recordings and genotypes in Danish Landrace, Yorkshire and F1 crossbred pig populations;
Second, investigate the impact of non-additive genetic effects on improvement of genomic evaluation for crossbred performance.
In chapter 2, performance of genotype imputation in low density panels were compared using different imputation strategies in both purebred and crossbred populations. Based on the optimal strategy, imputation from low density to moderate density panels was then investigated by a pedigree-based simulated dataset. This chapter demonstrated that imputation for crossbreds work as well as for purebreds. After these steps, genotypes were available at the same density for all the three populations, and for the further genomic selection.
In chapters 3 and 4, the single-step GBLUP method was applied in both purebred and crossbred datasets, focusing on evaluating genetic ability for crossbred performance. In chapter 3, a three-trait animal model that
16
can incorporate marker genotypes was applied to investigate both purebred and crossbred performances in different scenarios. Additive genetic effects in crossbred animals were split into two breed-specific gametic effects. Two breed-specific partial relationship matrices were used to account for the family relationships across purebred breed animals and breed-specific purebred gametes in crossbred animals. This method required estimating the breed origin of crossbred alleles, a difficult task. Therefore, the same dataset was revisited in chapter 4 by using a similar animal model, but on the contrary, instead of using two relationship matrices, one relationship matrix with metafounders was used to relate all the involved animals in the three populations. This method did not need the tracing of crossbred alleles for the breed origins.
Non-additive genetic effects play an important role in crossbred animals, but they cannot be implemented by single-step GBLUP approaches yet. In chapter 5, joint genomic evaluation of purebreds and crossbreds with GBLUP including additive genetic effects, dominance genetic effects and inbreeding depression was investigated on genotyped animals using precorrected data.
Finally, in chapter 6, a general discussion on the findings in a broad context was presented. Perspectives of shortages of this thesis and possible future improvements were also discussed.
References:
Aguilar, I., I. Misztal, D. L. Johnson, A. Legarra, S. Tsuruta, and T. J. Lawlor. 2010. Hot topic: A unified approach to utilize phenotypic, full pedigree, and genomic information for genetic evaluation of Holstein final score. Journal of Dairy Science 93: 743-52.
Anous, M., and M. Mourad. 1993. Crossbreeding effects on reproductive traits of does and growth and carcass traits of kids. Small Ruminant Research 12: 141-9.
Bagheri, H. C., and G. P. Wagner. 2004. Evolution of dominance in metabolic pathways. Genetics 168: 1713-35.
Baloche, G., A. Legarra, G. Sallé, H. Larroque, J-M. Astruc, C. Robert-Granié, and F. Barillet. 2014. Assessment of accuracy of genomic prediction for French Lacaune dairy sheep. Journal of Dairy Science 97: 1107-16.
Browning, B. L., and S. R. Browning. 2009. A unified approach to genotype imputation and haplotype-phase inference for large data sets of trios and unrelated individuals. The American Journal of Human Genetics 84: 210-23.
Bruce, A. 1910. The Mendelian theory of heredity and the augmentation of vigor. Science 32: 627-8.
Brøndum, R. F., P. Ma, M. S. Lund, and G. Su. 2012. Short communication: Genotype imputation within and across Nordic cattle breeds. Journal of Dairy science 95: 6795-6800.
Calus, M., A. De Roos, and R. Veerkamp. 2008. Accuracy of genomic selection using different methods to define haplotypes. Genetics 178: 553-61.
17 Charlesworth, D., and B. Charlesworth. 1987. Inbreeding depression and its evolutionary consequences.
Annual review of ecology and systematics 18: 237-68.
Christensen, O. F. 2012. Compatibility of pedigree-based and marker-based relationship matrices for single-step genetic evaluation. Genetics Selection Evolution 44: 37.
Christensen, O. F., A. Legarra, M. S. Lund, and G. Su. 2015. Genetic evaluation for three-way crossbreeding. Genetics Selection Evolution 47: 98.
Christensen, O. F., and M. S. Lund. 2010. Genomic prediction when some animals are not genotyped. Genetics Selection Evolution 42: 2.
Christensen, O. F., P. Madsen, B. Nielsen, T. Ostersen, and G. Su. 2012. Single-step methods for genomic evaluation in pigs. Animal 6: 1565-71.
Comstock, R. E., H. Robinson, and P. Harvey. 1949. Breeding procedure designed to make maximum use of both general and specific combining ability. Agronomy Journal.
Davenport, C. B. 1908. Degeneration, albinism and inbreeding. Science 28: 454-55.
De Boer, I., and I. Hoeschele. 1993. Genetic evaluation methods for populations with dominance and inbreeding. Theoretical and Applied Genetics 86: 245-58.
Dekkers, J. 2007. Marker-assisted selection for commercial crossbred performance. Journal of Animal Science 85: 2104-14.
Dufrasne, M. 2015. Genetic improvement of pig sire lines for production performances in crossbreeding. PhD Thesis, Université De Liège Gembloux, Belgium.
Ertl, J., J. Ertl, A. Legarra, Z. G. Vitezica, L. Varona, C. Edel, R. Emmerling, and K. U. Götz, K. U. 2014. Genomic analysis of dominance effects on milk production and conformation traits in Fleckvieh cattle. Genetics Selection Evolution 46: 40.
Esfandyari, H. 2016. Genomic selection for crossbred performance. PhD thesis, Wageningen University, the Netherlands.
Esfandyari, H., P. Bijma, M. Henryon, O. F. Christensen, and A. C. Sørensen. 2016. Genomic prediction of crossbred performance based on purebred Landrace and Yorkshire data using a dominance model. Genetics Selection Evolution 48: 9.
Esfandyari, H., A. C. Sorensen, and P. Bijma. 2015. A crossbred reference population can improve the response to genomic selection for crossbred performance. Genetics Selection Evolution 47: 76. Falconer, D., and T. Mackay. 1996. Introduction to Quantitative Genetics. 4 ed. Harlow: Longmans Green.
UK.
Forni, S., I. Aguilar, and I. Misztal. 2011. Different genomic relationship matrices for single-step analysis using phenotypic, pedigree and genomic information. Genetics Selection Evolution 43: 1.
18
Gao, H., O. F. Christensen, P. Madsen, U. S. Nielsen, Y. Zhang, M. S. Lund, and G. Su. 2012. Comparison on genomic predictions using three GBLUP methods and two single-step blending methods in the Nordic Holstein population. Genetics Selection Evolution 44: 8.
Garcia-Baccino, C. A., A. Legarra, O. F. Christensen, I. Misztal, I. Pocrnic, Z. G. Vitezica, and R. J. Cantet. 2017. Metafounders are related to F st fixation indices and reduce bias in single-step genomic evaluations. Genetics Selection Evolution, 49: 34.
García-Cortés, L. A., and M. Á. Toro. 2006. Multibreed analysis by splitting the breeding values. Genetics Selection Evolution 38: 601-15.
Goddard, M. E., and B. Hayes. 2007. Genomic selection. Journal of Animal Breeding and Genetics. 124: 323-30.
Guo, X., O. F. Christensen, T. Ostersen, Y. Wang, M. S. Lund, and G. Su. 2015. Improving genetic evaluation of litter size and piglet mortality for both genotyped and nongenotyped individuals using a single-step method. Journal of Animal Science 93: 503-12.
Habier, D., R. Fernando, and J. Dekkers. 2007. The impact of genetic relationship information on genome-assisted breeding values. Genetics 177: 2389-97.
Habier, D., R. L. Fernando, and J. C. Dekkers. 2009. Genomic selection using low-density marker panels. Genetics 182: 343-53.
Hanenberg, E., E. Knol, and J. Merks. 2001. Estimates of genetic parameters for reproduction traits at different parities in Dutch Landrace pigs. Livestock Production Science 69: 179-186.
Hartmann, W. 1992. Evaluation of the potentials of new scientific developments for commercial poultry breeding. World's Poultry Science Journal 48: 17-27.
Hayes, B. J., P. J. Bowman, A. C. Chamberlain, K. Verbyla, and M. E. Goddard. 2009. Accuracy of genomic breeding values in multi-breed dairy cattle populations. Genetics Selection Evolution 41: 1.
Hedgecock, D., D. J. McGoldrick, and B. L. Bayne. 1995. Hybrid vigor in Pacific oysters: an experimental approach using crosses among inbred lines. Aquaculture 137: 285-98.
Henderson, C. 1985. Best linear unbiased prediction of nonadditive genetic merits in noninbred populations. Journal of Animal Science 60: 111-17.
Hickey, J. M., J. Crossa, R. Babu, and G. de los Campos. 2012a. Factors affecting the accuracy of genotype imputation in populations from several maize breeding programs. Crop Science 52: 654-63.
Hickey, J. M., B. P. Kinghorn, B. Tier, J. H. van der Werf, and M. A. Cleveland. 2012b. A phasing and imputation method for pedigreed populations that results in a single-stage genomic evaluation. Genetics Selection Evolution 44: 9.
Hidalgo, A., J. Bastiaansen, M. Lopes, M. Calus, and D. Koning. 2016. Accuracy of genomic prediction of purebreds for cross bred performance in pigs. Jounal of Animal Breeding and Genetics 133: 443-51.
19 Hidalgo, A. M. 2015. Exploiting genomic information on purebred and crossbred pigs. PhD Thesis, Swedish
University of Agricultural Sciences, Uppsala, Sweden.
Howie, B. N., P. Donnelly, and J. Marchini. 2009. A flexible and accurate genotype imputation method for the next generation of genome-wide association studies. PLoS Genet 5: e1000529.
Irgang, R., J. A. Fávero, and B. W. Kennedy. 1994. Genetic parameters for litter size of different parities in Duroc, Landrace, and large white sows. Journal of Animal Science 72: 2237-46.
Johnson, R. K., M. K. Nielsen, and D. S. Casey. 1999. Responses in ovulation rate, embryonal survival, and litter traits in swine to 14 generations of selection to increase litter size. Journal of Animal Science 77: 541-57.
Jones, D. F. 1917. Dominance of linked factors as a means of accounting for heterosis. Proceedings of the National Academy of Sciences 3: 310-12.
Keller, L. F., and D. M. Waller. 2002. Inbreeding effects in wild populations. Trends in Ecology & Evolution 17: 230-41.
Kennedy, B. 1991. CR Henderson: The unfinished legacy. Journal of dairy science 74: 4067-81.
Knol, E. F., B. Nielsen, and P. W. Knap. 2016. Genomic selection in commercial pig breeding. Animal Frontiers 6: 15-22.
Legarra, A. 2016. Comparing estimates of genetic variance across different relationship models. Theoretical population biology 107: 26-30.
Legarra, A., I. Aguilar, and I. Misztal. 2009. A relationship matrix including full pedigree and genomic information. Journal of dairy science 92: 4656-63.
Legarra, A., O. F. Christensen, I. Aguilar, and I. Misztal. 2014. Single Step, a general approach for genomic selection. Livestock Science 166: 54-65.
Legarra, A., O. F. Christensen, Z. G. Vitezica, I. Aguilar, and I. Misztal. 2015. Ancestral relationships using metafounders: finite ancestral populations and across population relationships. Genetics 200: 455-68. Leutenegger, A. L., A. Labalme, E. Génin, A. Toutain, E. Steichen, F. Clerget-Darpoux, and P. Edery. 2006. Using genomic inbreeding coefficient estimates for homozygosity mapping of rare recessive traits: application to Taybi-Linder syndrome. The American journal of human genetics 79: 62-66.
Li, L., K. Lu, Z. Chen, T. Mu, Z. Hu, and X. Li. 2008. Dominance, overdominance and epistasis condition the heterosis in two heterotic rice hybrids. Genetics 180: 1725-42.
Lillehammer, M., and A. K. Sonesson. 2011. Genomic selection for maternal traits in pigs. Journal of Animal Science 89: 3908-16.
Lo, L., R. Fernando, and M. Grossman. 1997. Genetic evaluation by BLUP in two-breed terminal crossbreeding systems under dominance. Journal of Animal Science 75: 2877-84.
Lopes, M. 2016. Genomic selection for improved crossbred performance. PhD Thesis, Wageningen University, Wageningen, the Netherlands.
20
Lopes, M., J. Bastiaansen, L. Janss, E. Knol, and H. Bovenhuis. 2015. Genomic prediction of growth in pigs based on a model including additive and dominance effects. Journal of Animal Breeding and Genetics 133: 180-86.
Lund, M. S., M. Puonti, L. Rydhmer, and J. Jensen. 2002. Relationship between litter size and perinatal and pre-weaning survival in pigs. Animal Science 74: 217-22.
Luo, L. J., Z. K. Li, H. W. Mei, Q. Y. Shu, R. Tabien, D. B. Zhong, and A. H. Paterson. 2001. Overdominant epistatic loci are the primary genetic basis of inbreeding depression and heterosis in rice. II. Grain yield components. Genetics 158: 1755-71.
Lutaaya, E., I. Misztal, J. W. Mabry, T. Short, H. H. Timm, and R. Holzbauer. 2001. Genetic parameter estimates from joint evaluation of purebreds and crossbreds in swine using the crossbred model. Journal of Animal Science 79: 3002-07.
Ma, P. 2013. Methods and strategies to impute missing genotypes for improving genomic prediction. PhD thesis, Aarhus University, Tjele, Denmark.
Ma, P., R. F. Brøndum, Q. Zhang, M. S. Lund, and G. Su. 2013. Comparison of different methods for imputing genome-wide marker genotypes in Swedish and Finnish Red Cattle. Journal of dairy science 96: 4666-77.
Marchini, J., and B. Howie. 2010. Genotype imputation for genome-wide association studies. Nature Reviews Genetics 11: 499-511.
Mavrogenis, A. 1996. Environmental and genetic factors influencing milk and growth traits of Awassi sheep in Cyprus. Heterosis and maternal effects. Small Ruminant Research 20: 59-65.
Meuwissen, T., B. Hayes, and M. Goddard. 2001. Prediction of total genetic value using genome-wide dense marker maps. Genetics 157: 1819-29.
Meuwissen, T., and Z. Luo. 1992. Computing inbreeding coefficients in large populations. Genetics Selection Evolution 24: 4.
Misztal, I. 1997. Estimation of variance components with large-scale dominance models. Journal of Dairy Science 80: 965-74.
Misztal, I., L. Varona, M. Culbertson, J. K. Bertrand, J. Mabry, T. J. Lawlor, and N. Gengler. 1998. Studies on the value of incorporating the effect of dominance in genetic evaluations of dairy cattle, beef cattle and swine. Biotechnologie, agronomie, société et environnement 2: 227-33.
Moghaddar, N., A. A. Swan, and J. H. J. Werf. 2014. Comparing genomic prediction accuracy from purebred, crossbred and combined purebred and crossbred reference populations in sheep. Genetics Selection Evolution 46: 58.
Mäntysaari, E. A., M. Koivula, I. Strandén, J. Pösö, and G. P. Aamand. 2011. Estimation of GEBVs using deregressed individual cow breeding values. Interbull Bulletin 44.
21 Nielsen, B., G. Su, M. S. Lund, and P. Madsen. 2013. Selection for increased number of piglets at d 5 after farrowing has increased litter size and reduced piglet mortality. Journal of Animal Science 91: 2575-82.
Rauw, W., E. Kanis, E. Noordhuizen-Stassen, and F. Grommers. 1998. Undesirable side effects of selection for high production efficiency in farm animals: a review. Livestock Production Science 56: 15-33. Rothschild, M., J. Bidanel, and A. Ruvinsky. 1998. Biology and genetics of reproduction. The genetics of the
pig 2: 313-43.
Sargolzaei, M., J. Chesnais, and F. Schenkel. 2011. FImpute-An efficient imputation algorithm for dairy cattle populations. Journal of Dairy Science 94: 421.
Scheet, P., and M. Stephens. 2006. A fast and flexible statistical model for large-scale population genotype data: applications to inferring missing genotypes and haplotypic phase. The American Journal of Human Genetics 78: 629-44.
Shikano, T., and N. Taniguchi. 2002. Using microsatellite and RAPD markers to estimate the amount of heterosis in various strain combinations in the guppy (Poecilia reticulata) as a fish model. Aquaculture 204: 271-81.
Simeone, R., I. Misztal, I. Aguilar, and Z. Vitezica. 2012. Evaluation of a multi-line broiler chicken population using a single‐step genomic evaluation procedure. Journal of Animal Breeding and Genetics 129: 3-10.
Silió, L., M. C. Rodríguez, A. Fernández, C. Barragán, R. Benítez, C. Óvilo, and A. I. Fernández. 2013. Measuring inbreeding and inbreeding depression on pig growth from pedigree or SNP‐derived metrics. Journal of Animal Breeding and Genetics 130: 349-60.
Solberg, T., A. Sonesson, and J. Woolliams. 2008. Genomic selection using different marker types and densities. Journal of Animal Science 86: 2447-54.
Su, G., O. F. Christensen, T. Ostersen, M. Henryon, and M. S. Lund. 2012a. Estimating Additive and Non-Additive Genetic Variances and Predicting Genetic Merits Using Genome-Wide Dense Single Nucleotide Polymorphism Markers. PLoS ONE 7: e45293.
Su, G., M. S. Lund, and D. Sorensen. 2007. Selection for litter size at day five to improve litter size at weaning and piglet survival rate. Journal of Animal Science 85: 1385-92.
Su, G., P. Madsen, U. S. Nielsen, E. A. Mäntysaari, G. P. Aamand, O. F. Christensen, and M. S. Lund. 2012b. Genomic prediction for Nordic Red Cattle using one-step and selection index blending. Journal of Dairy Science 95: 909-17.
Sun, C., P. M. VanRaden, J. B. Cole, and J. R. O’Connell. 2014. Improvement of prediction ability for genomic selection of dairy cattle by including dominance effects. PLoS One 9: e103934.
Sørensen, P. 2003. DENMARK'S Country Report on Farm Animal Genetic Resources. Danish Institute of Agricultural Sciences, Ministry of Food, Agriculture and Fisheries in Denmark.
22
Ter Braak, C. J., M. P. Boer, L. R. Totir, C. R. Winkler, O. S. Smith, M. C. Bink. 2010. Identity-by-descent matrix decomposition using latent ancestral allele models. Genetics 185: 1045-57.
Tier, B. 1990. Computing inbreeding coefficients quickly. Genetics Selection Evolution 22: 419-30.
Toro, M. Á., L. A. García-Cortés, and A. Legarra. 2011. A note on the rationale for estimating genealogical coancestry from molecular markers. Genetics Selection Evolution 43: 27.
Toro, M. A., and L. Varona. 2010. A note on mate allocation for dominance handling in genomic selection. Genetics Selection Evolution 42: 33.
Tusell, L., H. Gilbert, J. Riquet, M. J. Mercat, A. Legarra, and C. Larzul. 2016. Pedigree and genomic evaluation of pigs using a terminal-cross model. Genetics Selection Evolution 48: 32.
Tusell, L., P. Pérez-Rodríguez, S. Forni, X.-L. Wu, and D. Gianola. 2013. Genome-enabled methods for predicting litter size in pigs: a comparison. Animal 7: 1739-49.
Van Arendonk, J., P. Bijma, H. Bovenhuis, R. Crooijmans, and T. Van der Lende. 2010. Animal breeding and genetics. Lecture notes ABG-20306, Wageningen University, the Netherlands.
VanRaden, P. 1992. Accounting for inbreeding and crossbreeding in genetic evaluation of large populations. Journal of Dairy Science 75: 3136-44.
VanRaden, P. 2008. Efficient methods to compute genomic predictions. Journal of Dairy Science 91: 4414-23.
VanRaden, P., K. Olson, G. Wiggans, J. Cole, and M. Tooker. 2011. Genomic inbreeding and relationships among Holsteins, Jerseys, and Brown Swiss. Journal of Dairy Science 94: 5673-82.
VanRaden, P. M., C. P. Van Tassell, G. R. Wiggans, T. S. Sonstegard, R. D. Schnabel, J. F. Taylor, and F. S. Schenkel. 2009. Invited review: Reliability of genomic predictions for North American Holstein bulls. Journal of Dairy Science 92: 16-24.
Ventura, R. V., D. Lu, F. S. Schenkel, Z. Wang, C. Li, and S. P. Miller. 2014. Impact of reference population on accuracy of imputation from 6K to 50K single nucleotide polymorphism chips in purebred and crossbreed beef cattle. Journal of Animal Science 92: 1433-44.
Visscher, P., R. Pong-Wong, C. Whittemore, and C. Haley. 2000. Impact of biotechnology on (cross) breeding programmes in pigs. Livestock Production Science 65: 57-70.
Vitezica, Z. G., I. Aguilar, I. Misztal, and A. Legarra. 2011. Bias in genomic predictions for populations under selection. Genetics Research 93: 357-66.
Vitezica, Z. G., L. Varona, J. M. Elsen, I. Misztal, W. Herring, and A. Legarra. 2016. Genomic BLUP including additive and dominant variation in purebreds and F1 crossbreds, with an application in pigs. Genetics Selection Evolution 48: 6.
Wei, M. 1992. Combined crossbred and purebred selection in animal breeding. PhD Thesis, Wageningen University and Research Centre, The Netherlands.
23 Wei, M., and H. A. M. Steen. 1991. Comparison of reciprocal recurrent selection with pure-line selection
systems in animal breeding (a review). Anim Breed Abstr 59: 281-98.
Wei, M., and J. van der Werf. 1994. Maximizing genetic response in crossbreds using both purebred and crossbred information. Anim Prod 59: 401-13.
Weigel, K. A., G. de Los Campos, A. I. Vazquez, G. J. M. Rosa, D. Gianola, and C. P. Van Tassell. 2010. Accuracy of direct genomic values derived from imputed single nucleotide polymorphism genotypes in Jersey cattle. Journal of Dairy Science 93: 5423-35.
Wientjes, Y. C., R. F. Veerkamp, and M. P. Calus. 2013. The effect of linkage disequilibrium and family relationships on the reliability of genomic prediction. Genetics 193: 621-31.
Zeng, J., A. Toosi, R. Fernando, J. Dekkers, and D. Garrick. 2013. Genomic selection of purebred animals for crossbred performance in the presence of dominant gene action. Genetics Selection Evolution 45: 11.
Zhang, Z., and T. Druet. 2010. Marker imputation with low-density marker panels in Dutch Holstein cattle. Journal of Dairy Science 93: 5487-94.
25
CHAPTER 2: PAPER I.
Imputation of genotypes in Danish
purebred and two-way crossbred pigs
using low-density panels
Tao Xiang
1,2*, Peipei Ma
1, Tage Ostersen
3, Andres Legarra
2, Ole Fredslund
Christensen
11
Center for Quantitative Genetics and Genomics, Department of Molecular Biology and Genetics, Aarhus University, DK-8830 Tjele, Denmark
2
INRA, UR1388 GenPhySE, CS-52627, F-31326 Castanet-Tolosan, France
3
Pig Research Centre, Danish Agricultural and Food Council, DK-1609 Copenhagen, Denmark
*
Corresponding author
This paper was published in Genetics Selection Evolution (2015) 47:54. DOI
10.1186/s12711-015-0134-4
26
Abstract
Background
Genotype imputation is commonly used as an initial step in genomic selection since the accuracy of genomic selection does not decline if accurately imputed genotypes are used instead of actual genotypes but for a lower cost. Performance of imputation has rarely been investigated in crossbred animals and, in particular, in pigs. The extent and pattern of linkage disequilibrium differ in crossbred versus purebred animals, which may impact the performance of imputation. In this study, first we compared different scenarios of imputation from 5K to 8K single nucleotide polymorphisms (SNPs) in genotyped Danish Landrace and Yorkshire and crossbred Landrace-Yorkshire datasets and, second, we compared imputation from 8K to 60K SNPs in genotyped purebred and simulated crossbred datasets. All imputations were done using software Beagle version 3.3.2. Then, we investigated the reasons that could explain the differences observed.
Results
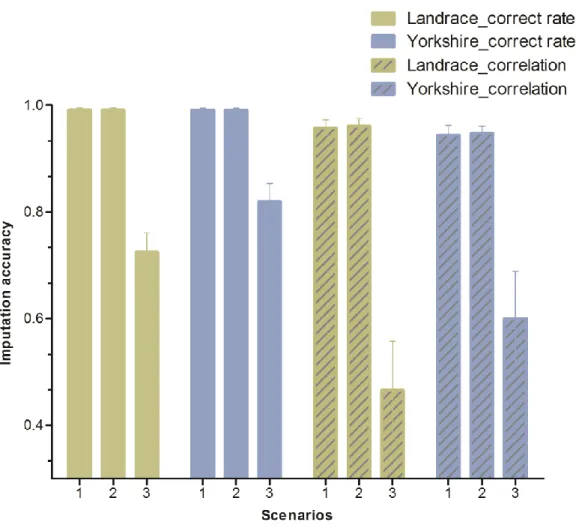
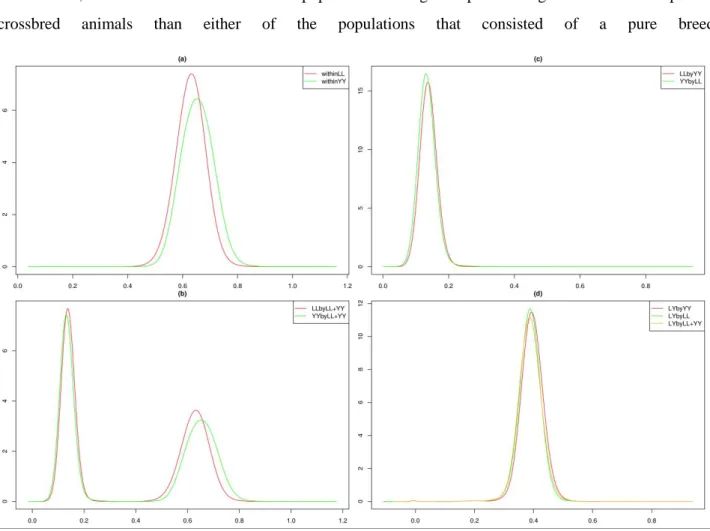
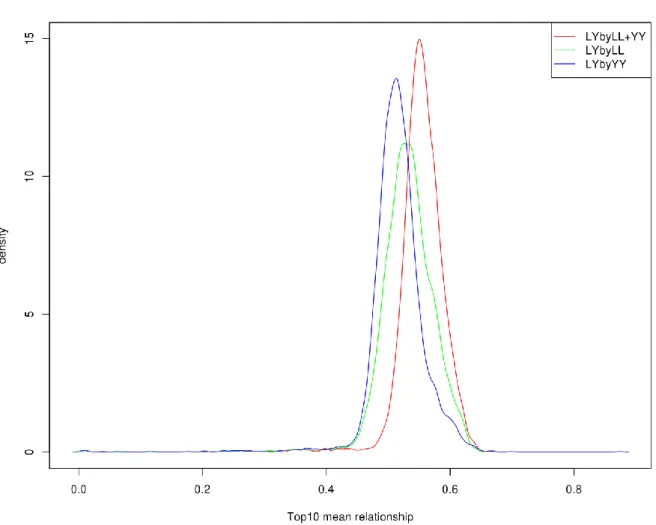
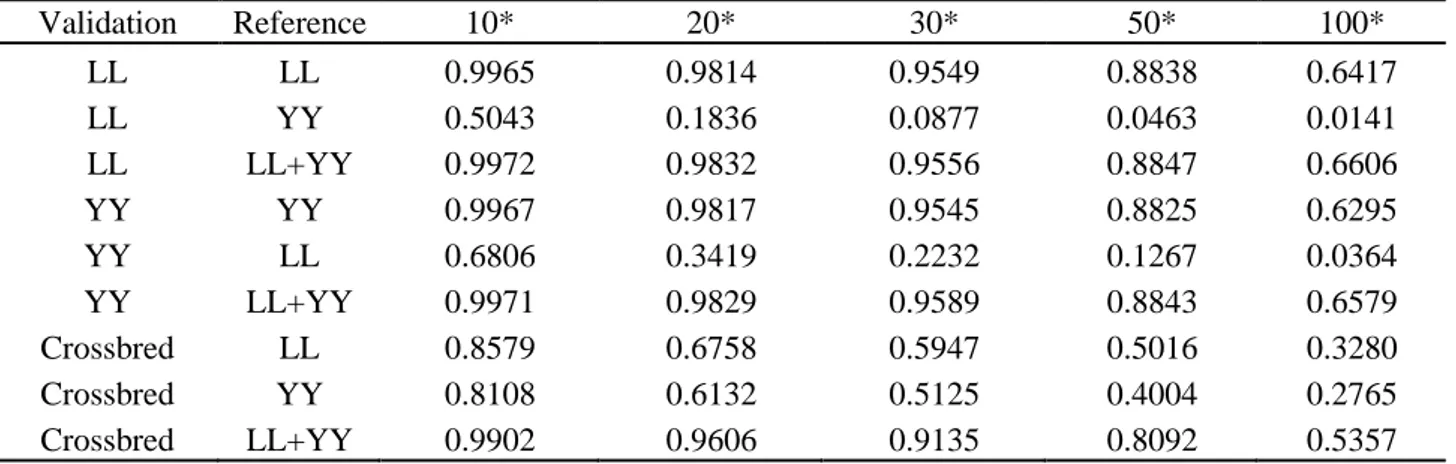
Genotype imputation performs as well in crossbred animals as in purebred animals when both parental breeds are included in the reference population. When the size of the reference population is very large, it is not necessary to use a reference population that combines the two breeds to impute the genotypes of purebred animals because a within-breed reference population can provide a very high level of imputation accuracy (correct rate ≥ 0.99, correlation ≥ 0.95). However, to ensure that similar imputation accuracies are obtained for crossbred animals, a reference population that combines both parental purebred animals is required. Imputation accuracies are higher when a larger proportion of haplotypes are shared between the reference population and the validation (imputed) populations.
Conclusions
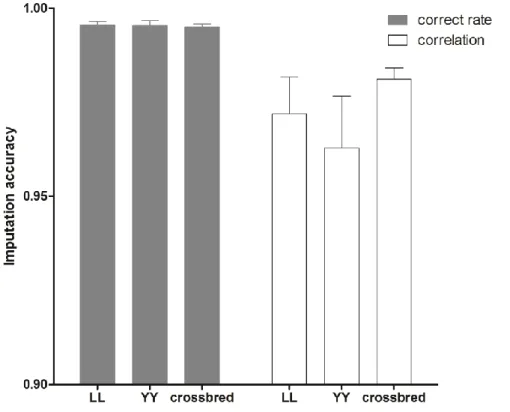
The results from both real data and pedigree-based simulated data demonstrate that genotype imputation from low-density panels to medium-density panels is highly accurate in both purebred and crossbred pigs. In crossbred pigs, combining the parental purebred animals in the reference population is necessary to obtain high imputation accuracy.
27
Background
Implementation of genomic selection (GS) [1] in breeding programs requires dense molecular marker genotypes since increasing marker density increases the probability that a marker is in strong linkage disequilibrium (LD) with a quantitative trait locus (QTL) [2]. However, the high costs of genotyping are a key constraint to efficient implementation of GS [3]. To partly overcome this problem, it has become current practice to genotype candidates for selection using low-density single nucleotide polymorphism (SNP) chips (up to 10 000 SNPs), while a limited number of individuals chosen as reference animals are genotyped with a high-density chip (50 000 SNPs or more). Imputation is then carried out from low density to high density [4,5]. Studies on US Jersey cattle have confirmed that the accuracy of GS does not decline when using imputed genotypes if the low-density panel includes more than 3000 evenly distributed SNPs [4]. Furthermore, missing genotypes that are not called by some of the standard genotyping methods must be imputed prior to inclusion in models for GS [6]. Overall, genotype imputation is generally considered as an initial step for GS.
Genomic selection has been successfully applied for purebred populations [7,8], but it is also possible to select purebred animals for crossbred performance by combining information from crossbred animals with genomic information from purebred animals [9]. Crossbreeding is very common in pigs bred for meat production because of the increased performance of crossbred compared to purebred individuals [10]. Due to the difficulty and high cost of collecting phenotypic and pedigree data on crossbred animals [11] and genotyping costs, data on both purebred and crossbred animals are rarely available. Performances of GS in crossbred and purebred pigs may differ because of dominance effects in combination with different allele frequencies in the two pure breeds, and because the extent of LD between SNPs and QTL may differ between crossbred and purebred populations. Thus, the effects of SNPs may be breed-specific [9].
Algorithms for genotype imputation (such as that implemented in Beagle [12]) depend crucially on LD patterns across markers [13], which may be breed-specific. Therefore, the performance of genotype imputation might differ between crossbreds and purebreds. Since genotypes are rarely available for crossbred individuals in livestock, most studies that have investigated the critical factors that affect the performance of imputation have been based on purebred plant [14] and livestock populations [15-18]. Recently, an analysis of imputation from 6K to 50K SNP chip genotypes in crossbred taurine beef cattle was reported [19], but, to our knowledge, this has not been evaluated in crossbred pigs.
In this study, different scenarios of imputation from lower density (5K) to higher density (8K) SNP chips were compared using two Danish pig breeds, Landrace and Yorkshire, and a two-way crossbred Landrace-Yorkshire population. Differences in imputation accuracies between purebred and crossbred animals were
28
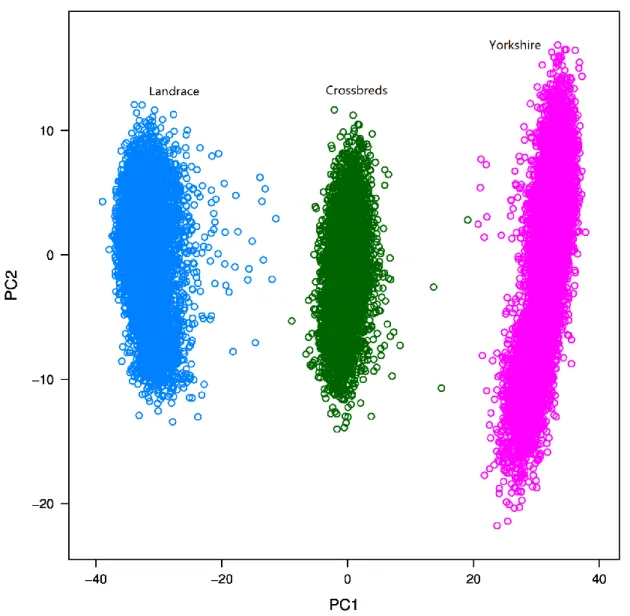
investigated to set up an optimal strategy for imputation from a low-density (8K) to a medium-density (60K) SNP chip in crossbred pigs and results were validated using a simulated dataset of crossbred medium-density (60K) genotypes. Previous studies indicated that the relationship between imputed and reference individuals is one of the major factors that affects performance of imputation [3,6,20]; Hayes et al. [3] reported that it could account for up to 64% of the variation in accuracy of imputation in sheep. Thus, to better understand the results in the current study, we tried to quantify relationships between animals within and across datasets, using genomic relationships and indexes of haplotype similarities.
Methods
Animals and genotypes
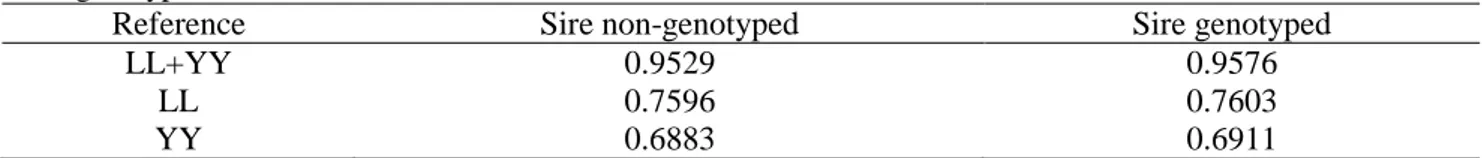
All data were provided by the Danish Pig Research Centre. The numbers of genotyped purebred Danish Landrace (LL), Danish Yorkshire (YY) and two-way crossbred Danish Landrace-Yorkshire pigs were 9328, 9393 and 5639, respectively. Crossbred animals that had a Landrace sire and a Yorkshire dam were referred to as ‘Landrace_Yorkshire’, while those that had a Yorkshire sire and a Landrace dam were referred to as ‘Yorkshire_Landrace’. Crossbred animals consisted of 4432 Landrace_Yorkshire (LY) and 1207 Yorkshire_Landrace (YL) pigs. Purebred and crossbred animals were born between 1998 and 2013, and between 2009 and 2012, respectively. All crossbred pigs were results of matings between the two pure breeds. Pedigrees of both purebred and crossbred pigs were available and all crossbred animals could be traced back to their purebred ancestors. Among the 5639 crossbred pigs, 4956 had genotyped sires (n = 1580) but only nine pigs had genotyped dams (n = 4). In addition, 1441 maternal grandsires of the crossbreds were genotyped. Crossbred animals were divided into two subsets: those that had a genotyped sire (4956) and those that did not (683).
Both pure breeds were genotyped with the Illumina PorcineSNP60 Genotyping BeadChip [21]. Two different versions of the 60K SNP chip (Illumina PorcineSNP60 v1 and PorcineSNP60 v2) were used to genotype purebred animals, i.e. about 50% animals with each version. About 2% of the SNPs worked in one version but not in the other version and vice versa. The two different chip versions should be taken into account when applying a quality filter on SNPs. Previous unpublished analyses (Tage Ostersen, Danish Pig Research Centre, personal communication) on purebred pigs showed that when applying a quality filter on SNPs, varying the minimum call rate for individuals from 70 to 90% did not affect the accuracy of genomic predictions significantly. This combined with the fact that very few animals had a call rate between 80% and 90%, we chose to set the minimum call rate of individuals to 80%. SNP quality controls were applied for the dataset that consisted of both pure breeds combined as follows: SNPs with a call rate less than 90% were