Electronic copy available at: http://ssrn.com/abstract=1576307
1
Financial intermediation and the rights offer paradox
Laure Matsoukis
Université Paris-Dauphine; DRM
March 2010
Abstract
In this study, we investigate the trading dynamics around rights issues. We employ signed and unsigned trading activity measures in order to provide evidence of costly financial intermediation. We, first, document short selling activity by underwriters and shareholders during rights issues leading to significant negative abnormal returns during the offer. Further, we provide evidence that rights tend to be sold below their fair value. Our results, therefore, suggest that the lack of use of rights offering, referred to as the rights offer paradox can be explained by indirect costs related to the nature of constraints confronting underwriters and shareholders but also to trading mistakes on the rights market.
Keywords: Security offering, SEO, flotation method, rights issues, order imbalance, financial intermediation
Electronic copy available at: http://ssrn.com/abstract=1576307
2 1. Introduction
Equity offerings can be sold using many different mechanisms from a public offering to a rights issue and there are significant geographical variations in the use of one particular method. In the United States, firm commitment is the flotation method preferred by publicly traded US firms (Eckbo, Masulis and Norli 1992) despite the lower flotation costs of rights. On the other hand, rights issue has historically been the predominant issue method in France (Gajewski and Ginglinger 2002) and in most European countries as reported in different studies by Slovin, Sushka and Lai (2000) for the United Kingdom, Bohren, Eckbo and Michalsen (1997) for Norway, Tsangarakis (1996) for Greece, Gebhardt and Heiden (1998) for Germany. Nevertheless, those studies show a trend away from rights to the benefit of public offerings. Thus, it appears that issuers in the U.S. and internationally are increasingly selecting the most expensive equity flotation method. This phenomenon is known as the equity financing paradox. Relevant literature on the explanation of this equity financing paradox identified indirect costs associated with rights issues. Eckbo and Masulis (1992) based on Myers and Majluf framework (1984) argue that adverse selection costs in the rights issue market are large indirect costs and explain partially this phenomenon. More precisely, they introduce shareholder takeup and quality certification in the form of underwriting and argue that the optimal flotation method depends on the shareholder takeup. Their key insight is to show that wealth transfer costs associated with uninsured rights issues increases as shareholder takeup decreases. This additional cost can prompt firms to issue without rights or to appeal for bank certification in order to minimize their wealth transfer costs. Empirical evidence from the United States (Eckbo and Masulis 1992) but also in Europe (Bohren, Eckbo et Michalson (1997) in Norway, Cronqvist et Nilsson (2004) in Sweden and Gajewski and Ginglinger (2002) in France) confirms these results. Other explanations include the liquidity effect (Kothare (1997); Ginglinger, Matsoukis and Riva (2009)) and capital gains taxes (Smith 1977).
In the literature mentioned above, however, the debate has naturally focused on announcement returns and post SEO liquidity effects on the stock market, while trading activity on the stock and rights market has rarely been examined although it is essential to a deeper understanding of economic interactions in financial markets (Chordia and al. 2002). Filling this gap, Huh and al (2005) go beyond the return analyses and investigate trading behaviors around seasoned equity offerings in the U.S.. They used order imbalance measures to provide evidence that there is a cross-sectional heterogeneity in investor reactions to SEOs.
3 Yet, they don’t study differences in flotation methods since they focus on the relation between order imbalance and price movements before and after a SEO. Peterson (2007), on the other side, analyzed trading dynamics around non underwritten rights offerings by closed end funds but studied only unsigned measures. His univariate results on a restricted sample of 7 offerings in 2005 suggest that shareholders and brokers actively intermediate the offering using short selling strategies. Finally, several papers analyze the pricing of rights and arbitrage opportunities (Hietala 1994, Poitras 2002, Knüpfer and al. 2008). More specifically, Knüpfer and al. (2008) found that shareholders of issuing companies suffered of wealth loss by exercising rights too early, selling rights on the open market below their intrinsic value or even leaving them unexercised.
The present study analyzes trading patterns on the stock and rights market during the offer period of rights issues. We employ signed and unsigned trading activity measures in order to shed light on the differences of trading behavior across investors and according to the flotation method. Specifically, we attempt to answer the following questions: What are the typical patterns of unsigned and signed trading measures on the stock and rights market around rights issues? Are these patterns different according to the flotation method? Are they different among investors? If so, could they explain the rights offer paradox? We use, therefore, a hand collected dataset of 120 rights issues by French firm over the period 1995 to 2006. The French institutional setting is appropriate for these tests for several reasons. First, French firms can choose to underwrite their issue allowing us to compare trading patterns of standby rights and uninsured rights and analyze more specifically the behavior of underwriters. Second, whereas in the U.S., utilities, closed-end funds, REITS, and financial distressed firms are the primary users of rights offerings, in France, large publicly traded corporations frequently choose this flotation method. Finally, the French equity market is dominated by closely held firms.
To the best of our knowledge, this is the first study to investigate trading dynamics during the offering of a rights issue by using standard trading activity measures but also daily order imbalances. There are a couple of reasons for why there is merit to investigate order imbalances during SEOs: it allows us to analyze the differences in reactions between institutional and individual investors and provides information on trade directions. Moreover, unlike previous research, we examine the differences of investment behaviors during the offer period between standby rights and uninsured rights in order to inquire the financial constraints faced by underwriters and shareholders. Finally, we also go beyond previous studies realized
4 on the rights market that report investment mistakes since we analyze their determinants by performing a multivariate regression analysis on the issues’ and the issuers’ characteristics.
More precisely, we investigate the stock and the rights market during the offer period by analyzing trading volumes, trade sizes but also trade number and euro volume order imbalances. Those measures were computed using the Lee and Ready algorithm (1991) and indicate differences between small and large investors (Huh. And al (2005)). With regard to the stock market, during standby rights issues, we observe an increase in trading volumes for all size of trades as well as an increase in seller initiated trades. On the other side, during uninsured rights issues, our results suggest an increase in small trades’ volumes only, as well as an increase in seller initiated trades. By further analyzing the determinants of order imbalance measures, we observe that, in order to mitigate their risk, underwriters and shareholders are net sellers of stock during the subscription period of a rights offer leading to negative abnormal returns. On the rights market, however, we find differences in our trading measures during standby rights and during uninsured rights issues. Indeed, the results exhibit no significant order imbalances during standby rights issues but significant seller initiated transactions during uninsured rights. By performing a multivariate analysis, we find a positive relation between the existence of an underwriter and order imbalance measures that can be explained by the fact that underwriters buy rights to fulfill the standby agreement. Lastly, we compare the transaction prices on the rights market with the fair value of the rights and find evidence of investment mistakes related to ownership concentration and the existence of an underwriter. In case of strong ownership concentration, investors undervalue the rights and transaction prices are lower than the fair value of the rights.
We argue, therefore, that this paper gives new insight to the resolution of the rights offer paradox. Indeed, it presents direct evidence of short selling activity by underwriters and shareholders during the offer period resulting in a significant price drop of 6.4% during the offer period. This price behavior is in sharp contrast with studies of public offerings which have revealed no abnormal offering period price behavior. We suggest following Singh (1997) that this phenomenon is explained by the nature of constraints confronting underwriters and shareholders during rights issues. In addition, we document trading mistakes on the rights market and more specifically we find that shareholders tend to sell their rights at a transaction price that is lower than the fair value of the rights. This occurs in case of strong ownership concentration and in presence of sophisticated buyers such as the underwriter. As a
5 conclusion, in the case shareholders sell their rights on the open market, they incur additional unreported costs.
The remainder of this paper is organized as follows. In the next section, the data, sample selection and valuation issues of rights are discussed. In Section 3, we examine trading patterns during the offer period on the stock market and on the rights market. Section 4 puts forward factors explaining trading patterns and Section 5 concludes.
2. Institutional Framework and data
2.1. French institutional setting and Rights mechanism
French law grants the right to shareholders to acquire additional shares according to their current ownership take by distributing subscription rights (rights issues) but shareholders can waive this right and decide to raise equity through a public offering. With regard to rights offerings, the rights offer price or “subscription price” is set at a discount from the current market price and the rights expire after a period called “subscription period”. The issuer bears the risk of offering failure, but controls this risk in part through the offering price discount. In order to avoid completely the risk of failure, he can also choose to underwrite the issue (standby rights issues) and guarantee the portion of the rights offer that the rights holder leave unsubscribed. In this case, the underwriter has the obligation to take up all shares not taken up by shareholders. He receives a fee, known as standby fee, for incurring the risk that the offering may fail. This fee will be an increased function of the risk incurred and thus the risk of under subscription as perceived by the underwriter is most relevant for the determination of costs of the issue to the firm.
During a rights issue, shareholders have to decide whether or not to subscribe to the new equity issue. They can either subscribe to the offer by exercising their rights or sell them on the open market during the subscription period, thereby, accepting a reduction in their firm ownership. The rump, that is, rights that have value but are neither exercised nor traded are forfeited without compensation, similarly to the U.S.. In the practice, Investors purchasing shares on or after the beginning of the offer (ex rights date) are not entitled to receive the rights that are distributed. Between the rights issue announcement date (AD) and the ex right date (ERD), the stock trades cum rights so that common stock purchasers during that period are entitled to receive the rights. During the subscription period, the rights begin, then, to trade on a separate line on the NYSE Euronext market. This period lasted on average 13
6 trading days in France from 1995 to 2006. Singh (1997) reports a subscription period of 13 to 14 days on the NYSE and AMEX between 1963 and 1989. In Finland, Knüpfler and Rantapuska (2008) find an average rights trading period of 18 days from 1995 to 2002 and Poitras (2002) mentions a shorter rights trading period of 7 days from 1992 to 1998 in Singapore. The last date of interest is the listing date (LD) of the newly issued shares which is set on average 15 days after the end of the subscription period. On this date, the new shares can be sold on the open market. Figure 1 shows a time line of important dates related to rights issues in France
[Insert Figure 1]
2.2. Rights issues in France from 1995 to 2006
We identified all rights issues that have taken place on the French market from 1995 to 2006 and hand collected their characteristics using the AMF issue prospectuses1.
Our initial sample consists of 173 rights offerings. The final sample excludes all issues that do not meet the following criteria:
- Issues that involve more than a single type of security (units of common stock and warrant offerings are excluded).
- Issues that do not show any activity on the rights market during the subscription period.
These criteria leave us with a sample of 120 rights issues of which 62 were underwritten. This sample is larger than in previous studies: 18 US standby rights offerings in Singh (1997), 98 Singaporean rights issues in Poitras (2008), 18 Finnish rights issues in Knüpfer and al. (2008), and 70 in Hietala (2001).
Table I reports descriptive statistics on the Rights issues and issuers according to flotation method.
[Insert Table I]
1
French law requires issuers to meet filing rules and extensive disclosure requirements prior to the offering date: all the issues characteristics must be approved by the AMF and be filed in an issue prospectus.
7 With regard to the offering characteristics, we observe several differences between standby rights issues and uninsured rights issues. The mean (median) size of a standby rights issue is 420M€ (123M€) compared to 199M€ (13M€) for an uninsured rights issue. Moreover, the subscription price offers, on average, a 21% discount to the prevailing stock price. This discount is statistically larger for standby rights offerings (25%) than for uninsured rights offerings (17%) suggesting that underwriters require a lower subscription price in order to minimize their risk. Indeed, as suggested by Slovin and al. (2000), the exercise price could incorporate perceptions held by the underwriter about firm quality and risk taken. The average number of shares offered, as a percentage of outstanding and new shares is larger for uninsured rights (33.69%) than for standby rights issues (23.21%). Next, we observe that the mean allocation ratio is 1.47 in France from 1995 to 2006. The median allocation ratio is, nevertheless, only of 0.28. The difference between those two figures is mainly explained by two extreme values. Indeed, two non underwritten issues in our sample exhibit ratios of 68 and 48 respectively. If we exclude those values, we obtain a mean allocation of 0.51 for the whole sample (0.42 for standby rights and 0.61 for uninsured rights issues). Table I also shows the average relative direct costs for the different flotation methods. Standby rights are more expensive than uninsured rights. Indeed, the average flotation costs of standby rights are of 3.12% and 2.50% for uninsured rights issues. Those figures are greater than those reported by Gajewski and Ginglinger (2002) for French issues over the period 1986-1996. These authors report direct flotation costs of 1.63% for uninsured rights and 2.18% for standby rights offerings.
Considering the issuers’ characteristics, we find that larger firms tend to choose standby rights offerings over uninsured rights. Their mean (median) market value is 4,785 M€ (520 M€) compared to 1,562 M€ (58 M€) for firms choosing uninsured rights. Firms with more concentrated share ownership choose uninsured rights more often: the percentage of shares held by the main shareholder is significantly higher for the uninsured rights issues compared to standby rights (46.59% vs. 34.37%). Moreover, the average percentage of shares held by the blockholders is 66.99% for uninsured rights compared to 45.24% for standby rights. At the 20% threshold, firms are controlled by another firm (46%), a family (24%), a financial institution (19%) and 28% are widely held. We report a lower blockholder takeup during standby rights than during uninsured rights since the mean percentage of those issues offered to external investors is of 69.55% and only 47.13% for uninsured rights issue.
8 Finally, the mean (median) expected reduction in blockholdings equals 3.12% (0.80%) for the entire sample. The largest ownership dispersion is observed for uninsured rights (3.96%) but our results don’t exhibit significant differences between the free float variation after standby rights issues and after uninsured rights issues.
2.3. Valuation issues
A French subscription right can be seen as an American warrant as it has the same features. Indeed, it is issued by a firm and it offers the holder the right but not the obligation to buy new shares during a certain period of time (subscription period) at a strike price (subscription price) which is at a discount to the current market price. However, there are two main differences between an American warrant and a French right:
1) For rights, the due date of the payment of the subscription price does not coincide with the end of the subscription period. But, on the contrary to other markets like Finland (see Hietala 1994), in France, there is no compensation for payments made before the expiration date.
2) The shares acquired through the exercise of rights may not offer the same rights to the shareholder (voting rights, right to fully paid dividend). We excluded those cases (7) from our study.
Given these characteristics, we decided to compare the fair value of the rights on the French market with the fair value of an American warrant. As discussed by Galai and Schneller (1978), the pricing of a warrant (issued by a company) and a call option (issued by an individual) differs because of the warrant’s potential dilution effect on the firm’s equity. Indeed, if a warrant is issued and exercised, it increases the number of shares outstanding and thus dilutes the equity of its stockholders. They show that, in order to prevent arbitrage, the value of a warrant (W0) must satisfy equation 1:
W0=C0/(1+q) (1)
Where C0 is the value of a call option on the stock of an (otherwise) identical firm without warrant and q is the ratio of the number of warrants to the numbers of outstanding shares (dilution effect).
Let’s, first, consider, the fair value of a call option of an identical firm without warrant. It can be split into two components: the time value and the intrinsic value. The time
9 value captures the possibility that the option may increase in value due to volatility in the underlying asset and depends on the time until the expiration date and the volatility of the stock price. We assume that, in our case, time value is close to zero since rights are short dated and deeply in the money. C0 can therefore be resumed to the intrinsic value of an American call option on a non dividend paying stock (equation 2):
C0=Max(0,S*-Ke-rt) (2)
where S* is the stock price of an identical firm without warrant, K the subscription price of the right, r the interest rate (3 month PIBOR or EURIBOR), and t the fraction of the year between the transaction day and the last possible day for exercise. The fair value of a right would therefore be (following equation 1):
W0=Max(0,S*-Ke-rt)/(1+q) (3)
However, we argue that the relation above is not important in our empirical tests because we use the price of the underlying stock in order to compute the intrinsic value instead of the stock of an identical firm without warrants. Indeed, the underlying stock price during the subscription period (St) already reflects the potential dilution (q) of the warrants exercice (Hietala (1994) and Poitras (2002)). Galai and Schneller are concerned about long dated warrants, which require adjustment for the possibility of significant changes to the stock during the period leading to the exercise of the warrant (which is not our case).
Furthermore, one can argue that, the variation of the debt to equity ratio resulting from the warrant’s exercise affects the valuation of the right. However, we assume that, similarly to the dilution effect, this modification of the capital structure is already reflected in the stock price of the underlying asset during the subscription period since the information is given to the market at the announcement date.
As a conclusion, we computed the fair value of a right (V) by using the following equation:
(4)
where S is the transaction price of the underlying stock at the nearest second, and N the number of shares that can be subscribed with one right.
10 3. Trading patterns
3.1. Stock market
We used NYSE Euronext intraday transactions and quotes data in order to compute unsigned and signed trading activity measures. We considered two periods for analysis. First the estimation period defined as the period from -180 to -30 trading days before the announcement date (AD). Second, the offering period which is defined in the AMF prospectuses.
- Unsigned trading activity measures:
During the estimation period, we calculated “normal” daily trading measures defined as average euro trading volume (EURVOL) and turnover (TURN). During the offer period, we estimated abnormal measures of trading volume (ABEURVOL) and turnover (ABTURN) as the difference between the observed average trading volumes of the day of interest and the normal daily trading volumes. Since the transactions data on the French market are not tagged with an investor identification code (data are not public), we cannot distinguish institutional investors from household investors. We therefore decided to analyze separately small (1-400 shares), medium (500 to 9,000 shares) and large (more than 10,000 shares) trades, making the assumption that institutional investors like banks, nonfinancial corporations, mutual funds perform the largest trades.
- Signed trading activity measures
According to the Lee and Ready (1991) algorithm, we designated each transaction as either buyer-initiated or seller-initiated but no delay rule was imposed. First, we associated to each trade, the quotes immediately before (Henker and Wang (2006)). If a transaction occurs above the prevailing quote mid-point, it is signed as buyer-initiated and if it occurs under, as seller-initiated. Then, if a transaction occurs exactly at the prevailing mid-point, it is signed using the last non-zero price change according to the tick test: buyer initiated if the sign of the last non-zero price change is positive and vice-versa.
During the estimation period, we then computed the following signed measures: NOIMB (the number of buyer-initiated trades less the number of seller-initiated trades divided by the sum the two types of trades); EOIMB (the buyer-initiated euros paid less the seller-initiated euros received divided by the sum of the two). Following Chordia and al. (2002) and Huh and
11 al. (2005), we use those order imbalance measures in order to obtain more information on the differential behavior of small vs. large traders. NOIMB is more likely to exhibit the behavior of small traders as it only counts the frequency of trades and ignores the information content of trade size, therefore weighting smaller trades more heavily. EOIMB, on the other hands, measures the information content of trade size as well as the frequency and is, so, more likely to reflect the trading behavior of large traders. Next, during our event period, we estimated abnormal measures of order imbalances (ANOIMB, AEOIMB).
Furthermore, we performed a standard event study in order to measure the average impact on French stock prices of a rights issue at the announcement date (AD), during the Pre Offer period2 and during the Offer period. The estimation of the market model coefficients is obtained for the estimation period (-180 to -30 trading days prior the offer announcement) and the market index return used is the MSCI index.
Table 2 summarizes those trading activity measures for standby rights issues and uninsured rights issues.
[Insert Table 2]
First we observe striking differences in ex-ante trading patterns according to the flotation method. Firms using standby rights have larger mean and median trading volumes than uninsured rights confirming previous results by Ginglinger and al. (2009).The mean (median) total daily euro volume is of 13,3 M€ (0.5 M€) for standby rights compared to 2,8 M€ (0.02 M€) only for uninsured rights issues. Those results hold for all size of trades. This could be explained by the differences in ownership structure between the firms who choose standby rights and those who choose uninsured rights. Indeed, as reported in table 1, we observe lower ownership concentration (more widely held firms, lower percentage of shares held by the main shareholders and blockholders) for firms choosing standby rights. The results also suggest that both order imbalance measures are generally under zero meaning that SEO firms experience more seller initiated shares. However, order imbalance measures are insignificant for firms choosing standby rights but significant at the 1% level for firms using uninsured rights indicating that those firms experience far more seller initiated trades during our estimation period.
2
12 During the offer period, we observe a significant increase in turnover and in daily trading volumes for standby rights and this for all size of trades. On the other side, uninsured rights experience an increase of the mean total daily trading volumes of small trades (significant at the 10% level) only. Still, looking at the median values of total daily trading volume, the increase is significant at the 1% level for small trades and at the 10 % level for medium trades. Regarding, the abnormal order imbalance measures, they are negative and significant for all type of rights issues meaning that there is an increase in Seller initiated trades by small and large traders during the offering. However, during uninsured rights issues, the abnormal euro volume order imbalance is negative and significant at the 10% level only but no significant statistical difference was found between the two type of issues.
The mean and median abnormal returns at the announcement date and during the Pre Offer period are negative but insignificant for the whole sample. We also observe negative and significant mean (median) abnormal returns during standby rights issues of-8.52% 5.52%). During uninsured rights, mean cumulative abnormal returns (CAR) are negative (-3.35%) but insignificant. However, the median cumulative abnormal returns are negative and significant (-5.10%).
3.2. Rights market
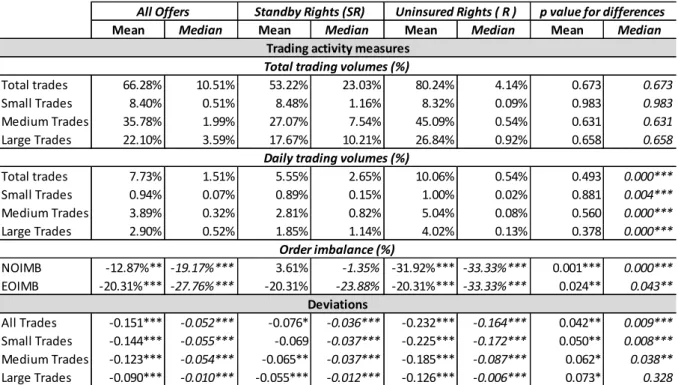
Similarly to the stock market, we computed trading activity measures on the rights market. First, we analyzed total trading volumes during the subscription period by dividing the total volume by the total number of rights distributed for each rights issue. Second, we computed daily trading volumes by dividing the mean daily volume by the total number of rights distributed. Next, we calculated order imbalance measures to analyze the Buyer and Seller initiated transactions. For those measures, we have only 98 observations since transaction quotes data on the rights market were not available for all issues. Finally, we compared the actual open market transaction prices with the intrinsic value of the rights given by equation 1. We calculated deviations by dividing the difference between the transaction price and intrinsic value by the intrinsic value and analyzed separately small (1-400 shares), medium (500 to 9,000 shares) and large (more than 10,000 shares) as shown in table 3.
[Insert table 3]
First, we find no statistical difference between the percentage of total rights traded during standby rights and during uninsured rights. The mean (median) percentage of total
13 rights traded is of 66.3% (10.51%) and the mean (median) daily percentage of rights traded is 7.73% (1.51%) for the whole sample.
Moreover, the mean (median) daily percentage of rights traded for the whole sample is 7.73% (1.51%) and is statistically larger (according to the wilcox test) for uninsured rights than for standby rights (2.65% vs. 0.54%). The majority of the trades were performed by medium and large traders since they account for 90% of the trades during uninsured rights and 84% during standby rights.
With regard to order imbalance measures during standby rights, results suggest more buyer initiated transaction by small traders and more seller initiated transactions by large traders. However, those measures are statistically not significant. On the other side, during uninsured rights, there are far more seller initiated trades from large and small traders since the mean and median NOIMB and EOIMB are negative and significant.
Last, table 3 suggests that shareholders who were allocated rights tend to sell them below their intrinsic value since the mean deviation is of -0.15 and is negative and significant for the whole sample (). However, the median value of deviations is only of -0.05 but is still significant at the 1% level. The differences between mean and median values observed in table 3 are explained by extreme cases where the volume weighted price discount is more than 50%. Looking at the differences in medians between small and large trades, we observe deviations of -0.05 for small trades and only -0.01 for large trades. This difference can be explained by the fact that small traders are likely to be much less sophisticated than large traders. Furthermore, table 3 reports mean and median deviations that are statistically larger during uninsured rights than during standby rights. More precisely, the mean (median) value of the deviation is of -0.23 (-0.16) for uninsured rights and only -0.08 (-0.04) for standby rights.
4. Explaining trading patterns
For our sample of standby rights, the univariate results of trading patterns during the offering suggest that financial intermediation occurs. Marsh (1980) interprets the standby agreement of rights issues as the sale of a portfolio of put options (one for each right). Indeed, the issuer buys a put option giving him the right to put a failed issue onto the underwriter. If a shareholder sells his rights, the underwriter can fulfill the obligation to take-up shares by purchasing rights on the open market. In this case, he creates a synthetic long forward
14 position in the stock by selling puts (standby agreement) and buying calls (rights). In order to mitigate his risk, Singh (1997) shows that the underwriter short sells3 the underlying stock and creates by doing so, synthetic short position in a riskless zero coupon bond. The negative returns and increase in Seller initiated trades displayed in table 2 are consistent with short selling strategies. Our results also suggest that underwriters intervene on the rights market since we found striking differences in order imbalance measures and deviations during standby rights and uninsured rights.
During uninsured rights offerings, we found an increase in small trades volumes and in Seller initiated trades as well as negative abnormal returns suggesting that similarly to underwriters of standby rights, individual shareholders are inclined to hedge their shares and intermediate non-underwritten rights offering by using short selling strategies (Peterson (2007)). Nevertheless, the results are weaker and less significant than those obtained during standby rights and following the active intermediation of underwriters.
In order to explore trading patterns and to test the hypotheses of financial intermediation of underwriters and shareholders during a rights issue, we consider, in the next step, time-series regressions of order imbalance and abnormal returns as well as deviations on the rights market during the offer period.
4.1. Multivariate analysis of order imbalance
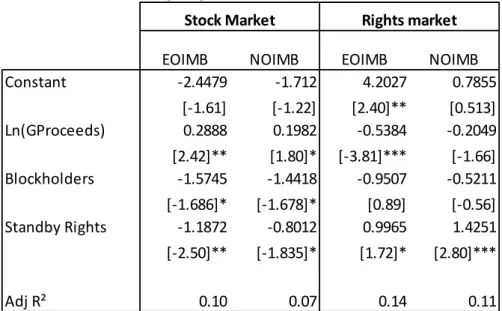
First, we analyze the determinants of order imbalances measures during rights offerings. We therefore accumulated the abnormal order imbalance (CAOIB) for both ANOIMB and AEOIMB on the stock market as well as the order imbalance (NOIMB and EOIMB) on the rights market and performed the following cross-sectional analysis:
CAOIBOfferi = α + β0log(Gproceedsi) + β1 Block + β2 standby rightsi + εi
The explanatory variables are defined by the size of the offering measured by the natural logarithm of gross proceeds (Gproceeds), the ownership concentration measured by the percentage of the capital held by blockholders (Block) and a dummy variable that is equal to 1 if the issue is underwritten (standby rights). Several other variables were tested like the use of the funds, the type of control, free float variation, percentage of the issue not taken up by blockholders, percentage of shares held by the main shareholder, turnover, returns, flotation
3
15 costs, trading volumes and order imbalance on the rights market but due to their lack of statistical significance, they were, however, not reported.
[Insert table 4]
As table 4 demonstrates, on the underlying stock market, order imbalance is negatively related to the existence of an underwriter and to ownership concentration. With regards to euro volume order imbalance, the coefficient of standby rights is negative and significant at the 5% level. This result confirms the hypothesis of financial intermediation by underwriters during the offer period. They short sell the shares, leading to excess sales in the case of standby rights. The coefficient of blockholders is also negative but significant at the 10% level only. Similarly to underwriters, shareholders short sell their shares during the offer period but with a weaker impact on euro volume order imbalance. Finally, not surprisingly, the size of the offer has a positive impact on euro volume order imbalance since the coefficient of proceeds is positive and significant at the 5% level. We obtain similar results for trade number imbalance since the coefficients of blockholders and standby rights are negative and the coefficient of proceeds is positive but only significant at the 10% level.4 Regarding the rights market, we found no impact of ownership concentration or the size of the issue on order imbalance since the coefficients are insignificant. However, the existence of an underwriter has a positive and significant impact on euro volume and trade number order imbalances. This last result can be explained by the hedging strategy of an underwriter: he buys rights in order to create a synthetic long forward position in the stock as discussed before.
4.2. Multivariate analysis of abnormal returns
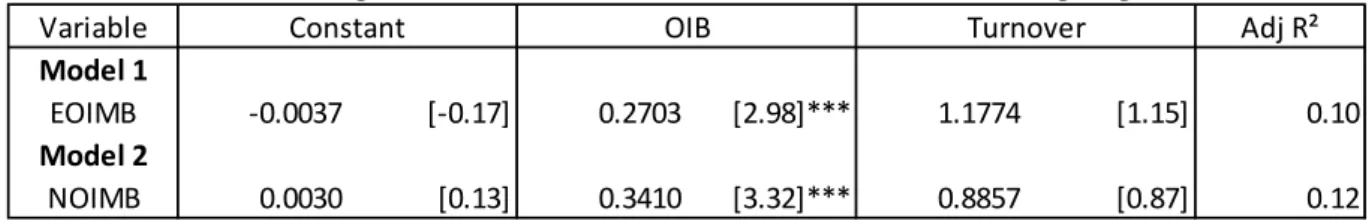
Next, we consider time-series regressions of cumulative abnormal returns during the offer. Table 5 reports the estimation results from the following regression:
CAR Offeri = α + β0OIMBi+ β1 TURNi +εi
We include in the analysis order imbalance measures and a scaled volume measure (turnover) as a control variable (see Huh and al. (2005)).
[Insert table 5]
4
16 Cumulative abnormal returns during the offer are strongly and positively related to both euro volume and trade number order imbalance at a 1% level respectively. Thus, the negative order imbalance (excess sales) lead to negative abnormal returns observed during the offer.
Considering the determinants of order imbalance displayed in table 4, our results confirm the hypotheses stated before namely:
- The underwriters are net sellers of stock and buyers of rights during the offer period of standby rights
- Blockholders act as underwriters during rights issues and are net sellers of stock during the subscription period of a rights offer.
- Trading patterns of underwriters and blockholders lead to negative cumulative abnormal returns during the offer.
4.3. Multivariate analysis on the trading of rights
We further examine the effect of issue, issuer and trading characteristics on the rights market and more precisely on deviations between transaction price and fair value of a right by performing the following regression model:
Deviationi = α + β1Change shares+ β2Ln(GProceeds)i+ β3Main shareholderi + β4 standby rightsi + β5 Usei + β6 Free Float variationi + β7Liquidityi εi
The dependant variable is the mean deviation between the transaction price and the intrinsic value of rights. Considering the large dispersion of our sample in terms of deviation and the extreme values found, we decided to test this model on a reduced sample of 100 issues by excluding outliers. The explanatory variables are defined by the percentage of change in shares, the percentage of capital held by the main shareholder (Main shareholder), the free float variation, a dummy equal to 1 if the issue is underwritten (standby rights), and the use of funds (a dummy equal to 1 if the firm issues shares in order to acquire another firm or to invest in a specific project). We also included control variables on the liquidity of the rights market estimated by the ratio of the total rights traded on the total rights distributed and on the size of the issue (the natural logarithm of Gross Proceeds). Several other variables were tested but due to their lack of statistical significance, they were, however, not reported.
17 [Insert Table 6]
First, the fact that the offering is held in order to acquire another company or to invest in a specified project reduces the difference between transaction price and intrinsic value of rights. Investors are willing to acquire rights at a higher price and thus to acquire new shares if the use of funds is clearly defined in the AMF prospectus. Next, we found that the deviation is negatively related to the existence of an underwriter since the coefficient of standby rights is negative and significant at the 10% level. The transaction prices on the rights market tend to be lower than the fair value of the rights in the case of a standby agreement. As shown previously, underwriters are net buyers of rights in order to fulfill the standby agreement. However, they are also highly sophisticated investors and it is likely that they take advantage of arbitrage opportunities in order to respect their obligation to take up new shares. Furthermore, the results show that a negative deviation increases with ownership concentration since the coefficient of Main shareholder is negative and significant at the 1% level. The market tends to devalue rights and therefore the possibility to participate to the issue in case of strong ownership concentration. Indeed, ownership concentration is related to monitoring issues, information asymmetry, reduced liquidity on the stock market and conflicts between minority and majority shareholders.
5. Conclusion
This paper contributes to the existing literature concerning the equity financing paradox by identifying additional indirect costs on the rights market and on the stock market during the offering. We study trading dynamics during standby rights issues and uninsured rights issues held on the French market over the period 1995-2006. Our paper investigates how underwriter and shareholders mitigate their risk during these types of issues.
We first document an increase in seller initiated trades by underwriters and blockholders on the stock market during the offer period of rights issues. Those results suggest that underwriters and blockholders actively intermediate the offering using short selling strategies. Second, we report significant negative abnormal returns during the offer period mainly explained by order imbalance measures. Hedging strategies of underwriters and blockholders, thus, result in additional indirect costs during rights issues. Finally, we find that shareholders tend to sell their rights at a price that is lower than their fair value in the case of high ownership concentration and the existence of an underwriter. We argue that those additional
18 indirect costs on the stock and the rights market explain that firms avoid both types of rights offerings to the benefit of public offerings.
19 References
Eckbo, B.E., Masulis, R.W. (1992) Adverse selection and the rights offer paradox, Journal of Financial Economics 7, 197-226.
Eckbo, B.E., Masulis, R.W and Norli, O. (2007) Security Offerings, Handbook of Corporate Finance: Empirical Corporate Finance, E.Eckbo (ed.), Chapter 13.
Chordia, T., R. Roll, and Subrahmanyam A. (2002), Order Imbalance, Liquidity, and Market Returns, Journal of Financial Economics, 65, 111–30.
Cronqvist, H. and Nilsson, M. (2005) The choice between rights offerings and private equity placements, Journal of Financial Economics 78, 375-407.
Galai, D. and Schneller, M.I. (1978) Pricing of Warrants and the Value of the Firm, Journal of Finance 33, 1333-1342
Gajewski, J.F and Ginglinger,E. (2002) Seasoned Equity Issues in a Closely Held Market: Evidence from France, European Finance Review 6, 291-319.
Gebhardt, G. and Heiden, S.(1998) Explaining capital market reactions to equity offers by german companies, Working paper, University of Frankfurt.
Ginglinger,E., Matsoukis, L. and Riva, F. (2009) Stock Market Liquidity and the rights offer paradox Working Paper, University Paris-Dauphine.
Hansen, R.S (1988) The Demise of the Rights Issue, The Review of Financial Studies, 1, 289-309.
Henker, T. and Wang, J.X. (2006) On the importance of timing specifications in market microstructure research, Journal of Financial Markets, 9, 162-179.
Hietala,P. (1994) The efficiency of the Finnish market for rights issues, Journal of Banking and Finance 18, 895-920.
Hietala, P. and Löyttyniemi, T. (1991) An implicit dividend increase in right issues: Theory and evidence, Working Paper, Insead.
20 Huh, S.W. and Subrahmanyam, A. (2005) Order flow patterns around seasoned equity offerings and their implications for stock price movements, International Review of Finance 5, 75-111.
Knüpfer, S. and Rantapuska, E. (2008) Which Investors leave Money on the Table? Evidence from Rights Issues, Review of Finance 12, 701-733.
Lee,C. and Ready M. (1991), Inferring Trade Direction from Intraday Data, Journal of Finance, 46, 733–47.
Marsh, P. (1980), Valuation of Underwriting Agreements for UK Rights Issues, Journal of Finance 35, 693-716.
Myers, S and Majluf, N.S. (1984) Corporate financing and investment decisions when firms have information that investors do not have, Journal of Financial Economics 13, 187–221.
Peterson, M.A. (2007) Rights Offerings can be costly: Intraday Evidence from Non-Underwritten Rights Offerings, Working Paper, College of Business and Administration, Southern Illinois University.
Poitras, G. (2002) Short sales restrictions, dilution and the pricing of rights issues on the Singapore Stock Exchange, Pacific-Basin Finance Journal 10, 141-162.
Singh, A. (1997) Layoffs and underwritten rights offers, Journal of Financial Economics 43, 105-130.
Slovin, M.B., Sushka, M.E. et Lai, K.W.L. (2000) Alternative flotation methods, adverse selection and ownership structure: evidence from seasoned equity issuance in the U.K, Journal of Financial Economics 57, 157-190.
Tsangarakis, N.V. (1996), Shareholder wealth effects of equity issues in emerging markets: Evidence from rights offerings in Greece, Financial Management 25, 21–32.
21
Figure1. Time line of dates used in Rights issues in France.
Announcement date (AD)
Ex-Rights Date (ERD)
End of the Offer (EXP) AMF
date
Rights trading period Stock trades cum rights
Listing date of newly issued
shares Board
Meeting
This figure shows the different dates of the process of a rights issue from the Board Meeting to the end of the offer.The first institutional announcement of the offering generally comes in the registration statement filed with the AMF (AMF date). The Ex Rights date corresponds to the beginning of the offer and the trading of the rights. The Announcement date corresponds to the first mention of the offer in the press
22 Table 1. Descriptive Statistics
Mean Median Mean Median Mean Median Mean Median
Nb. of observations Change in shares(%) 28.28% 21.83% 23.21% 18.62% 33.69% 25.00% 0.00*** 0.00*** Subscription price 47.61 20.25 66.26 34.09 27.67 13.50 0.01** 0.01*** Discount -21.22% -21.03% -24.89% -23.67% -17.30% -14.82% 0.04** 0.00*** Allocation ratio 1.47 0.28 0.42 0.23 2.59 0.33 0.13 0.00*** Proceeds 313.16 37.94 420.40 123.15 198.51 13.25 0.10* 0.00*** Costs/Proceeds 2.82% 2.44% 3.12% 3.01% 2.50% 2.15% 0.05* 0.03** Size 3 227.27 128.65 4 784.96 520.25 1 562.16 57.67 0.08* 0.00*** Main shareholder 40.28% 39.68% 34.37% 28.73% 46.59% 47.18% 0.01*** 0.00*** Blockholders 55.75% 59.90% 45.24% 42.85% 66.99% 70.50% 0.00*** 0.00*** External 58.71% 60.01% 69.55% 72.21% 47.13% 43.59% 0.00*** 0.00***
Free Float variation 3.12% 0.80% 2.34% 0.71% 3.96% 1.21% 0.25 0.85
Widely held firms 0.28 0.00 0.39 0.00 0.17 0.00 0.01*** 0.01***
Family control (%) 0.24 0.00 0.24 0.00 0.24 0.00 0.99 1.00
Financial control (%) 0.19 0.00 0.23 0.00 0.16 0.00 0.21 0.21
Corporate control (%) 0.46 0.00 0.40 0.00 0.52 1.00 0.33 0.33 The sample includes 120 Rights issues held on the French Stock Exchange from 1995 to 2006. This table reports the mean and the median of each variable and the significance for the differences in means and medians between Standby Rights issues and uninsured Rights issues. Percentage of change in the number of shares is number of shares issued at number of shares after the issue; Discount is offer price less stock price at stock price; Allocation ratio is the number of rights required to subscribe to one share, Proceeds is gross proceeds (Euro M). Size is market value (Euro m); Main shareholder is % of the shares held by the main shareholder; Blockholders is the % of the shares owned by the shareholders whose names are included in the registration statement filed with the AMF; External is % of the issue not taken up by blockholders; free float expected variation is the difference between free float after the issue and free float before the issue where free float after the issue is measured by the following ratio : (Market value*Free float before the issue + Gross proceeds*percentage of the issue offered to external investors)/(Gross proceeds +Market value);Widely held firms is % of firms with Main shareholder less than 20%; Family control, Corporate control, Financial control are dummies equal to 1 if the firm is controlled by a family, a corporate or a financial firm respectively . *,**,*** represent the significance level of 10%, 5% and 1% respectively.
All Rights Issues
Standby Rights Issues (SR)
Uninsured Rights Issues ( R)
p-value for differences between SR and R
23
Table 2: Descriptive trading statistics on the stock market of issuing firms
Mean Median Mean Median Mean Median Mean Median
Total trades 8 226 387 126 407 13 318 717 578 042 2 776 700 23 742 0.02** 0.00*** Small Trades 1 782 714 34 309 3 067 644 222 981 407 614 9 972 0.02** 0.00*** Medium Trades 5 092 141 37 217 8 112 909 172 954 1 859 390 8 282 0.05** 0.00*** Large Trades 1 351 531 5 417 2 138 164 62 772 509 696 0 0.01** 0.00*** Turnover 0.25% 0.14% 0.28% 0.21% 0.22% 0.09% 0.45 0.00*** NOIMB -5.39%*** -6.82%*** -2.40% -1.92%* -8.59%*** -12.74%*** 0.06* 0.01*** EOIMB -4.08%*** -4.04%*** -0.59% -0.38% -7.81%*** -11.69%*** 0.02** 0.00*** Total trades 13 399 588*** 43 505*** 22 946 951*** 1 063 713*** 2 999 783 7 151*** 0.02** 0.00*** Small Trades 1 019 258** 11 719*** 1 862 184** 124 963*** 101 071* 2 400*** 0.77 0.00*** Medium Trades 8 865 940** 9 532*** 15 036 129** 351 561*** 2 144 841 810* 0.05* 0.00*** Large Trades 3 514 389*** 0** 6 048 637*** 0** 753 870 0 0.02** 0.37 Turnover 0.52%*** 0.05%*** 0.74%** 0.19%*** 0.28%* 0.02%** 0.02** 0.00*** NOIMB -8.99%*** -4.86%*** -8.60%*** -4.62%*** -9.42%** -4.92%*** 0.87 0.93 EOIMB -9.50%*** -6.14%*** -10.11%*** -6.19%*** -8.84%* -5.57%** 0.80 0.39 AD 0.686% -0.349% 0.479% -0.853% 0.974% -0.114% 0.691 0.713
Pre Offer Period 0.128% -1.192% -0.824% -1.866% 1.450% -0.894% 0.361 0.428 Offer Period -6.357%*** -5.413%*** -8.523%*** -5.520%*** -3.345% -5.069%*** 0.107 0.391
Panel C. Abnormal returns
This table exhibits the descriptive statistics of key variables for the rights issues during the estimation period and offer period as well as abnormal returns.
In Panel A., statistics are given for the estimation period [-180,-0] where date 0 is the announcement date. In Panel B. , abnormal measures are estimated as the difference between the observed trading measures during the offer period and their average value during the estimation period. Total trades is the daily total volume (nber of shares traded multiplied by the average daily trading price); Small trades, Medium trades and Large trades are the daily total volume of small trades, medium trades and large trades respectively; Turnover is the ratio of euro tading volume divided by market value; NOIMB is trade number order-imbalances and EOIMB is the euro volume order imbalances.
In Panel C., abnormal returns are computed at the announcement date (AD), Pre Offer period (20 days before the offering) and during the Offer period.
*,**,*** represent the significant level of 10%,5% and 1% respectively.
Abnormal signed measures Unsigned measures
Signed measures
Panel B. Offer Period Abnormal unsigned measures
All Offers Standby Rights (SR) Uninsured Rights ( R ) p value for differences Panel A. Estimation Period
24
Table 3: Descriptive trading statistics on the rights market of issuing firms
Mean Median Mean Median Mean Median Mean Median
Total trades 66.28% 10.51% 53.22% 23.03% 80.24% 4.14% 0.673 0.673 Small Trades 8.40% 0.51% 8.48% 1.16% 8.32% 0.09% 0.983 0.983 Medium Trades 35.78% 1.99% 27.07% 7.54% 45.09% 0.54% 0.631 0.631 Large Trades 22.10% 3.59% 17.67% 10.21% 26.84% 0.92% 0.658 0.658 Total trades 7.73% 1.51% 5.55% 2.65% 10.06% 0.54% 0.493 0.000*** Small Trades 0.94% 0.07% 0.89% 0.15% 1.00% 0.02% 0.881 0.004*** Medium Trades 3.89% 0.32% 2.81% 0.82% 5.04% 0.08% 0.560 0.000*** Large Trades 2.90% 0.52% 1.85% 1.14% 4.02% 0.13% 0.378 0.000*** NOIMB -12.87%** -19.17%*** 3.61% -1.35% -31.92%*** -33.33%*** 0.001*** 0.000*** EOIMB -20.31%*** -27.76%*** -20.31% -23.88% -20.31%*** -33.33%*** 0.024** 0.043** All Trades -0.151*** -0.052*** -0.076* -0.036*** -0.232*** -0.164*** 0.042** 0.009*** Small Trades -0.144*** -0.055*** -0.069 -0.037*** -0.225*** -0.172*** 0.050** 0.008*** Medium Trades -0.123*** -0.054*** -0.065** -0.037*** -0.185*** -0.087*** 0.062* 0.038** Large Trades -0.090*** -0.010*** -0.055*** -0.012*** -0.126*** -0.006*** 0.073* 0.328
This table exhibits the descriptive statistics of key variables on the rights' market
Total trades is the daily total volume divided by the total of rights; Small trades, Medium trades and Large trades are the daily total volume of small trades, medium trades and average trades respectively; Turnover is the ratio of euro tading volume divided by market value; NOIMB is trade number order-imbalances and EOIMB is the euro volume order imbalances.
*,**,*** represent the significant level of 10%,5% and 1% respectively.
Total trading volumes (%)
Daily trading volumes (%)
Order imbalance (%)
Deviations
All Offers Standby Rights (SR) Uninsured Rights ( R ) p value for differences Trading activity measures
25
EOIMB NOIMB EOIMB NOIMB
-2.4479 -1.712 4.2027 0.7855 [-1.61] [-1.22] [2.40]** [0.513] 0.2888 0.1982 -0.5384 -0.2049 [2.42]** [1.80]* [-3.81]*** [-1.66] -1.5745 -1.4418 -0.9507 -0.5211 [-1.686]* [-1.678]* [0.89] [-0.56] -1.1872 -0.8012 0.9965 1.4251 [-2.50]** [-1.835]* [1.72]* [2.80]*** Adj R² 0.10 0.07 0.14 0.11
Stock Market Rights market
This table presents the cross sectional regression model explaining the cumulative abnormal order imbalance on the stock market and rights market during a rights issue. The regressions were performed on 98 observations only on the rights market.
The dependant variables are the euro-volume order imbalance (EOIMB) and the trade number order imbalance (NOIMB).
The explanatory variables are the following: Gross Proceeds (GProceeds), Percentage of the capital held by blockholders (Blockholders) and a dummy equal to 1 if the issue is underwritten (standby rights).
*,**,*** denote the significance at the 10%,5% and 1% levels respectively. t-statistics are in brackets.
Table 4. Cross sectional regression model on cumulative abnormal order imbalances during a rights issue
Constant Ln(GProceeds) Blockholders Standby Rights
26 Variable Adj R² Model 1 EOIMB -0.0037 [-0.17] 0.2703 [2.98]*** 1.1774 [1.15] 0.10 Model 2 NOIMB 0.0030 [0.13] 0.3410 [3.32]*** 0.8857 [0.87] 0.12
Constant OIB Turnover
Table 5. Cross-sectional regression model on cumulative abnormal returns during a rights issue
This table presents the cross sectional regression model explaining the cumulative abnormal returns during a rights issue.
The dependant variable is the cumulative abnormal return during the Offer period.
The explanatory variables are the following: euro-volume order imbalance in model 1 (EOIMB), trade number order imbalance in model 2 (NOIMB) and turnover over the offer period.
*,**,*** denote the significance at the 10%,5% and 1% levels respectively. t-statistics are in brackets.
Deviation Constant -0.1304 [-1.39] Change shares -0.3124 [-3.53]*** Proceeds 0.016 [0.04]** Use 0.0551 [1.98]* Main shareholder -0.142 [-2.51]** Free Float variation 0.2289 [0.96] Standby rights -0.0517 [-1.76]* Liquidity 0.0041 [1.16] adj.R² 0.23
Table 6. Cross-sectional regression model on deviations between transaction price and intrinsic value of rights
This table presents the cross sectional regression model explaining the deviation between transaction prices and intrinsic value of rights.
The dependant variables is the mean deviation during the offer period
The explanatory variables are the following: the percentage of change in shares (change shares), the Natural logarithm of the Gross proceeds, the percentage of capital held by the main
shareholder (Main shareholder), the free float variation, the use of funds (Use) and the existence of an underwriter (standby rights), liquidity on the rights market (Liquidity).
*,**,*** denote the significance at the 10%,5% and 1% levels respectively. t-statistics are in brackets.