HAL Id: tel-02563165
https://pastel.archives-ouvertes.fr/tel-02563165
Submitted on 5 May 2020HAL is a multi-disciplinary open access archive for the deposit and dissemination of sci-entific research documents, whether they are pub-lished or not. The documents may come from teaching and research institutions in France or abroad, or from public or private research centers.
L’archive ouverte pluridisciplinaire HAL, est destinée au dépôt et à la diffusion de documents scientifiques de niveau recherche, publiés ou non, émanant des établissements d’enseignement et de recherche français ou étrangers, des laboratoires publics ou privés.
EEG
Norhasliza Mohamad Yusoff
To cite this version:
Norhasliza Mohamad Yusoff. Visual Cognitive Driving Distraction Detection using EEG. Other [cond-mat.other]. Ecole nationale supérieure d’arts et métiers - ENSAM; Universiti Teknologi PETRONAS (Seri Iskandar, Perak, Malaisie), 2019. English. �NNT : 2019ENAM0051�. �tel-02563165�
Arts et Métiers - Campus de Cluny Institut Image – LiSPEN
2019-ENAM-0051
École doctorale n° 432 : Sciences des Métiers de l’ingénieur
présentée et soutenue publiquement par
Norhasliza MOHAMAD YUSOFF
le 6 décembre 2019
Visual Cognitive Driving Distraction Detection using EEG
Doctorat
T H È S E
pour obtenir le grade de docteur délivré par
l’École Nationale Supérieure d'Arts et Métiers
Spécialité “Informatique et traitement du signal”
Directeur de thèse : Frédéric MERIENNE
Co-encadrement de la thèse : Christophe GUILLET, Naufal SAAD
T
H
È
S
E
JuryM. Marc DANIEL, Professor, Université d’Aix-Marseille Président Mme Manolya KAVAKLI, Associate Prof., Macquarie University Rapporteur
M. Thierry POZZO, Professor, Université de Bourgogne Rapporteur
M. Frédéric MERIENNE, Professor, Arts et Métiers Examinateur
M. Christophe GUILLET, Maître de conférences, Université de Bourgogne Examinateur M. Naufal SAAD, Associate Prof., University Technology of PETRONAS Examinateur M. Mohd Zuki YUSOFF, Associate Prof., University Technology of PETRONAS Invité
iii
ACKNOWLEDGEMENTS
First and foremost, Alhamdulillah, thank you God for lending me this knowledge, guiding me every step and granted many beautiful memories throughout this journey. My deepest gratitude to my family who has been supporting me emotionally and financially when I needed the most.
Special thanks to my supervisors, Prof Frederic Merienne, AP Dr Christophe Guillet, AP Dr Naufal Saad and AP Dr Aamir Saeed Malik for the continuous support during my Ph.D. study, for their patience, motivation and immense knowledge. And thanks to Fred and Christophe for always making sure that I am comfortable and safe during my stay in France. Thank you for believing in me when I do not believe in myself.
It is a great pleasure to acknowledge my gratitude to my colleagues, fellow engineers, research scholars, lecturers, masters and undergraduate students at both LE2i laboratoire, Institut Image and CISIR, UTP. Their support, encouragement and credible ideas have been great contributors in the completion of the thesis.
Last but not least, thank you to the Government of Malaysia for supporting my Ph.D. study thru MyBrain15 and HiCOE research grant for the first three years of my candidacy.
iv ABSTRACT
Driving distraction shift the attention away from safe driving towards a competing task. Dual task paradigm defines distraction in terms of excessive workload and limited attentional resources. To fill the gap in driver’s safety research, the thesis aims to uncover the mechanics of detecting visual cognitive distraction by using physiological signals. There are 2 sets of experiments conducted with 18 participants. The first experiment with 10 participants aims at evaluating the effects of distraction and synchronising EEG signals. For statistical analysis, Shapiro Wilk test and two-way ANOVA have been used. The results state that the two visual cognitive distraction tasks are performed sequentially and reaction time is affected by the switch. For the second experiment with 8 participants, an integrated system has been created in C++, which involves a 4-wall CAVE system, a driving simulator using SCANeR simulation software, a simple EEG headset with 20 channels (Enobio 20), SMI Eye tracker, BeGaze software. As qualitative methods, SSQ and NASA TLX have been used to evaluate user feedback. As quantitative methods, maths equations, eye movements, EEG signals, and driving performance have been used. For data analysis, Matlab and SPSS and for statistical analysis, Shapiro Wilk test and one-way ANOVA have been used. The results indicate that experiment demands mental capacity, rather than physical capacity. Delta band frequencies in frontal lobe of EEG signals do not have a significant impact on discriminating between driving and distraction, but delta and theta band at central and parietal do. The results also revealed that theta and alpha band frequencies are indeed an important features in both experiments. In a task where subject can control when they are engaging towards the secondary task, beta band showed its statistical importance being the only one able to discriminate up to different level of cognitive tasks. The most striking similarity between both experiments were, some of the statistically significant features are overlapped between brain regions. A comparative analysis of machine learning techniques (SVMs vs Random Forests) in selecting relevant features of EEG signals, referring to the coherence values, has also been conducted. Results indicate that although in general random forests perform better than SVM classifier, F1-score for SVM demonstrates the highest scores (0.90).
v ABSTRAK
Pengalihan perhatian visual kognitif merupakan satu jenis pengalihan perhatian yang biasa dalam sebarang pemanduan. Dengan kepesatan kemajuan teknologi, ia mungkin membenarkan normalisasi dan adaptasi pengalihan perhatian kognitif visual semasa memandu. Untuk mengkaji kesan pengalihan perhatian, satu kaedah yang komprehensif sangat diperlukan untuk memahami mekanisme asas dan kesan pengalihan perhatian jenis-jenis ini untuk menganggar risiko. Kami mengusulkan bahawa pengalihan perhatian kognitif visual melibatkan paradigma pertukaran tugas, disamping paradigma dwitugas yang telah terkenal menjadi teori panduan dalam subjek ini. Ini kerana keupayaan visual perlu dikongsi antara tugas sekunder dan memandu, maka pertukaran tugas berlaku semasa pengalihan perhatian kognitif visual. Mengambil kira perkara ini, ciri-ciri EEG yang boleh digunakan untuk mengesan pengalihan perhatian kognitif visual, adalah mungkin lebih dari ciri-ciri teta, beta dan alfa dalam lobus frontal yang telah menjadi rujukan ciri di dalam paradigma dwitugas. Oleh itu, kami menguji teori ini melalui dua eksperimen. Dengan menggunakan ketumpatan spektral kuasa, dihitung menggunakan jelmaan gelombang kecil dan FFT, kami memperhatikan bahawa terdapat pertindihan jalur frekuensi yang signifikan dengan bahagian otak yang lain. Penemuan ini mencadangkan potensi menggunakan ciri-ciri EEG lebih dari lobus frontal serta jalur frekuensi delta dan gamma, kerana terdapat lebih dari satu teori beban kerja kognitif yang melibatkan pengalihan perhatian kognitif visual. Kami mengusulkan untuk menggunakan kaedah pemilihan ciri-ciri berdasarkan pembelajaran mesin bagi menyelidik ciri-ciri yang berkaitan untuk digunakan bagi klasifikasi. Selain dari ERSP, kami juga menggunakan nilai kekoherenan kerana ukuran ini mewakili ketersambungan rangkaian otak. Kami mendapati bahawa terdapat lebih banyak kawasan dan jalur frekuensi yang boleh digunakan untuk membezakan tugas tersebut. Skor F1 dari klasifikasi SVM dengan menggunakan ciri terpilih adalah 90% berbanding 52% apabila menggunakan ciri-ciri prapilihan seperti yang dilaporkan dalam literatur. Sebagai konklusi, EEG boleh digunakan untuk mengesan pengalihan perhatian kognitif visual yang mana klasifikasi prestasi boleh ditambah baik dengan memilih ciri-ciri yang berkaitan dengan tugas tersebut.
vi RESUME
Le principe de la distraction au volant est de détourner l'attention du conducteur en phase de conduite en toute sécurité au profit d'une tâche concurrentielle. Le paradigme de la double tâche repose sur l’hypothèse que la distraction se traduit par une charge cognitive excessive et des ressources restreintes en termes d'attention. Pour combler les lacunes des travaux de recherche portant sur l’étude de la sécurité des conducteurs, cette thèse vise à découvrir les mécanismes de détection de la distraction cognitive visuelle à l'aide de signaux physiologiques. A cette fin, deux séries d'expérimentations ont été menées avec 18 participants. La première expérimentation avec 10 participants vise à évaluer les effets de la distraction et de la synchronisation des signaux de l’EEG. Pour l'analyse statistique, le test de Shapiro-Wilk et l'analyse de variance à deux facteurs ANOVA ont été utilisés. Les résultats indiquent que les deux tâches de distraction cognitive visuelle sont exécutées de façon séquentielle et que le temps de réaction est affecté par le passage d'une tâche à l'autre. Pour la deuxième expérimentation avec 8 participants, un système intégré a été créé en C++, qui implique un système CAVE à 4 parois, un simulateur de conduite utilisant le logiciel de simulation SCANeR, un simple casque EEG à 20 canaux (Enobio 20), un SMI de suivi oculaire et un logiciel BeGaze. Comme paramètres qualitatifs, les réponses aux questionnaires SSQ et NASA-TLX ont été utilisés pour évaluer les commentaires des utilisateurs. Comme paramètres quantitatifs, des solutions d’équations mathématiques, des mesures de mouvements oculaires, de signaux EEG et de performances de conduite ont été utilisées. Pour l'analyse des données, les logiciels Matlab et SPSS ont été utilisés et pour l'analyse statistique, le test Shapiro-Wilk et ANOVA à un facteur. Les résultats indiquent que l'expérience exige une capacité mentale plutôt qu'une capacité physique. Les fréquences de la bande delta dans le lobe frontal des signaux EEG n'ont pas d'impact significatif sur la différentiation entre conduite et distraction, mais les bandes delta et thêta au centre et au pariétal en ont. Les résultats ont également révélé que les fréquences des bandes thêta et alpha sont effectivement des caractéristiques importantes dans les deux expérimentations. Dans une tâche où le sujet peut contrôler quand il s'engage dans la tâche secondaire, la bande bêta a montré son importance d’un point de vue statistique, étant la seule capable de faire la distinction entre différents niveaux des tâches cognitives. La similitude la plus frappante entre les deux expérimentations est que
vii
certaines des caractéristiques statistiquement significatives se chevauchent entre les régions du cerveau. Par conséquent, une analyse comparative des techniques d'apprentissage machine (SVM-RFE c. les forêts aléatoires) dans la sélection des caractéristiques pertinentes des signaux EEG, en combinaison avec les valeurs de cohérence, a également été réalisée. Les résultats indiquent que, bien qu'en général, les forêts aléatoires donnent de meilleurs résultats que le séparateur SVM, le score F1 du SVM avec SVM-RFE montre les scores les plus élevés (0.90).
ix TABLE OF CONTENTS Chapter 1 ... 1 1.1 Research Context ... 1 1.2 Research Problem ... 3 1.3 Research Question ... 4 1.4 Research Scope ... 4 1.5 Research Objective ... 5 1.6 Manuscript Structure ... 5 Chapter 2 ... 7 2.1 Overview ... 7 2.2 Attention ... 9
2.2.1 Task Switching Paradigm ... 11
2.2.2 Dual Task Paradigm ... 12
2.3 Definition of Visual Cognitive Distraction ... 13
2.4 Situation Awareness ... 15
2.5 Distraction Measurement Methods ... 16
2.5.1 Driving Performance Measures ... 17
2.5.2 Physical Measures ... 19
2.5.3 Biological Measures ... 20
2.5.4 Subjective Performance Measures ... 23
2.5.5 Hybrid Measures ... 24
2.5.6 Summary of Driving Distraction Measures ... 25
2.6 Electroencephalography ... 29
2.6.1 Brain function and dynamics ... 29
2.6.2 Feature Extraction ... 32
Challenges in driving distraction research ... 37
2.7 Feature Selection ... 38
2.8 Chapter Summary ... 41
Chapter 3 ... 43
3.1 Overview ... 43
x Chapter 4 ... 51 4.1 Overview ... 51 4.2 Methodology ... 52 4.2.1 Experimental Design ... 52 A. Participants ... 52 B. Experimental Protocol ... 52 C. Experimental Setup ... 54 4.2.2 Analysis Approach ... 55 A. Behavioural Response ... 56
B. EEG Analysis – Time Frequency Response ... 56
4.3 Results ... 58
4.3.1 Reaction Time ... 58
4.3.2 Event Related Spectral Perturbation ... 62
4.4 Discussion ... 68
Chapter 5 ... 71
5.1 Overview ... 71
5.2 Methodology ... 71
5.2.1 Participants ... 71
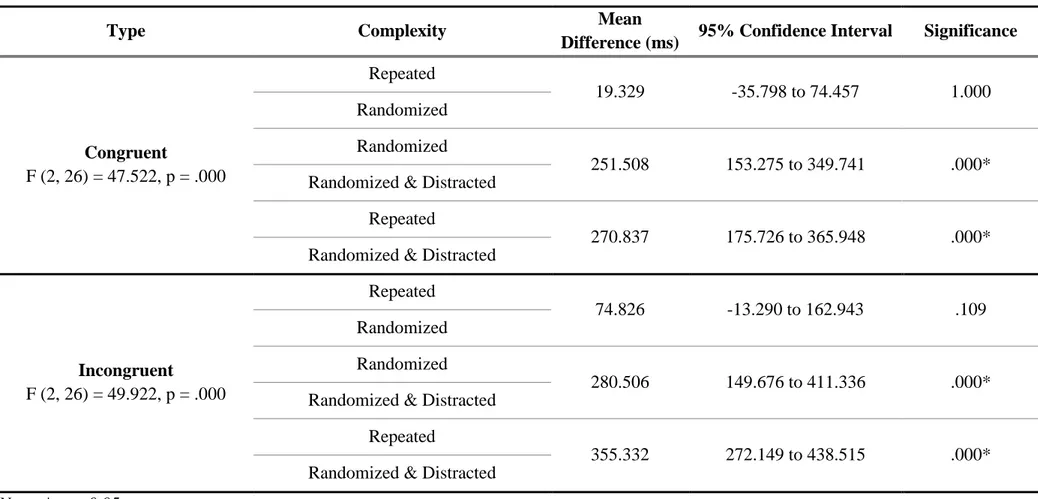
5.2.2 Hardware & Software ... 71
A. Medium Fidelity Driving Simulator in CAVE ... 72
B. Enobio 20 ... 73
C. SMI Eye Tracker ... 75
D. Hardware & Software Diagram ... 76
5.2.3 Scenario ... 79
5.2.4 Distraction Stimuli ... 80
5.2.5 Experimental Protocol ... 81
5.2.6 Analysis Approach ... 84
A. Driving Performance Measure... 86
B. Physical Measures – Eye Movement ... 88
C. Biological Measures – EEG ... 94
D. Measure of simulator sickness ... 96
E. Measure of cognitive workload... 97
5.3 Results ... 98
5.3.1 Driving Performance Features ... 98
xi
5.3.3 Event Related Spectral Perturbation ... 106
5.3.4 Simulator Sickness Questionnaire ... 111
5.3.5 Cognitive Workload Measures ... 111
5.4 Discussion ... 113
Chapter 6 ... 115
6.1 Overview ... 115
6.2 Methodology ... 115
6.2.1 Dataset and Data Split ... 115
6.2.2 EEG Data Pre-Processing and Features Extraction... 116
6.2.3 Part 1: Features Selection ... 118
A. Support Vector Machine based Recursive Feature Elimination (SVM-RFE)... 119
B. Random Forest ... 119
C. Evaluation Method – Jaccard Index ... 120
6.2.4 Part 2: Classification ... 121 6.3 Results ... 122 6.3.1 Selected Features... 122 6.3.2 Classification Performance ... 126 6.4 Discussion ... 129 Chapter 7 ... 133 7.1 Research Contribution ... 135
7.2 Limitation and future work ... 136
REFERENCES ... 137
APPENDIX ... 149
A. List of Publications ... 149
B. Distracted Stroop Test: Briefing pack and consent form ... 150
C. Distracted Stroop Test: Researcher Checklist ... 155
D. Distracted Driving: Briefing pack and consent form ... 156
E. Distracted Driving: Demographic Information ... 164
F. Distracted Driving: SSQ ... 165
G. Distracted Driving: NASA-TLX ... 166
H. Distracted Driving: Researcher Checklist ... 169
xiii
LIST OF TABLES
Table 2.1 Summary of brain activity during task switching. ... 12
Table 2.2 Summary of brain activity in dual task paradigm ... 13
Table 2.3 Summary of the effects that visual and cognitive distraction have on driving performance... 18
Table 2.4 The summary of EEG based distraction detection method. ... 22
Table 2.5 The summary of hybrid-based distraction detection method. ... 26
Table 2.6 Summary of distraction measurements as detection method. ... 28
Table 2.7 Summary of the pre-selected region/channel and frequency band. ... 38
Table 3.1 Summary of experiment 1 and experiment 2. ... 46
Table 3.3 Summary of Experiment 3. ... 49
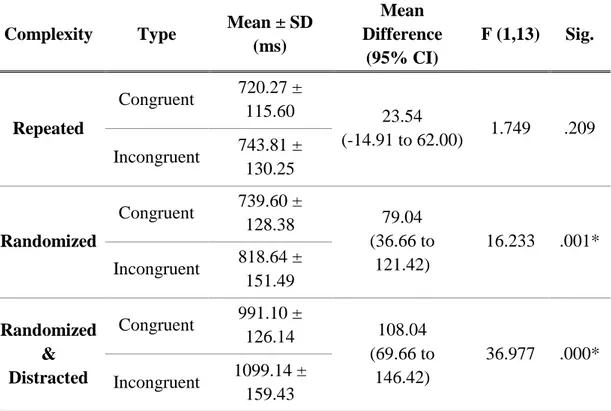
Table 4.1 Summary for simple main effect on the two-way repeated measure ANOVA of distracted Stroop test reaction time. ... 59
Table 4.2 Summary of post-hoc analysis on the one-way repeated measure ANOVA of distracted Stroop test reaction time. ... 61
Table 4.3 Median (Mdn) of ER magnitude for every condition. ... 64
Table 4.4 Summary of Friedman test and its post hoc analysis for every condition (part 1). ... 66
Table 4.5 Summary of Friedman test and its post hoc analysis for every condition (part 2). ... 67
Table 5.1 Descriptions of hardware and software used in the experiment. ... 78
Table 5.2 Overview of subjective and objective measurement. ... 84
Table 5.3 Frequency Band ... 94
Table 5.4 Selected electrode channels by brain region ... 96
Table 5.5 Summary of statistical analysis for driving performance features (part 1). ... 100
Table 5.6 Summary of statistical analysis for driving performance features (part 2). ... 101
Table 5.7 Summary of one-way repeated measures ANOVA test on eye movement features (part 1). ... 103
xiv
Table 5.8 Summary of one-way repeated measures ANOVA test on eye movement
features (part 2). ... 104
Table 5.9 Post-hoc analysis for statistically significant eye movement features by using sample paired t-test. ... 105
Table 5.10 One-way repeated measure ANOVA for ERSP EEG features (part 1). 107 Table 5.11 One-way repeated measure ANOVA for ERSP EEG features (part 2). 108 Table 5.12 Post-hoc analysis for significant interaction of ERSP (part 1). ... 109
Table 5.13 Post-hoc analysis for significant interaction of ERSP (part 2). ... 110
Table 6.1 Frequency Band ... 116
Table 6.2 Evaluation method for feature selection. ... 123
Table 6.3 Illustration of the selected features based on the method. ... 124
Table 6.4 List of the performance measure for the cross validation of the training data. ... 126
Table 6.5 List of performance measure of classification on test data. ... 127
Table 6.6 Summary of coherence value selected by both machine learning method. ... 130
xv
LIST OF FIGURES
Figure 1.1 Research axes... 4
Figure 2.1 Overview of factors inherent to driving distraction ... 9
Figure 2.2 The Visual Pathways ... 10
Figure 2.3 Illustration of types and sources of distraction. ... 15
Figure 2.4 Left: Delta activity recorded from pyramidal neuron of a cat in the somatosensory cortex during deep sleep (adapted from Peyman [95]). Right: Generation of electrical and magnetic fields by synaptic currents in pyramidal cells (adapted from Bear et al. [96]). ... 29
Figure 2.5 The dorsal and lateral view of the human cerebral cortex (adapted from Wilson and Richardson [97]). ... 30
Figure 2.6 The 10-20 system. ... 30
Figure 2.7 Top: EEG signal with epileptic seizure (adapted from Arunkumar et al. [114]). Bottom: EEG signal of different sleep stage (adapted from Khalighi et al. [115]). ... 31
Figure 2.8 List of selected feature extraction methods. ... 32
Figure 2.9 ERP waveform. ... 33
Figure 2.10 EEG signal in time domain filtered by the identified frequency band. Adapted from Abo-Zahhad [129]... 35
Figure 2.11 One of application of coherence. Adapted from Zhavoronkova et al. [135]. ... 36
Figure 2.12Feature Selection technique ... 39
Figure 2.13 Support Vector Machine ... 40
Figure 2.14 Random Forest working principle. ... 40
Figure 3.1 Overview of scientific approach ... 43
Figure 3.2 Improvement made to the classification process. ... 48
Figure 4.1 (a) The illustration of stimuli for the sessions, (b) the experiment paradigm for session (i), (ii) and (iii) and (c) the experiment paradigm for session (iv). ... 53
Figure 4.2 The colour labelling on the keyboard ... 54
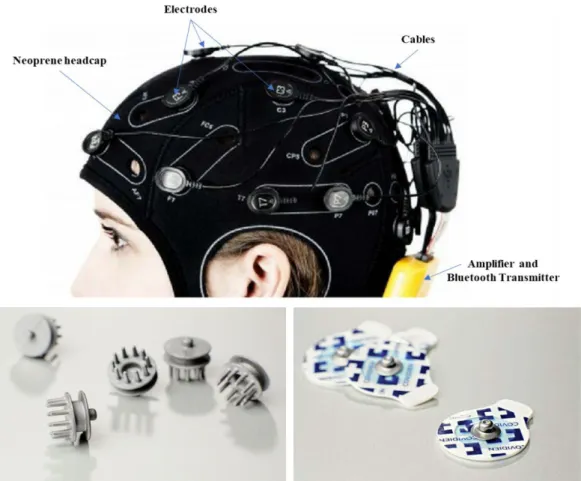
Figure 4.3 Left Image: Subject positioning during experiment, Right Image: Neoprene headcap used during the experiment. ... 55
xvi
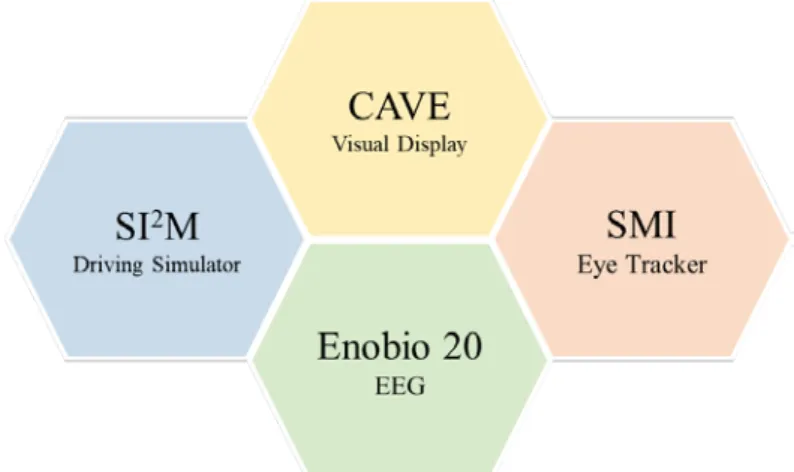
Figure 4.4 Factors for distracted Stroop test statistical analysis. ... 55 Figure 4.5 Illustration of selected spatial region of interest (SROI) based on the electrode position on international 10-20 system. ... 57 Figure 4.6 The grand-average time-frequency representations for each condition at the parietal region. ... 63 Figure 4.7 The bootstrapping statistical analysis at the significance level of p <0.01 (FDR corrected) based on the interaction time-frequency representation at the SROIs. The selected TFROIs are defined in white-edges rectangles ... 63 Figure 4.8 Left: The TFROI of statistically significant ER magnitude due to distraction at frontal (blue) and central (orange) region. Right: Approximate location of SROIs on the brain structure. The statistically significant SROIs are indicated by the red-edge rectangle. ... 65 Figure 5.1 Overview of the function in which hardware and software are involved in the visual cognitive distraction experiment. ... 72 Figure 5.2 Top Image: CAVE System, Bottom Left: Top view of hardware arrangement, Bottom Right: Actual arrangement for the experiment. ... 73 Figure 5.3 Top Image: Enobio 20 EEG wireless system, Bottom Left: Dry electrode, Bottom Right: Sticktrode. ... 74 Figure 5.4 SMI eye tracking glasses used in this experiment. ... 75 Figure 5.5 Left: Modification made to the Infitec glass, Right: Example of the usage. ... 76 Figure 5.6 Diagram of hardware and software used in this experiment and its communications. ... 77 Figure 5.7 Top Image: Top-view of the scenario map designed by using SCANeRTMStudio, Left Image: Example of scenario environment. ... 79
Figure 5.8 Location of screen monitor next to the driving simulator. ... 80 Figure 5.9 Top Left: The stimuli display design outside of display period, Top Right: The stimuli display design during display period, Bottom Image: the placement of two signboards at each intersection that marks “display period”. ... 81 Figure 5.10 Left Image: Math Baseline Test Window, Right Images: Sample for easy level and hard level. ... 82 Figure 5.11 Time allocation for eye close & eyes open procedure. ... 83 Figure 5.12 Image that indicate the end of experiment. ... 83
xvii
Figure 5.13 Definition of road gap ... 85
Figure 5.14 Vehicle trajectory at single subject level for two different participants. 87 Figure 5.15 An example of saccade, changing from position 1 to position 2 on image from eye tracker camera. ... 89
Figure 5.16 Definitions of saccade features ... 89
Figure 5.17 Mapping of pixels of the x-axis and y-axis to one of the eye tracker images. ... 90
Figure 5.18 Left Image: Example of eye tracker image when participant looking to the front, Right Image: Example of eye tracker image when participant looking slightly to the right. (red circlet is a fixation) ... 91
Figure 5.19 Image limit denotes by the red-edge rectangle. Fixation location plots in which the red coloured dot represents the location within the image limit and the blue coloured dot are outside of the image limit. Left Image: Most of the red dots falls within the image limits, a typical distribution for most of the participants. Right Image: Example of fixation location plot in which most of the distributions falls outside of the image limit due to positioning of the eye tracker during experiment. ... 92
Figure 5.20 Illustration of steps taken to compute ERSP features. Data was taken from an epoch of a single subject. ... 95
Figure 5.21 Left Image: Boxplot of mean fixation location on horizontal axis (X-axis), Right Image: Boxplot of mean fixation location on vertical axis (Y-axis). ... 105
Figure 5.22 Visualization of statistical result for ERSP. ... 106
Figure 5.23 Mean total score of SSQ administered before and after the experiment. ... 111
Figure 5.24 Mean time taken to answer the mathematical equations during pre-experiment. ... 112
Figure 5.25 Boxplot of adjusted rating for each dimension in NASA-TLX assessment. ... 112
Figure 6.1 Steps for extracting coherence value from the dataset ... 117
Figure 6.2 Brain region based on the electrodes selected. ... 118
Figure 6.3 Random Forest working principle. ... 120
Figure 6.4 Confusion matrix as reference for the performance measure. ... 121
Figure 6.5 Bar-stacked plot of the selected features sorted by count of selection (due to resolution, only the first 50 features were displayed). ... 125
xviii
Figure 6.6 F1-score of the cross validation of the training data. ... 126 Figure 6.7 F1-score of the classification on test data. ... 127 Figure 6.8 Time taken during cross validation and testing on unseen data for both classifiers. ... 128 Figure 7.1 Conclusion ... 134
xix
LIST OF ABBREVIATIONS
ADAS Advance Driver Assistance System ADC Analog to Digital Converter
AOI Area-Of-Interest
CAVE CAVE Automatic Virtual Environment
CEVMS Commercial Electronics Variable Message Signs
CMS Common Mode Sense
CWT Continuous Wavelet Transform DFT Discrete Fourier Transform
DRL Driven Right Leg
DRT Detection Response Time EEG Electroencephalography
ER Event Related
ERP Event Related Potential
ERSP Event Related Spectral Perturbation FDR False Detection rate
FFT Fast Fourier Transform
GPS Global Positioning System
ICA Independent Component Analysis
LFP Local Field Potential
LLE Largest Lyapunov Exponent
MDN Median
NASA-TLX NASA Task Load Index
NHTSA National Highway Traffic Safety Administration PCA Principle Component Analysis
PDT Peripheral Detection Time
PRC Percent Road Centre
PSD Power Spectral Density
xx
SampEn Sample Entropy
SI2M Simulation Interface Homme Machine & Interaction SROI Spatial Region-Of-Interest
SSQ Simulator Sickness Questionnaire STFT Short time Fourier Transform SVD Singular Value Decomposition SVM Support Vector Machine
SVM-RFE SVM-Recursive Feature Elimination SWLDA Step Wise Linear Discriminant Analysis TFROI Time-Frequency Region-Of-Interest
1
Chapter 1
INTRODUCTION
Driving is a complex activity and distraction is an event that affects driving performance. This chapter presents the research context and its problems. Research questions raised and hypotheses are proposed. The scope of the work is described and finally, the manuscript structure is provided.
1.1 Research Context
Driving distraction is known to be one of the leading factors of accidents [1]. Along with its increasing by alarming rate, the emergence of new technology is inevitable. Namely autonomous car, in-vehicle entertainment system and advanced driver-assistance systems (ADAS), leave more unanswered questions within the safety spectrum. Precisely, how much a driver can be allowed to be distracted (or disengage) while driving and still maintain a safe driving environment? Challenges faced by the researchers in the safety domain are amplified by the complexity of the possible scenarios and at the same time, restricted by the limitation of the state-of-the-art technology, methodology and literature in answering these questions.
Driving distraction is defined as shifting the attention away from safe driving towards a competing task [2]. Naturally, this scenario is treated as a dual task paradigm that defines distraction in terms of excessive workload and limited attentional resources [3-5]. However, this largely ignores how drivers come to engage and disengage in distracting activities [6].
Considering the process of engaging and disengaging on secondary task during driving, drivers perform task switching when attending to secondary task. This remains true if the driver is using the same perceptual modalities (i.e. visual) to engage in the secondary task because task switching focuses on multitasking with sequentially processed component tasks [7]. Ettwing and Bronkhorst [8] have reported that performance deficit in dual task experiment may not only be influenced by resource competition, but also difficulties in disengaging attention from a stimulus can be
2
substantial. If consideration were made that driving distraction is influenced by two paradigms; limited attentional resources and task switching, would it change what have we known so far?
A review [9] on driving distraction detection methods has revealed that a hybrid method is recommended in order to fathom the underlying process that influence distraction. This is because each detection method can compensate the limitation of the other method. For instance, a physical measurement such as eye-movements might be able to detect visual distraction, but not cognitive distraction because variation in cognitive eye movements across drivers is great, especially at low levels of cognitive distraction. This could lead to false negative results in which the features selected might resemble safe driving if they are not defined accurately. However, biological measurements such as electroencephalography (EEG) can recognize cognitive distraction through brain features of synchronization but are not sensitive to visual distraction as this type of distraction mainly involves movement of the eyes towards a specific location.
It was also emphasized that a typical driving distraction is less likely to be represented by a single distraction type (i.e. : visual, cognitive, auditory and physical). Rather a combination of two or more distraction types will depict a more realistic scenario [10]. Despite realizing this fact, very limited literature report on a combined types of distraction and the measurements used in those reports [11, 12]. These are limited to driving performance (lateral control, braking etc) and drivers physical measures (eye movements) only.
In the quest to fill in the research gap in safety research, this thesis aims to uncover the mechanics of detecting visual cognitive distraction by using physiological signals. This is encouraged by the fact that most of driving distraction involves both visual and cognitive modalities [10]. In addition to that, physiological signals namely eye movement and EEG that were suggested to be more successful in distinguishing these types of distraction [9], require an in-depth study incorporating the element of task switching on top of the notion of dual-task paradigm.
3
1.2 Research Problem
There are fundamental problems for each measurement method (EEG and eye tracking) that needed to be addressed and explored before adopting them in detecting visual cognitive distraction. The main challenge in adopting these measurements are listed below:
(a) EEG analysis: relating the relevant features with task switching in a dual task paradigm.
• Most driving distraction research that uses EEG, reported to opt for synchronization at theta, alpha and beta frequency band as detecting features [13-18].
o This is driven by the concept of cognitive load and limited attentional resources; thus, the designed experimental protocol was focusing on cognitive distraction in which the secondary task induced were via auditory capacity.
• However, some oscillatory EEG activities especially delta band activities, have been shown to correlate with perceptual switching [19-24].
o Therefore, a basic study is needed to identify the features related to both limited attentional resources and task switching specifically the process of engaging and disengaging.
(b) Eye movement analysis in a dynamic scenario.
• Driving is a task performed in a constantly changing environment. Most of the state-of-the-art eye movement analysis are designed to work with a static image or by a pre-set location such as area of interest (AOI), scan path representation and dwell/glance or gaze.
o These methods would not be able to characterize the process of engaging and disengaging of a visual cognitive distraction while driving.
4
1.3 Research Question
Considering all the issues discussed, the main research questions to be addressed in this thesis are as follows:
1. Does task switching influence dual task paradigm in visual cognitive driving distraction?
2. Which features should be used to detect visual cognitive driving distraction?
It is hypothesized that task switching is involved in visual cognitive driving distraction as drivers had to share visual capacity between driving and distraction task. This proposition and its effect can be measured and proved empirically.
The second hypothesis is that the fact that task switching is involved, the features commonly used to detect distraction may not be enough to depict the actual situation. In this thesis, we proposed to perform feature selection technique to investigate the relevant features and thereby improves the classification accuracy.
1.4 Research Scope
Due to the complexity of the problems in both measurement methods (EEG and eye movements), investigation and analysis towards answering the research questions in this thesis will be confined to EEG. Other measurements such as driving performance, eye movements, questionnaires, reaction time and etc., will be used as a validation or supporting measures.
The scope of the research revolves within three axes; Detailed, Deploy and Detect.
5
1.5 Research Objective
Based on the research question raised, hypotheses and the research scope, the following research objectives have been formulated:
1. To investigate the effect of different level of visual cognitive distraction on ERSP of EEG features extracted using CWT and FFT in accordance to the task switching within dual task paradigm experiment.
2. To design a classification system that incorporates features selections of ERSP and coherence using SVM-RFE or Random Forest for better classification performance.
1.6 Manuscript Structure
This manuscript is divided into seven chapters. The first chapter provides an overview of the driving distraction research and the problem involved in detection of distraction. It also covers the research questions, research scope and research objectives of this thesis.
The second chapter discusses the fundamental idea embedding the driving distraction research such as attention, task switching, dual task and situation awareness from the neuroscience perspective. The visual cognitive distraction was also defined, and literature of its measurement methods was reviewed and critically compared to reveal the research gap. At the end of the chapter, there is a brief introduction to brain function, their dynamics, how EEG is being used to explore brain activities in a different situation. A review on commonly used EEG feature extraction and machine learning based feature selection method concludes the chapter.
The third chapter is dedicated to justifying the scientific approach for experiments carried out in chapter 4 to chapter 6. It begins with the research question raised and how does it translate to the designed experiment. Justification on adopted methodology for feature extraction, validation method, statistical analysis approach was discussed in this chapter.
The title for chapter four is “Task switching, dual task or both?”. As we are proposing that visual cognitive distraction involves task switching, this chapter describes an experiment, distracted Stroop Test, in order to investigate this theory. By extracting estimated oscillatory power using wavelet transform, the significant
6
frequency was examined by using bootstrapping method. The behavioural and EEG statistical result were discussed and compared at the end of the chapter.
The fifth chapter puts the theory into a driving scenario in an experimental setting. It begins with the description of the experimental setup, followed by the analysis approach of multiple measurement methods. Data acquired was analysed and compared.
The sixth chapter propose and compare, machine learning based feature selection method, to determine the most relevant EEG features for detection of visual cognitive driving distraction. The classification performance of the selected features was computed and discussed.
The final chapter concludes the finding of this thesis, contribution of the thesis work, limitation and future work.
7
Chapter 2
LITERATURE REVIEW
Driving distraction is defined as a shift in attention away from safe driving towards a competing task [2]. By referring to the definition, task switching is more likely to be the executive function involved in this process. However, this activity involves two tasks; driving and competing task, thus, most research studies approach this issue by dual task paradigm.
In this section, a review of the relationships between attentional bottleneck, task-switching paradigm, dual-task paradigm, distraction type & sources and situation awareness are discussed with respect to driving distraction and the inherent factors. After a common understanding on the causes is made, a critical review on measurement methods is summarized. A review on electroencephalography (EEG) were made at the end of this chapter, comprising the brain functions, brain dynamics, feature extraction and the challenges faced by driving distraction research in using EEG.
2.1 Overview
A study conducted by the AAA Foundation for Traffic Safety revealed that young drivers were distracted in 58% of the analysed crashes [25] while the NHTSA reported only 13% to 14% of all drivers were distracted in 2014 [26], 2013[27] and 2012[28]. The disparity between these two reports is the method of analysis. The data analysis used by the AAA Foundation for Traffic Safety was based on six-seconds video clips that were captured just before the crashes occurred. In contrast, the NHTSA focused on crash data that were subjectively reported. The large percentage differences in these reports may indicate that the number of accidents resulting from distraction is probably greater than what we previously thought. However, lack of common measurements makes interpretations and conclusions difficult. Thus, an objective and reliable measurement of distraction is required before proposing any appropriate mitigation action.
8
Among the 40% of intersection-related crashes in the USA that occurred in 2008, recognition error (56.7%), and detection error (29.2%) were reported as the most critical factors that contributed to the crashes [29]. These statistics indicate that human factors such as driver awareness are the main cause for these kinds of accidents. A more recent study of young drivers revealed that passengers are the main reason for driver distraction (40%), followed by cell phones (12%), and unknown people/objects outside the vehicle [25]. Based on this evidence, driver experience level might influence the ability to stay aware.
In addition to these issues related to distraction—which are not yet fully understood—the emergence of autonomous car technology is another factor that will affect driver awareness. According to NHTSA’s Federal Automated Vehicle Policy [30], there are six levels of vehicle automation that have been defined to facilitate discussions between different agencies and stakeholders. The levels range from level 0 (no automation) to 5 (fully automated). Levels 2 to 4 allow drivers to give driving authority to the automated system, and consequently permit drivers to reduce how much attention they give to driving and the road. Thus, in automated driving, the driver is allowed to be distracted as they are encouraged to disengage from driving [6]. Although the guidelines clearly state that human drivers must continue to monitor the driving environment at these levels, questions remain. In particular, how much a driver can be distracted or disengaged and still maintain a safe driving environment remains unclear. Further, we do not know which are the reliable and suitable measurements that can help in investigating and eventually proposing mitigation actions for safety reasons.
Figure 2.1 depicted an overview of factors that are inherent to the understanding of driving distraction. Human and distractor are two main themes that cause driving distraction, while effects are typically characterized by measurements. In this chapter, peregrination was confined to human mechanism, experiences, age, distractors and objective & subjective measurements.
9
Figure 2.1 Overview of factors inherent to driving distraction
2.2 Attention
Attention is the core property of all perceptual and cognitive operations, and its basic characteristic is its limited capacity [31, 32]. Because of this characteristic, people need to select the focus of attention, either towards driving or towards the distraction. The source of distraction/competing task could originate from the external environment [2] as a salient stimulus that captures attention in a bottom-up fashion [31]. The distraction could also originate internally, a phenomenon known as cognitive distraction [2], which utilizes internal attention [32].
The first stage of attentional mechanisms as described by Chun et al.[32] is selection from multiple sources, either internal or external, which are driven by bottom-up or top-down forces, respectively. Once a focus has been set, the captured information is modulated in the second stage. During this stage, the information is interpreted at either fast or slow processing speeds, and a decision is made as to whether it will be remembered, forgotten, or executed. The third stage of the attentional mechanism is the state of vigilance, also known as sustained attention, which represents a consistent focus on the subject of interest.
10
Figure 2.2 The Visual Pathways
The attentional bottleneck caused by the selection stage can be understood well by observing visual attention [31]. Therefore, when we compare this attentional mechanism [32] with the perceptual process described by Goldstein [33], we can see that they fit well together (Fig. 2.2, red circles 1 and 2). This represents the selection stage of the attentional mechanism. The light reflected from the stimulus reaches photoreceptors in the eye and is transduced into an electrical signal that then travels to the occipital region of the brain through the optic tract. Different information embedded in the stimulus then travels to the dorsal (parietal region) and ventral (temporal region) streams where it is perceived and recognized [34]. The brain then decides on the course of action in the frontal region. The processes denoted by red circle 5 in Figure 2.2, represent the modulation stage within the attentional process. As the perceptual process is repeated, the state of vigilance is strengthened.
In spite of the attentional bottleneck, driving distraction is also influenced by strategic workload management that heavily depends on the driver managing interruptions that direct attention toward distractions. This is extensively discussed by
11
Lee [6] as the process of engaging and disengaging during driving. A failure in interruption management occurs when drivers disengage from driving and spend more time attending to the distractor [35], a phenomenon that is a type of task preservation. Factors that influence task preservation are proximity, goal emergence, and goal valence, which are similar in concept to goal activation [36].
These attentional traps are mostly driven by volitional top down attentional control because drivers are willingly shifting attention to the distractor [37]. This is a similar concept to internal attention as described by Chun et al. [32]. Therefore, we can conclude that even though we shift our attention based on the origins of the distractor, consistent disengagement from driving to attend to distractions is mostly driven by internal attention. Internal attention involves cognitive control processes and operates over representations in working memory, long-term memory, task rules, decisions, and responses. Thus, detecting a single type of distraction does not trigger the complete distraction process. However, engaging in and disengaging from the driving distraction during driving does involve cognitive control.
2.2.1 Task Switching Paradigm
Task switching refers to change of task that requires one to switch frequently among small set of simple tasks [38]. This term is used interchangeably with the term ‘multitasking’ that refers to engaging multiple forms of media simultaneously [39]. Research has shown that task switching would affect subject response by comparing reaction time between switch and non-switch trial [40]. The difference of reaction time is called ‘switch cost’ [41].
The current opinion in neurobiology [31] is that focusing on attention arises from the interaction between widespread cortical and subcortical networks that may be regulated via their rhythmic synchronization. Neural signals reflecting the bottom-up control of attention are thought to originate in the parietal cortex. In contrast, network interaction for top-down control of attention seems to originate from the frontal cortex [42]. Given that the definition of distraction relates to the shifting of attention away from safe driving and towards some competing task [2], drivers may be performing task switching (the selection stage of the attentional mechanism) when distracted.
12
Table 2.1 summarizes the findings related to brain activity during task switching. It has been observed that compared with other frequency-band oscillations, task switching involves synchronization of low frequency brain activity [19-24] that occur in the frontal, central, and parietal regions of the brain. We speculate that low frequency oscillations will be synchronized during distracted driving as well. This is because most sources of distraction comprise two or more types of distraction [10]. Table 2.1 Summary of brain activity during task switching.
References Remarks
[19-22]
Some oscillatory EEG activity, especially delta band (around 4 Hz) activity, has been shown to correlate with perceptual switching.
[23]
The fronto-parietal delta-band oscillatory EEG coherence was suggested as an important component for general attention-demanding cognition.
[24]
3–4 Hz spectral EEG power was modulated at fronto-central, parietal, and centro-parietal electrode sites during perceptual switching. (Dorsal Attention Network – DAN)
2.2.2 Dual Task Paradigm
In driving distraction research, dual-task paradigm is commonly used to approach the studies because this situation deals with two different activities. Dual task is a procedure in experimental (neuro)psychology that requires one to perform two tasks simultaneously, by comparing the performance with single-task conditions. This definition stems from the single-channel theory proposed by Welford [43] that suggests interference occurred in dual task paradigm when two task compete for the control of response-selection stage. This is due to the bottleneck that only allows one response process at a time, which is referred to restricted attentional capacity.
However, we must keep in mind that the concept of restricted attentional capacity occurs within the same sensory modalities, not between different sensory modalities [4]. For instance, driving which constantly requires sense of vision, needed to share its capacity with a secondary task that is visually demanding. As discussed in this section, this situation involves task switching process, a consistent engagement and disengagement from both activities. Table 2.2 listed the summary of brain activity related to dual task paradigm.
13
Table 2.2 Summary of brain activity in dual task paradigm
References Task Remarks
[44] cognitive and motor Walking with
interference task.
Alpha and beta significantly modulated in frontal and central region, indicate increase of cognitive workload.
[45] Postural performance and visual working
memory task.
Reduction in amplitude of ERP evoked by the postural perturbation.
[46] Driving and
distracted driving.
Power increases in theta and beta frequency band at frontal region. Suppression of alpha and beta power in motor area.
The following section discusses in detail the type of driving distraction and the sources based on the commonly performed driving distraction.
2.3 Definition of Visual Cognitive Distraction
Studies of driving distraction typically assess the effect of distraction that results from a single type of distraction. As classified by the NHTSA, these types of distraction include visual, cognitive, auditory, and physical/biomechanical distractions [47]. Visual distraction is defined as taking the eyes off the road, cognitive distraction as taking one’s mind off the task of driving [48], auditory distraction as taking one’s ears off of auditory driving cues, and physical distraction as taking one’s hands off the wheel [1]. However, most defined source of secondary task induced by more than one type of distraction especially visual and cognitive. In this section, we discuss the connection of type and sources of distraction as well as defining the term “visual cognitive distraction” which will be used henceforth.
Several other common secondary tasks that drivers tend to perform are also considered to be sources of distraction. A review by Young and colleagues [10] has classified sources of distraction into three categories: (1) technology-based, (2) non-technology based, and (3) external-to-vehicle. Technology based distraction includes the usage of in-vehicle communication systems such as talking on mobile phones
14
(hands free or not), texting, emailing, or searching for an address using the GPS. Using mobile phones requires attention to visual, cognitive, and physical functional processes. Because of its complexity and importance, many researchers are focusing on this issue from different perspectives [49]. Non-technology-based distractions include, but are not limited to, talking to passengers, eating, drinking, smoking, or trying to become unlost, which actually causes more than one type of distraction. For instance, trying to determine where one is looking for important cues (e.g., street signs, landmarks, etc.), they might take their eyes off the road to examine the surrounding area (visual distraction). At the same time, cognitive skills are required to compare this to any remembered information related to the desired location and then plan the next action (cognitive distraction). This increases the load on the main cognitive task: driving.
External-to-vehicle distraction involves visual and cognitive capacity during driving. Looking at events, people, billboards, or car crashes while driving are classified in this category. Attending to salient stimuli such as pedestrians crossing the road is important; however, even this could be a distraction if the driver is not aware of that the car in front of him has put on an emergency brake. Another example that fall into this category comes from a study on distraction caused by commercial electronic variable message signs (CEVMS). The study concludes that these signs attract more and longer glances than regular traffic signs [50]. This attracts visual attention and may use cognitive resources in order to understand the message being displayed.
Thus, the sources of driving distraction are less likely to be best represented by a single distraction type. Rather, a combination of two or more distraction types or phenomena can capture a more realistic situation. Most technology-based tasks commonly require both visual and cognitive effort [51]. This is also the case for the other categories of distraction source; non-technological based and external from vehicle. Therefore, in this thesis visual cognitive distraction is defined as a secondary task that requires both visual and cognitive capacity as illustrated in Figure 2.3.
15
Figure 2.3 Illustration of types and sources of distraction.
2.4 Situation Awareness
The commonly acceptable cause of driving distraction was due to the limited capacity of attention. In a case where there is a commonality on the sensory modality used for both driving and secondary task, i.e. visual, a driver needs to engage in frequent perceptual switching when distracted. This limitation directly affects the driver’s situational awareness. Perceptual switching (i.e., the selection stage of the attentional mechanism) makes it possible for drivers to perceive their surroundings, even though attention itself allows them to focus on something else at the same time [52]. Because environmental stimuli and task state changes constantly, drivers are required to continuously make decisions. Considering this fact, situational awareness can be severely affected when distraction by a competing task leads to the failure to notice important stimuli.
Endsley [53] introduced a model of situational awareness in a dynamic system that can ideally describe the effect of failing to notice an important stimulus because of the limited capacity for attention. According to the model, there are three levels of situational awareness.
16
• The first: “the perception of the elements in the environment within a volume of time and space”,
• The second: “the comprehension of their meaning” and, • The third: “the projection of their status in future.”
Decisions can be made and actions can be performed once each of these levels has been achieved. However, failure to notice an important stimulus at the first level will certainly affect correct comprehension of the current situation and projection into the future, leading to errors in decision-making, and eventually causing an accident.
Although driving can be considered part of procedural memory to an experienced driver, being aware of the current situation is always necessary so that one can adapt to a changing environment. Procedural memory is a type of memory that becomes more efficient as practice of skills continues and actions can be performed automatically with little conscious thought or recall [54]. Studies [55, 56] have shown that experienced drivers observe hazards and demonstrate overt recognition of hazards more frequently than teen drivers. Additionally, a large portion of teen drivers fail to disengage from competing tasks in the presence of hazards. However, this efficiency does not apply to all ages of experienced drivers. Age-related declines in cognition may have detrimental effects on the ability of older adults to complete everyday tasks. Consequently, their situational awareness is lower when compared with that of younger and middle-aged adults [57, 58]. Therefore, we can infer that situational awareness and driving experience are the primary two elements that influence distraction levels when driving.
2.5 Distraction Measurement Methods
There is a limitation to how well we can perform multiple tasks simultaneously [59], without performance on all tasks being degraded [5, 60-64]. Therefore, attending to a competing task while driving is a distraction that degrades one’s driving performance and affects one’s safe driving behaviour. This section discusses five methods for measuring visual and cognitive driving distraction, and how they can contribute towards detecting distractions. The five common measurements of driving distraction are: (a) driving performance measures, (b) physical measures of the driver, (c) biological measures of the driver, (d) subjective reports, and (d) hybrid measures [65].
17 2.5.1 Driving Performance Measures
Measures of driving performance quantitatively measure driving behaviour and are mostly used to investigate the effects of distraction. Common measures of driving performance for this purpose are speed, lateral control, and reaction time.
i. Visual Distraction
a) Speed: Drivers generally slow down when distracted by a visual stimulus [51, 66, 67]. This can be explained as a compensatory mechanism for the perceived risk, which can be lessened through reduced speed. However, findings by Young [68] contradict those from previous research. In her study, increased speed was not only evident in the higher mean speed, but also in the significant number of speed violations made when distracted. She speculated that the inconsistencies were because the noise in the vehicle was very low and drivers tended to monitor the speedometer less than usual.
b) Lateral Control: Generally, visual distraction impairs lateral control because the driver needs to compensate for errors made when taking the eyes off the road, which leads to larger deviations in lane positioning. This has been proven in several studies that reported increased lane-position variability [11, 67]. Steering control is also reported to be less smooth than in normal driving [11]. However, Young [68] has shown otherwise. In her study, the standard deviation of lateral control did not significantly differ between normal and distracted driving. The central placement of the distracted stimuli in the driver’s field of view may have contributed to this contradicting result.
c) Reaction Time: Reaction time is evaluated by several measures: Brake Reaction
Time, Peripheral Detection Time (PDT), and Detection Response Time (DRT). The purpose of this method of assessment is to evaluate the mental load of the driver. We cannot find any reports that relate visual distraction with reaction time.
ii. Cognitive Distraction
a) Speed: Cognitive distraction causes mixed responses on vehicular speed. Studies by Engstrom et al. [51] and Caird et al. [69] reported that cognitive distraction did not have any effect on speed. However, Rakauskas et al. [70] showed a decreased mean
18
speed because of high-level workloads. In contrast, Tornros and Bolling [67] and Recarte and Nunes [71] found that cognitive distraction leads to increased speed because attention is required to maintain a constant speed. They argued that distraction prevents drivers from regularly checking the speedometer, which raises the tendency to increase or decreased speed. Evidently, these responses depend on one’s driving habit [72].
b) Lateral Control: Studies have shown that cognitive distraction has a very small effect and no significant influence on lane deviation [11, 67, 70].
c) Reaction Time: Studies on reaction time during cognitive distraction unanimously report that reaction time increases during distraction [70, 73-75]. Some studies have also shown that miss rates increase [70, 74].
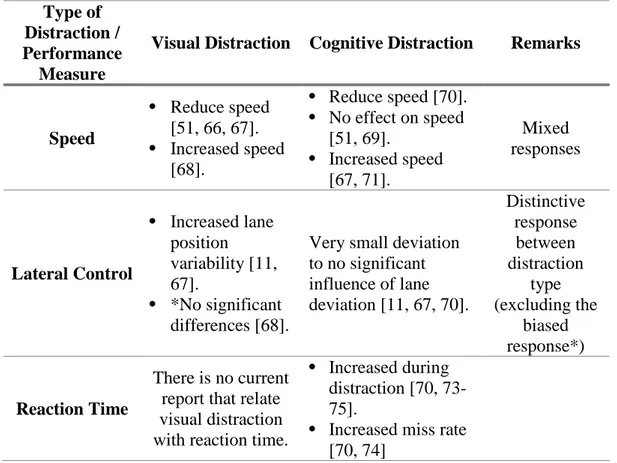
Table 2.3 Summary of the effects that visual and cognitive distraction have on driving performance.
Type of Distraction / Performance
Measure
Visual Distraction Cognitive Distraction Remarks
Speed • Reduce speed [51, 66, 67]. • Increased speed [68]. • Reduce speed [70]. • No effect on speed [51, 69]. • Increased speed [67, 71]. Mixed responses Lateral Control • Increased lane position variability [11, 67]. • *No significant differences [68].
Very small deviation to no significant influence of lane deviation [11, 67, 70]. Distinctive response between distraction type (excluding the biased response*) Reaction Time There is no current report that relate visual distraction with reaction time.
• Increased during distraction [70, 73-75].
• Increased miss rate [70, 74]
Table 2.2 summarizes the effects of visual and cognitive distraction as described above. The advantages of using driving-performance measures to compare the effects of visual and cognitive distraction is that the two distraction types induce different responses except for speed, which shows mixed responses. However, inferential
19
detection is not an effective technique for detecting distraction because other factors such as bad driving habits could affect the responses, and lead to false-positive detection.
A study by Liang and colleague [11] observed that combined visual and cognitive distraction resulted in fewer performance errors than did visual or cognitive distraction alone. For example, visual distraction resulted in the highest lane deviation error, followed by visual cognitive distraction and then cognitive distraction. This result indicates the possibility of false-negative detection for both visual cognitive and cognitive distraction. Thus, measures of driving performance do not detect cognitive or visual cognitive distraction very well, despite being excellent tools for investigating the effect of distractions.
2.5.2 Physical Measures
Physical measures of the driver are also commonly used for distraction detection. Pohl and colleagues [72] have used head-position and head-pose (the main direction of driver’s head) information to model and detect visual distraction. However, they reported that this method has a high potential for false positives. This is because, even if a driver’s head is tilted to the side, his eyes could still be looking on the road. The authors acknowledged the importance of eye movements for detecting distraction, and the need for a higher performance eye-tracking device.
An improvement was adopted by Kircher and colleagues [76] by using the “percent road center (PRC)” of gaze direction, which was analysed over a 1-min epoch. They classified a cognitive distraction as having a PRC larger than 92%, while visual distraction results in a PRC below 58%. Although their method is suitable for offline processing, a 1-min time delay is too long for real-time detection.
Hirayama and colleagues [77] have adopted gaze duration as a detection feature and have reported a correlation between visual distraction and driving performance. This observation is further confirmed by a study [78] reporting that accuracy of detection using eye-movement data alone is almost identical to that using both driving performance and eye-movement data.
20
Based on the latest findings, we can conclude that eye-movement features give a good indication of visual and cognitive distraction. Drivers can be said to be distracted when they exhibit frequent fixation and/or longer fixation durations towards a competing task, commonly known as visual distraction. In contrast, longer fixation duration at the same location (either towards a competing task, in the view of the road or in the peripheral field of view) indicates cognitive distraction. Although distraction detection has been shown to correlate with driving performance, a combined effect of visual cognitive distraction has only been reported once in a similar study using driving performance [11]. The results indicated that fixation frequency and duration during visual cognitive distraction were lower than under visual distraction alone, and higher than under cognitive distraction alone.
However, for driving to be considered safe, an optimal fixation frequency and duration is required for adequate situational awareness. Therefore, visual and cognitive distraction can be discriminated using eye-movement features if and only if the optimal fixation frequency pattern is identified for each driver.
2.5.3 Biological Measures
Biological measures such as heart rate information, skin conductance, and electroencephalogram (EEG) have also been used to detect driving distraction. However, studies testing skin conductance and heart rate information showed only a weak relationship between these measures and distraction. Indeed, no significant relationship was found between skin conductance [51] or heart rate [51, 79] and driver distraction. Although one study [80] has reported a potential correlation, that experiment was designed to determine the relationship between stress and distraction. As we have defined distraction as related to shifting attention (not stress level), further discussion in this section will focus on EEG. Table 2.3 summarizes findings in the literature regarding how EEG functions in detecting driving distraction.
Generally, EEG is used to measure frontal cortex workload [13-17, 81]. For this reason, most distractor stimuli used in the literature are in the form of cognitive distraction such as mathematical equations or auditory tasks. Driving performance measures (lateral control and reaction time) were also used in some studies to validate the EEG findings. The most common pre-processing method was independent
21
component analysis (ICA) and feature-extraction methods were a mixture of spectral features, time-frequency analysis, and event related potential (ERP).
22
Table 2.4 The summary of EEG based distraction detection method.
Reference Pre-Processing Feature Extraction Feature
Classification Distraction Stimuli
Other Measure Used [13] Independent Component Analysis (ICA)
Power spectra at frontal, central, parietal, occipital, left motor, and right motor cortices.
Support Vector Machine (SVM) Mathematical Equation (visual) • Reaction time • Lateral control [14] Nonparametric cluster-based permutation test to detect alpha spindles.
Regularized linear discriminant analysis (LDA)
Auditory task Reaction time
[15] ICA
Time-varying autoregressive (TVAR) analysis using Kalman smoother.
Auditory task
[16] Gratton method Singular Value Decomposition (SVD) Cognitive task (auditory) • Lateral control • Speed [81]
Discrete wavelet-packet transform (DWPT) and FFT to determine the spectral centroid and power spectral density. • Probabilistic Neural Network • 𝐾𝐾-Nearest Neighbor • Fuzzy Subtractive Clustering Media player, GPS, mobile phone and
SMS
Duration of eyes off the road
[17] ICA Event related spectral perturbation (ERSP)
Mathematical
23
Due to the nature of EEG, measuring participant mental state is very useful and can indicate how sensitive EEG is in detecting cognitive distraction. Taking cognitive load as the indicator, theta and alpha power increase [16] and theta and beta power [17] increases were reported in separate studies. EEG was not reported to detect visual distraction. However, we hypothesize that visual cognitive distraction may be detectable if we use perceptual switching as the indicator.
2.5.4 Subjective Performance Measures
Subjective measurement is typically used to obtain participant feedback regarding experience or mental workload when driving. The result of this feedback can then be compared to the driving-performance measures. Researchers have found that participants score highly on driving-performance measures despite giving themselves a low subjective evaluation [71, 82]. Their awareness of the risks of performing secondary tasks might have influenced their willingness to engage in the distracting tasks [82] or otherwise compensated for their driving behaviour. For instance, while there are drivers who tended to reduce the speed of their vehicle while performing secondary tasks [51, 66, 70], other studies have reported increased vehicle speed during distraction due to lack of attention to the speedometer [68, 71]. Combining performance data and subjective measures might succeed in determining the effects of between-subject variability.
Subjective measures also give an overview of the driver’s perspective regarding their strategic control as discussed in Regan et al. [2]. The authors state that the strategic decision to engage in a distracting situation depends on the driving culture and associated social perspective concerning acceptable driving behaviour. Consequently, realizing the potential risk of distraction is not itself sufficient in preventing accidents due to distraction. Educating drivers on their capability, as well as the potential risks associated with it, might impress drivers to behave more responsibly with respect to safe driving.
There are several ways adopted by researchers to obtain subjective measures. The NASA Task Load Index (TLX) [83, 84] is a standard subjective measure of workload which is commonly used in driving distraction studies [68, 73, 82, 85]. It consists of
24
six standard questions on a 10-point Likert-like scale ranging from ‘very good’ (10) to ‘very bad’ (1):
a) How mentally demanding was the driving task? b) How physically demanding was the driving task? c) How hurried or rushed was the pace of the driving task?
d) How hard did you have to work to accomplish your level of driving performance?
e) How insecure, discouraged, irritated, stressed, and annoyed were you during the driving task?
f) How successful were you in accomplishing the driving task during driving?
The Rating Scale of Mental Effort (RSME) is another method used to capture self-reported perceptions of mental workload [67, 70]. Similar to NASA-TLX, the responses can be captured only at the end of the experiment. In contrast, the Driver Verbal Protocol is a method that engages the subject while they are carrying out a task [68, 86, 87]. This way, researchers are able to identify the underlying physiological mechanism related to the event as they collect and analyse verbal data about cognitive processing.
Other studies have obtained subjective report measures tailored to their experiment. For instance, in one experiment [88], authors administered interviews to elicit more details about how the driver would react to and interact with various potential distractions, which were later compared with quantitative performance measures. In general, subjective report measures are typically used to complement the objective measures of driving performance in order to get coherent relationships between experimental measurements and causal factors associated with participant behaviour.
2.5.5 Hybrid Measures
Realizing that each of the methods mentioned above has a drawback with respect to certain types of distraction, researchers have begun fusing the methods to create hybrid measures. Most studies listed here utilized hybrid measures with driving performance and physical measures by fusing the responses using machine-learning methods.
![Figure 2.5 The dorsal and lateral view of the human cerebral cortex (adapted from Wilson and Richardson [97])](https://thumb-eu.123doks.com/thumbv2/123doknet/2626099.58763/51.892.118.706.115.412/figure-dorsal-lateral-cerebral-cortex-adapted-wilson-richardson.webp)
![Figure 2.7 Top: EEG signal with epileptic seizure (adapted from Arunkumar et al. [114])](https://thumb-eu.123doks.com/thumbv2/123doknet/2626099.58763/52.892.174.770.528.1026/figure-eeg-signal-epileptic-seizure-adapted-arunkumar-et.webp)
![Figure 2.10 EEG signal in time domain filtered by the identified frequency band. Adapted from Abo-Zahhad [129]](https://thumb-eu.123doks.com/thumbv2/123doknet/2626099.58763/56.892.175.794.143.573/figure-signal-domain-filtered-identified-frequency-adapted-zahhad.webp)
![Figure 2.11 One of application of coherence. Adapted from Zhavoronkova et al. [135].](https://thumb-eu.123doks.com/thumbv2/123doknet/2626099.58763/57.892.177.617.751.1088/figure-application-coherence-adapted-zhavoronkova-et-al.webp)