Are ethnically diverse communities “bad”
communities? An empirical study on social capital
formation in Northern Vietnam
Abstract
Using data from rural communities in which ethnic heterogeneity was induced within through involuntary resettlements policies in the 1960s, we estimate the exogenous effect of ethnic heterogeneity on individual participation in local organizations and households’ social network capital. The effect on participation depends on organizations’ political nature and the public nature of managed goods. We find no direct impact on social network capital but an indirect effect through interactions with identity and participation. Results do not confirm theoretical predictions of a negative relationship but show that ethnic heterogeneity can encourage bridging connections, and, as such, fosters innovation and economic development.
1 Introduction
1Over the past decade, rural communities have been recognized increasingly more by scholars 2
and practitioners as essential actors in economic development, and have been given greater 3
influence over the design and implementation of development policies and projects. The so-4
called decentralized and community-driven development projects represent, according to 5
Mansuri and Rao (2004), about US$7 billion of the World Bank’s portfolio. In Vietnam as 6
well, after decollectivization in 1988, communities have been entitled to a central role in the 7
implementation of anti-poverty policies, infrastructure development projects, and other 8
reforms such as land allocation. This trend is based on the belief that communities, thanks to 9
better information access and higher enforcement capacities, have a comparative advantage, 10
when it comes to allocating resources and implementing projects equitably and efficiently, 11
over remote national decision-makers. 12
Despite this strong interest, concerns have been raised. Some argue that communities 13
within and across countries are not uniform in their ability to implement projects effectively; 14
they point to the existence of community-level features that can greatly influence the 15
economic performance and the success of the decentralized approaches (see for instance 16
Platteau and Abraham (2002); Conning and Kevane (2002); Khwaja (2009)). Social capital, 17
broadly defined as the “norms and networks that enable people to cooperate” has appeared as a 18
powerful concept in explaining the economic performance of communities, and their ability to 19
implement such projects successfully (Woolcock, 1998; Khwaja, 2009). 20
Since the emergence of the concept in economic literature, and the seminal work of 21
Coleman (1990) and Putnam (1993), the literature has grown exponentially study the 22
economic importance of social interactions. At the micro-economic level, evidence shows that 23
social capital, measured by participation of community members in local organizations or 24
social networks, has a positive impact on income levels (Narayan and Pritchett, 1999; Haddad 25
and Maluccio, 2003; Grootaert and Narayan, 2004), on credit access (Okten and Osili, 2004), 26
and on the adoption of new technologies (Isham, 2002)1. Khwaja (2009) finds the impact of 27
community social features on the success of infrastructure projects in Northern Pakistan to be 28
significant, i.e. projects are more likely to succeed in “good” communities; but also finds that 29
these effects can be altered by project design, and thus good projects can also succeed in “bad” 30
communities. 31
Surprisingly, little research has focused on assessing the determinants of the formation of 32
social capital, i.e. what makes a community “good” or “bad” in terms of participation in 33
collective life, cooperation, or formation of social networks. Alesina and La Ferrara (2000); 34
1
Glaeser et al. (2002) and La Ferrara (2002) studied the determinants of individual participation 35
in local organizations in the U.S. and in Tanzania. A larger set of the literature has examined 36
the determinants of social network formation in rural contexts (Udry and Conley, 2004; 37
De Weerdt, 2004; Goldstein et al., 2005; Fafchamps and Gubert, 2007; Santos and Barrett, 38
2010; Chantarat and Barrett, 2011). Many of these studies have focused on the roles of 39
identity, geography and other socio-economic characteristics in network formation, but none – 40
to the best of our knowledge – have yet looked at community features as factors that either 41
inhibit or enhance the formation of social networks. 42
Ethnicity is often indicated as an important element of social capital formation. Ethnic 43
heterogeneity, in particular, is frequently seen as one factor that inhibits interactions among 44
individuals in a social group because of preference, communication barriers, and social 45
sanction effects (Glaeser, 2001; Bates and Yachovlev, 2002; Alesina and La Ferrara, 2005; 46
Putnam, 2007). The issue, however, has rarely been investigated empirically in micro-47
economic studies. Alesina and La Ferrara (2000) study the effect of heterogeneity on 48
participation in U.S. communities and find it to be negative. Looking at the effect of 49
heterogeneity on collective action in Nepalese forest communities, Varughese and Ostrom 50
(2001) find no apparent relation. La Ferrara (2002) explores the determinants of participation 51
in rural communities of Tanzania and finds that tribal fragmentation does affect participation 52
incentives, albeit in an ambiguous way, depending on the type and entry rule of the social 53
group considered. In many areas, identification and interpretation of ethnic heterogeneity 54
effects is particularly difficult because communities were formed endogenously. Voluntary 55
migration from “bad” to “better” locations (with respect to market links, social conditions, or 56
areas of targeted policy intervention, such as food aid) causes heterogeneous communities to 57
often be better located, or to differ from other communities in further variables of social 58
cohesion. 59
The study takes place in a mountainous district of Northern Vietnam where we know that 60
ethnic heterogeneity was induced in the 1960s at the village level by involuntary, government 61
organized migration. Vietnam is an ethnically diverse country: 54 ethnic groups are officially 62
recognized by the government. The Kinh majority represents 82% of the population, and the 63
remaining 18% is made up of the other 53 ethnic minority groups. These groups vary both in 64
size and in their degree of integration with the Kinh majority. Ethnic minorities live mostly in 65
mountainous areas, in the Northern Uplands where this study takes place, and the Central 66
Highlands regions. On average they are poorer than the Kinh majority, due to greater 67
remoteness, lower endowments in natural- and other types of capital, as well as lower returns 68
on characteristics (van de Walle and Gunewardena, 2000; Baulch et al., 2007; Epprecht et al., 69
2011). The relationship between the state and the ethnic minority groups has evolved 70
dramatically over time and remains, to this day, complex (Michaud, 2009). Resettlement of 71
Kinh households in mountainous areas, and the settlement of swidden cultivator tribes2, was 72
required after independence in order to, among other objectives, integrate ethnic minorities 73
into the country’s political project. 74
Our data was collected in 2007 in a mountainous district of the Northern Uplands where 75
(re)settlement policies have been implemented after independence from France (1954). The 76
area is now occupied both by ethnically homogeneous communities in which migration has 77
seldom taken place, and heterogeneous communities in which involuntary migration organized 78
by the government has altered village composition. We show that the degree of ethnic 79
heterogeneity within communities is strongly affected by these (re)settlement policies, but 80
systematically associated with better locations and endowment, indicating a relatively 81
exogenous process of population mixing. This situation therefore makes for a unique 82
opportunity to empirically study the role of ethnic diversity. 83
2
Swidden cultivator tribes are groups traditionally practising slash-and-burn cultivation with semi-nomadic settlement patterns, such as the H’Mong.
This article seeks to contribute to the empirical literature about the economic effects of 84
ethnic heterogeneity, making use of this distinct setting to analyse ethnic heterogeneity within 85
villages exogenously, and therefore to test for its impact. We explore the effect of 86
heterogeneity on aspects of social capital which have shown to greatly matter in economic 87
development, namely participation in local organizations and households’ social network 88
capital. Furthermore, we also develop what we believe is a novel measure of financial social 89
network capital based on a measure of households’ borrowing capacity (credit limit) from their 90
social networks relative to their income. 91
Results point to an ambiguous effect of ethnic heterogeneity. First its effect on 92
participation appears to depend on the type of organization considered, its political affiliation, 93
the entry rule or whether it manages public or club goods. Second, the results show no direct 94
effect of ethnic heterogeneity on households’ social network capital, but an indirect effect 95
through interactions with other variables. 96
The rest of the paper is organized as follows: we review the literature in Section 2 and 97
present the settings and the data in Section 3. The econometric models are presented in Section 98
4, results are presented and discussed in Section 5 and we conclude in Section 6. 99
2 Ethnic heterogeneity and social capital, a review
1002.1 Defining social capital 101
This section presents the concept of social capital and introduces the theoretical literature that 102
is motivates the empirical work in the later sections. 103
The literature exploring the effect of social capital has grown exponentially since the 104
emergence of the concept in the late 1990s. Despite the success it has had in scientific 105
literature, defining and delimiting this concept 20 years after its emergence, as something 106
tangible and measurable, remains a challenging issue (Dasgupta and Serageldin, 2000; 107
Schuller et al., 2000; Durlauf and Fafchamps, 2004; Hayami, 2009). Putnam (1995, p.664) 108
famously defined social capital as the “features of social life – networks, norms and trust – that 109
enable participants to act together more effectively to pursue shared objectives,” a definition 110
which has influenced much of the research in the last two decades. Earlier works, by Bourdieu 111
(1986) and Coleman (1990), presented individuals as the owners and first beneficiaries of 112
social capital. Bourdieu (1986) defined social capital as “the aggregate of the actual or 113
potential resources which are linked to possession of a durable network” (p.248). Social 114
capital thus encompasses structural (networks, associations) and cognitive dimensions (norms, 115
trust) and is both individual and communal in dimension. Without entering the discussion of 116
whether it is best seen as an individual asset or a community feature, we note that the study of 117
the determinants of social capital requires an individual perspective. The decisions to join a 118
network, to participate in collective organizations or to cooperate in the elaboration of public 119
goods are indeed made individually (Sobel, 2002; Glaeser et al., 2002; Mogues and Carter, 120
2005). The ‘amount’ of social capital available at the individual or community level however, 121
has implications for both individuals and communities due to the existence of important 122
spillover effects, which are difficult to disentangle. 123
Theoretical works and empirical evidence suggest that the level of social capital in a 124
community is at least partly endogenously determined, and that individuals decide whether to 125
join a group and cooperate, based on economic, social or institutional conditions (Woolcock 126
and Narayan, 2000). Glaeser et al. (2002) and Mogues and Carter (2005) have developed 127
economic models of investment in social capital, in which individuals decide to invest based 128
on their objective utility function. Alesina and La Ferrara (2000); Glaeser et al. (2002) and 129
La Ferrara (2002) have explored empirically the determinants of participation in local 130
organizations in Tanzanian and U.S. communities based on similar hypotheses. Community 131
features such as income inequality, ethnic diversity and remoteness are all potentially 132
important factors. The literature on collective action also highlights the institutional 133
framework, in addition to exogenous community characteristics, such as the definition of 134
property rights and the existence of clear cooperation rules, as important determinants of 135
collective action, and thus of cooperation among individuals (Ostrom, 2000). Here, we focus 136
on ethnic heterogeneity as an influential factor of social capital formation. 137
138
Two sets of the literature provide theoretical grounds on which to study the effect of ethnic 139
heterogeneity on social capital in its broader definition. The first relates to a growing segment 140
of literature studying the effect of ethnic heterogeneity on public good formation (social 141
capital being considered as a public good), and the second refers to the literature linking 142
identity to social network formation. 143
2.2 Ethnic heterogeneity and public goods 144
The literature on ethnic heterogeneity and public good formation usually concludes in a 145
negative relationship (Alesina et al., 1999; Costa and Kahn, 2003; Miguel and Gugerty, 2005; 146
Alesina and La Ferrara, 2005; Habyarimana et al., 2007). The explanations provided, however, 147
have diverged. Some have referred to the lack of social sanction mechanisms available in 148
ethnically and culturally diverse societies. The existence of sanction mechanisms is expected 149
to enhance cooperation among individuals by enhancing one’s anticipation of others’ 150
behaviours, and securing cooperative choices. This mechanism is invoked by Miguel and 151
Gugerty (2005) to explain the lower level of public spending on schools in rural Kenya in 152
ethnically diverse communities. 153
Others have referred to preference-based mechanisms which can be divided into two 154
subsets (Alesina et al., 1999; Habyarimana et al., 2007). First, people of different cultural and 155
ethnic backgrounds are expected to have different preferences, and the weak ‘commonality of 156
tastes’– and thus of interests in public goods – in ethnically diverse communities impedes 157
agreements on the elaboration of public goods. Second, individuals may have preferences not 158
only on the nature of public goods, but also bout interacting with people of different cultural 159
backgrounds. The latter was proposed by Alesina and La Ferrara (2000) to interpret their 160
results of the negative impact of heterogeneity on participation in local associations in U.S. 161
communities. 162
Finally a third mechanism, that Habyarimana et al. (2007) refer to as a ‘technical 163
mechanism,’ relates to cultural material that homogeneous communities can rely on when 164
designing public goods and that enables them to cooperate more effectively. This material 165
includes language, the ability to understand anticipate each other’s behaviour, and the 166
existence of rules facilitating cooperation. Other studies suggest, however, that the relationship 167
may not always operate in the above-mentioned direction, i.e. that more homogeneity is 168
conducive to more effective cooperation. Alesina and La Ferrara (2005) refer for instance to a 169
set of the literature showing that heterogeneous groups, by bringing together people with 170
different skills and backgrounds, may be better equipped to solve problems in an innovative 171
manner. This third mechanism, however, refers to the ‘impact’ of social capital (i.e. to the 172
outcome of cooperation) rather than to its determinants, although community members may 173
choose (not) to participate in collective actions based on their anticipation of the high (low) 174
returns of their interactions with others. 175
Based on these theoretical considerations, ethnic heterogeneity is mostly expected to lower 176
levels of social capital, i.e. of cooperation among individuals. Empirical evidence, as pointed 177
out in the introduction, remains relatively scarce and seems to vary from one cultural-178
geographic context to another. 179
2.3 Identity and social network formation 180
A second portion of the literature that sheds light on the role of ethnic heterogeneity on social 181
capital looks at the role of identity in the formation of social networks. The economic 182
importance of identity, in its broad definition, is explored by Akerlof and Kranton (2000)3. 183
The literature on endogenous social network formation also highlights the importance of 184
identity. Fafchamps and Gubert (2007) explore the formation of risk sharing networks in the 185
Philippines and find that geographic proximity, which may be related to kinship, is the main 186
factor of association, while economic factors do not appear to be significant. Goldstein et al. 187
(2005) study factors of inclusion in mutual insurance networks in Ghana by looking at the 188
probability of which one obtains help within and outside his household when a shock occurs. 189
They find that membership in the village’s main lineage, and participation in secular 190
organizations are the two main factors that increase the probability of receiving help outside of 191
the household. Santos and Barrett (2010) investigate the formation of information networks in 192
Ghana to assess the relative importance of identity and material interest (measured by 193
differentials in productivity). They conclude that both identity and interest matter in 194
information networks. The role of identity in network formation appears, therefore, to depend 195
heavily on the type of goods exchanged through networks, whether information, credit or 196
insurance. Ethnic heterogeneity, due to a higher dispersion of identities and kinship within 197
groups, is likely to hamper social networks formation. 198
Akerlof and Kranton (2000) defined identity as “a person’s sense of self,” suggesting that 199
elements that form one’s identity vary between social environments and from one person to 200
another, and thus that identity is a relative and rather subjective concept. Following this 201
approach, identity is defined not only by a person’s type (whether male or female, from a 202
certain ethnic group or born in a particular place) but also by the identity of the other group 203
members, and her differences from others in the same group. The subjective identity of an 204
individual living in a community of her own ethnicity differs from what her subjective identity 205
3
Unlike these authors, our approach of identity does not encompass any economic dimensions, like income. Since the focus of this work is on ethnicity, we concentrate on exogenous and immutable aspects of identity, such as sex, ethnicity, family name, place of birth, etc.
would be if she lived in a community of a different ethnic group, and differs again from what 206
it would be if the community were very mixed or international. 207
This subjective identity is likely to affect both her willingness and capacity to connect with 208
others. Chantarat and Barrett (2011) develop a conceptual framework on social network 209
formation showing how individuals decide to connect with others based on the cost of 210
establishing a relationship. This cost is a function of the social distance, thus the difference in 211
identity between two individuals. One can consider in this framework that heterogeneity 212
affects these costs of establishing relationships. Two individuals that have fairly different 213
identities may feel distant in a homogeneous environment, but this subjective distance may 214
shrink in a more heterogeneous community. 215
216
To sum up this literature review, the causal effect of ethnic heterogeneity on social capital 217
formation is likely to be important. In a collective view of social capital, theoretical evidence 218
points to a negative effect on both cooperation and on the level of participation in collective 219
action. Empirical evidence, however, has not always confirmed this relationship, and some 220
research suggests that the institutional framework matters more. With the more individual 221
perspective of social capital, or social network capital view, heterogeneity has an ambiguous 222
impact. On the one hand, identity is shown as an important element of social network 223
formation – because individuals that have close identities are more likely to connect – and thus 224
the dispersion of identities induced by ethnic heterogeneity is likely to impede social network 225
formation. Ethnic heterogeneity on the other hand, by affecting the definition of subjective 226
identities, as perceived by individuals themselves or by their neighbours, is likely to have an 227
indirect and ambiguous effect on social network formation. 228
3 The data
2293.1 The settings 230
Vietnam is an ethnically diverse country. According to the official classification, the Kinh 231
majority (82% of the country’s population) shares the nation with 53 other ethnic groups, so-232
called ethnic minorities. The empirical study takes place in the Northern Uplands, one of the 233
most ethnically diverse regions of Vietnam. The area nowadays is home to 31 ethnic groups, 234
and observed levels of diversity are high even within communes, because of the complex 235
settlement patterns of populations over time in the region (Michaud et al., 2002). After 236
independence from France in 1954, the regime made it a priority to unify the people, and to 237
integrate ethnic minorities into the nation’s political project, as well as to foster development 238
of upland areas and ensure food security in the lowlands. The resettlement of lowland villages 239
into the uplands, and the settlement of swidden cultivator communities, was undertaken in this 240
perspective, and often accompanied by acculturation programs (Hardy, 2000; Pelley, 2002; 241
McElwee, 2004; Baulch et al., 2007; Friederichsen and Neef, 2010). 242
Our study area is Yen Chau, a rural district located along the national road N6, which links 243
Hanoi with the provinces of Son La and Dien Bien Phu. Three ethnic groups inhabit the area: 244
the Thai which account for 55% of the district’s population, the H’mong (20%), and the Kinh 245
(13%). Other ethnic groups (the Sinh Mun and Kho Mu) are also present but represent only a 246
small fraction of our sample (<1%). The Thai were the first settlers and have occupied the 247
lowlands mainly, while the H’mong have settled primarily in the uplands (Neef et al., 2003). 248
(Re)settlement of villages in the study area began in the early 1960s, a few years after the 249
country gained independence from France. In some cases, entire villages were resettled by the 250
government, as is true for eight villages in our sample. Additionally, Kinh households were 251
moved from the Red River Delta to Yen Chau and resettled into existing villages. Host 252
villages were selected based on land quality and availability. Newly settled households 253
received compensation in the form of land, housing assistance or monetary support. Host 254
villagers in most cases were not compensated. Seven out of our 20 sample villages were asked 255
to host new comers between 1960 and 1982. The number of households resettled varied 256
between 10 and 100 households, which in some cases doubled the initial village population. 257
Ethnic groups present in the area have different customs, social organizations, languages, 258
clothing and eating habits. The Thai, for instance, are traditionally organized into hierarchical 259
social structures with matrilineal lineage (Mellac, 2006), while in the H’mong case, social 260
structure is more horizontal with patrilineal lineage system (Corlin, 2004). Customs regarding, 261
for example, the establishment of newly married households, the inheritance of land, or land 262
allocation among community members differs between the three groups. Traditional practices 263
however have been strongly attenuated by several decades of integration policies, resettlement 264
interventions and land reform (McElwee, 2004; Friederichsen and Neef, 2010). 265
Villages, although not officially recognized as an administrative unit, are the places where 266
major decisions affecting households’ livelihood are made. The allocation of untitled land, the 267
granting of formal credit, the definition of households’ poverty status entitling them to 268
participate in specific assistance programs, and access to irrigation are, among many others, 269
important decisions that are made at the village level. The literature further emphasizes the 270
strength of social relations within villages, and the political challenges that they constitute for 271
the state. An old saying in Vietnam stipulates that the “King’s law gives way to the village 272
custom” (Phép vua thua làng in Vietnamese). A recent example is provided by Kerkvliet 273
(2005) the author shows how villagers in the lowlands opposed the state administration during 274
decollectivization through “everyday politics,” and how these contestations and local 275
adjustments led to redefinitions of the national policy. In the uplands, the implementation of 276
the 1993 land law in particular, aimed at individualizing land access, has resulted in tensions 277
and opposition from upland communities (Bryant, 1998; Sikor, 2004)4. 278
3.2 The survey 279
The data were collected in 2007 and 2008 in Yen Chau district. A representative sample of 280
300 households was selected following a two-stage cluster sampling procedure. A village-281
level sampling frame was constructed encompassing all villages of the district5, including 282
information on the number of resident households. First, 20 villages were randomly selected 283
using the Probability Proportionate to Size (PPS) method. Next, 15 households were randomly 284
selected in each of the selected villages using updated village-level household lists. Since the 285
PPS method accounts for differences in the number of resident households between villages in 286
the first stage, this sampling procedure results in a self-weighing sample. 287
The survey covered a wide range of topics and included a detailed module on social 288
capital, as well as on households’ credit experience and access to different sources. The social 289
capital module gathered detailed information on individual participation in organizations, on 290
levels of trust, reliance on networks in case of shocks, etc. Additionally, a census of all 291
residents was conducted in each of the 20 sample villages, by which we obtained information 292
on the ethnicity and family names of all residents6. The settlement history of each village was 293
retraced through focus group discussions with the village elders and structured interviews with 294
knowledgeable villagers. 295
4
Sikor (2004); Mellac (2006) provide specific examples in Thai communities, and Corlin (2004) discusses this issue in the H’mong context.
5
The urban centre and four communes located along the border with Laos for which research permits were difficult to obtain at the time of interview were excluded from the sampling frame.
6
The literature suggests that clanship used to be important within the Thai and H’Mong ethnic societies (Mellac, 2006; Corlin, 2004), but that through efforts of acculturation and integration and the successive land reforms, the importance of clans nowadays is limited. Family names are the closest indicators of clanship that we can use. However, we must note that two individuals carrying the same family name do not necessarily belong to the same clan, but the probability that they do is higher. We recorded 31 different family names for a total of 2,296 households within 20 villages.
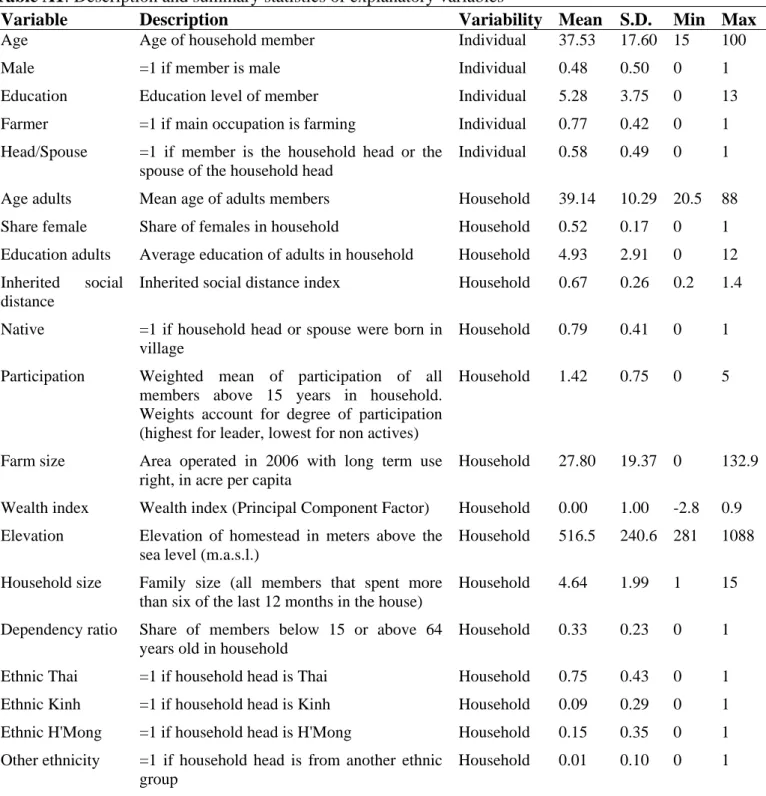
3.3 Descriptive statistics 296
Table 1 presents some descriptive statistics of village and household characteristics in 297
homogeneous and heterogeneous villages. Ethnic and name fragmentation are measured with a 298
Herfindahl-Hirschman fragmentation index: 299
FRAG 1 π (1)
300
is the share of households belonging to a group i in village v; T is the total number of 301
groups in the village, defined by ethnicity or family names. The index FRAGv can be 302
interpreted as the probability that two individuals taken randomly in the village belong to 303
different ethnic groups, or carry different family names. Of the 20 sample villages, nine are 304
completely homogeneous, and 11 are ethnically mixed. The degree of heterogeneity within 305
those mixed villages varies widely, and the ethnic fragmentation ranges from 0.01 to 0.5 in 306
these villages. The observed fragmentation score for names varies from 0.27 to 0.82 in the 307
most diverse villages. 308
[Insert Table 1 about here] 309
The strong correlation between the degree of heterogeneity and the occurrence of resettlement 310
in the village, as well as the number of households that have been resettled indicates that these 311
resettlements constitute the major source of observed heterogeneity within villages. We find 312
no association between heterogeneity and geographic factors such as elevation or distance to 313
markets, to the city centre or to paved roads. Nor do we find any significant association 314
between heterogeneity and income or land inequality (measured with coefficients of 315
variation). Kinh households are present only in heterogeneous villages, while the presence of 316
Thai and H’Mong does not vary between village types. 317
Looking now at the second part of the table displaying household characteristics, we find 318
significant associations between heterogeneity and the level of household per capita 319
expenditure, but no apparent association with households’ income diversification. The size of 320
individual farms is also larger and positively correlated with heterogeneity. This corroborates 321
interview findings indicating that households were resettled in villages where land was 322
available. When asked about other selection criteria, none of the villages in which households 323
were resettled could respond, and the lack of correlation with other village characteristics 324
shown above also confirms this finding. 325
We find significant associations between heterogeneity and migration. A large share of 326
household heads was born outside the province and migrated to the village at some point, as is 327
also true for the older generations. 328
Finally, participation in local organizations does not differ on average between villages. 329
We find, however, that homogeneous villagers participate more in mass organizations while 330
heterogeneous villagers participate more in civic organizations. 331
Mass organizations (or unions) are associations created by the state at the time of 332
independence as a way to convey and apply at the local level the principles and policies of the 333
communist governance. They are present at each administrative level, from the state to the 334
village. At the local level, each of the six unions (cf. Footnote in table 1) carries out different 335
tasks and objectives. All play an important role in a village’s everyday life as village union 336
leaders sit on the village board and participate in village level decision making. The women’s, 337
farmer’s, veteran’s and youth unions act as credit agents for the state microfinance bank (the 338
Vietnam Bank for Social Policies), and organize the allocation of Bank’s loans among 339
villagers. The farmer union in some villages is responsible for contract arrangements between 340
villagers and input and output traders and for organizing agricultural extension and therefore 341
plays an important role in farming decisions. Having one member taking part in these unions 342
is therefore important for accessing public resources and information. In some villages, 343
participation is even compulsory, and individuals are de facto considered members of their 344
corresponding union (i.e. Women’s union for women, Farmer’s union for farmers, etc.). This 345
explains, together with the high interests these unions represent, the high observed rates of 346
participation in these organizations. 347
Civic associations also manage public resources encompassing school committees, health 348
committees, and security groups. However, entrance into these associations is not compulsory, 349
but results more of a free choice. 350
We also notice the low participation rates in the communist party in both village types. 351
Whereas in urban and lowland areas, participation in the communist party may provide some 352
advantages, the role of the party in rural areas is more limited, even though the village 353
communist party secretary also sits in the village board. 354
Finally, we report, in the last line of Table 1, the measure of household informal (from 355
friends and relatives) credit limit per unit of income, which we use later on as an indicator of 356
households’ social network capital (see Section 4.2). This measure of credit access draws on 357
the credit limit approach developed by Diagne et al. (2000). The credit limit is a measure of 358
the maximum amount a household could borrow at the time of survey from a certain lender 359
given its current debt to the lender. We focus here on households’ credit limits from their 360
friends and relatives. As explained by Diagne et al. (2000), it is reasonable to expect farmers 361
to have accurate expectations towards their borrowing capacity thanks to their extensive 362
experience in borrowing from different sources due to the seasonality of income earnings. In 363
the study area we find that a household on average contracts six loans per year, of varying 364
amounts and from different sources. About two thirds of these loans are for small amounts 365
(below 200 thousand VND 12.5 US$ in 2007), and obtained from informal sources. 366
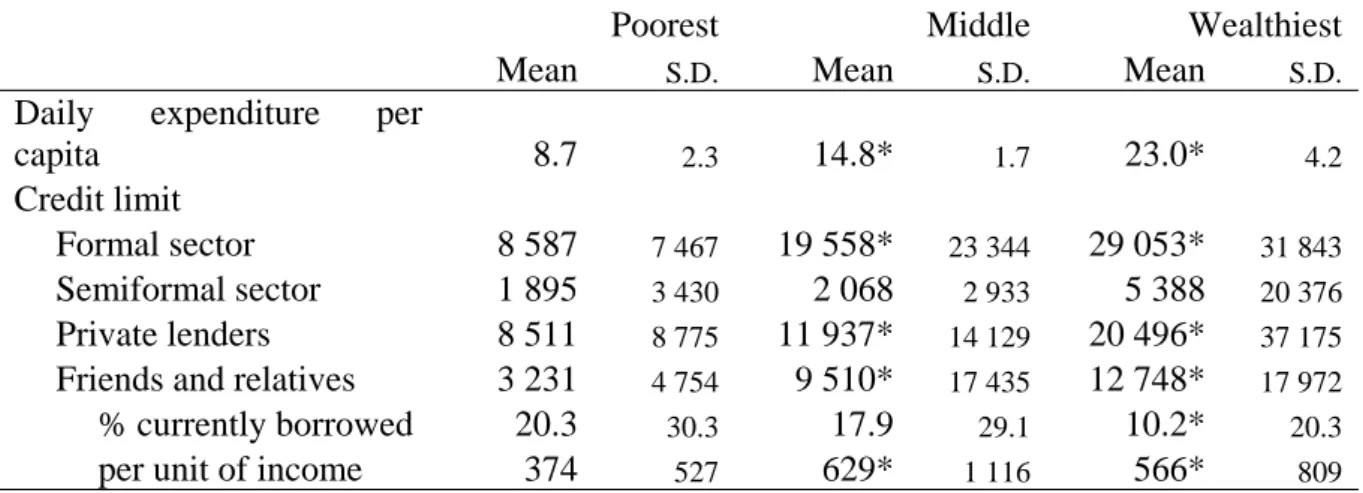
Table 2 reports descriptive statistics on households’ credit limits from different sources by 367
terciles of income (proxied by the level of per capital daily expenditure). We find for both the 368
formal and the informal sector that the richest 33% of respondents have a credit limit three 369
times greater than that of the poorest third of respondents. This gap is further accentuated for 370
credit from friends and relatives. On average, the richest third can borrow four times more 371
from their social network than the poorest third, indicating the importance of reciprocity in 372
social relationships related to financial issues. The amount one is able to borrow from others 373
depends on how much one is able to lend. We report statistics denoting the share of this credit 374
limit that was being borrowed at the time of the interview. Poor households use a larger share 375
of their credit limit than their richer counterparts, which confirms that this source is 376
particularly important for the poor. 377
The last line in Table 1 show a positive association between this measure of social network 378
capital, and the degree of heterogeneity in the village. 379
[Insert Table 2 about here] 380
4 Empirical strategy
3814.1 The participation model 382
The model of participation we estimate follows closely those of Alesina and La Ferrara (2000) 383
and La Ferrara (2002). It considers that an individual decides to participate in an organization 384
if he derives a positive net utility. The net utility he gains from participating in one type of 385
organization is expected to depend on his own characteristics, the characteristics and identity 386
of the household to which he belongs, and his village’s attributes: 387
(2) 388
where is the expected utility of an individual belonging to household j in village i, when 389
participating in association v; is a vector of individual characteristics ; is a vector of 390
household characteristics ; denotes the identity of the household ; are village attributes ; 391
, , and are parameters to be estimated and is the error term. Letting denote 392
the observed participation of the individual i in association k, we expect that the individual 393
decides to take part in the association k if his or her net utility is positive: 394
1 0 395
0 0 (
3)
396
Explanatory variables included in the participation model are described in the Appendix, 397
Table A1. Individual-level variables account for age, gender, education, and occupation. We 398
include a variable indicating whether the member speaks more than one language, as this helps 399
to reduce social distance between two individuals of different ethnic groups. 400
The included household-level variables account for the effect of households’ demography, 401
wealth level and identity. Demography is expected to ambiguously affect an individual’s 402
decision to participate, depending on the labour constraint faced by the household and the 403
nature of benefits gained through membership. Variables account for household size and the 404
presence of dependants, which affect labour allocation within the household and determine the 405
time available for participation. One would expect members of larger households to participate 406
less in associations for which benefits linked to membership are less than proportional to the 407
number of members. On the other hand, when the labour constraint is binding, the effect of 408
household size becomes positive. 409
We control for households’ wealth-level by using a composite index of 14 variables 410
expressing different dimensions of long-term wealth (see the principal component factors of 411
the wealth index in the Appendix, Table A2). We prefer this index of long-term wealth to a 412
measure of per capita expenditure which was measured at the same time as participation, and 413
is more volatile, and probably endogenous. 414
Finally, we include variables denoting the households’ identity. The variables take into 415
account three dimensions of identity: ethnicity, household name and the places of birth of the 416
household head and spouse. The first two dimensions are captured through ethnic dummy 417
variables and an index of inherited social distance (ISD) between the household and its 418
neighbours according to ethnicity and family name. We finally include a dummy variable 419
indicating whether the household spouse or head are native to the village7. 420
The ISD variable captures the relative aspect of one’s identity (see Section 2.3), i.e. the 421
difference of the household from its neighbours along variables denoting immutable identity 422
features. A commonly used approach to calculate such an index is the Euclidean distance. 423
Here, as we measure the distance between a household and all other villagers, we could write : 424
∑
(4)
425
where is an index of inherited social distance of household j in village v; k=[1,2] refers 426
to the type of characteristics, i.e. ethnicity and name; xk,jv is the observed characteristic k of 427
household j in village v; and is the average of in village v. Because ethnicity and 428
lineage are discrete variables, we convert them into dummy variables and rewrite the inherited 429
social distance index as such: 430
∑ 1
(5)
431
where is now the share of villagers sharing the same characteristics k as the household j. 432
thus increases with the number of villagers being dissimilar to household j. 433
Finally, we include village-level control variables that capture geographic characteristics 434
and village composition, among which is the index of ethnic heterogeneity described in 435
Section 3.3. 436
We run separate individual-level regressions to estimate the determinants of participation 437
in each organization type as a function of the individual, household and village characteristics 438
described above and using probit estimates, with sandwich estimators of the standard error. 439
7
We have seen earlier that among the three ethnic groups present in the area, two have patrilineal traditions while the Thai follow matrilineal structures, and traditions regarding the establishment of newly married couples also differ between these groups. We thus account for the place of birth of both the spouse and the head.
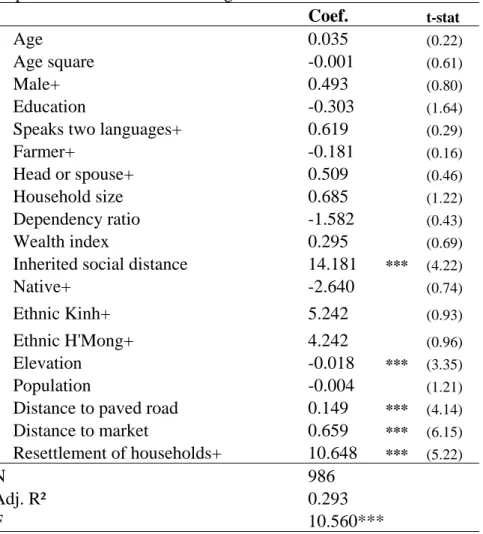
We test for the endogeneity of the ethnic fragmentation variable using an instrumental variable 440
approach. The instrument used is a dummy variable indicating whether resettlement policy 441
took place in the village after the independence. Results are displayed in Table 3 and discussed 442
in Section 5.1. 443
4.2 The social network capital model 444
We now turn to the second model that we build to estimate determinants of households’ social 445
network capital. We focus here only on the financial dimension of social network capital, 446
through a measure based on households’ access to credit from their friends and relatives (see 447
section 3.3). It takes into account one aspect of individual social networks that matters greatly 448
in rural development. Social networks represent an important source of credit, particularly in 449
areas where the credit market is missing or fails to provide loan to all households at market 450
price. Extended family and intra-community networks, thanks to better information access and 451
to better monitoring and enforcement capacities, are able lend to their networks at low interest 452
rate, making this source particularly attractive, especially for poor households. Because of the 453
covariant nature of credit demand and shocks in rural areas, this source of credit cannot fully 454
respond to households’ demand for capital, but strongly enhances farmers’ risk bearing and 455
consumption smoothing capacities (Zeller and Sharma, 2000). 456
The dependent variable is the household’s credit limit from friends and relatives per 457
unit of income described in section 3.3. It measures how much one is able to borrow from his 458
friends and relatives per unit of income. We argue that this variable is a good measure of 459
household social network capital. First, it relates directly to Bourdieu’s definition of social 460
capital (see Section 2.1). Second, it is strongly correlated with three important dimensions of a 461
social network: its size; the intensity of the ties linking the household with network’s 462
members, in particular their level of trust of the household8; and finally the wealth level of 463
members in this network, and their lending capacity. 464
Based on the literature on social network formation (Granovetter, 1973; Dasgupta, 2003; 465
De Weerdt, 2004; Fafchamps and Gubert, 2007; Santos and Barrett, 2010; Chantarat and 466
Barrett, 2011), we develop an econometric model to estimate the determinants of households’ 467
financial social network capital. The model can be seen as a model of investment in social 468
network, where a household’s stock is a function of innate and immutable characteristics such 469
as identity, and of social decisions. We use a log-linear specification to estimate parameters of 470
the following equation9: 471
ln (6)
472
where are household demographic variables, indicate a household’s level of human 473
capital, indicate the participation of household members in associations, denotes the 474
identity of the household; are village attributes. 475
Table A1 in the Appendix describes and summarizes variables included as explanatory 476
variables in the model. In addition to variables controlling the age and education level of 477
adults, and the gender of all members, we include a variable measuring farmers’ wealth level, 478
using the same asset-based index as in the previous model which may be perceived by others 479
as a measure of households’ creditworthiness. 480
As in the previous model, we account for three dimensions of identity: ethnicity, inherited 481
social distance and birth place of the head and the spouse. The variable for participation takes 482
into account participation in all types of organizations. 483
8
Most loans from friends and relatives were borrowed in 2007 at no interest rate (70%), and on average, the interest rate was significantly lower than from all other lenders, for equivalent amounts and maturation.
9
A non-negligible share of households (6%) declared having no access to credit from their friends and relatives, and a log-transformation of the dependent variable leads to the eviction of these observations. We replace the dependent variable as ‘0’ for these observations. Our results are robust to different treatments of these values, and the log-linear model performs better than the linear one.
We estimate household-level OLS regression on households’ social network capital, using 484
village-level controls (described in Table 1) in a first stage and village dummy variables in a 485
second stage. As in the previous model, we test for endogeneity of the ethnic fragmentation 486
variable using the resettlement policy as the instrument. We test for hypotheses discussed in 487
section 2.3, relative to the effect of ethnic heterogeneity on subjective identity and social 488
decisions by interacting ethnic heterogeneity variable with identity and participation variables 489
Results are presented in Table 4 and discussed in Section 5.2. 490
5 Results
4915.1 The determinants of participation 492
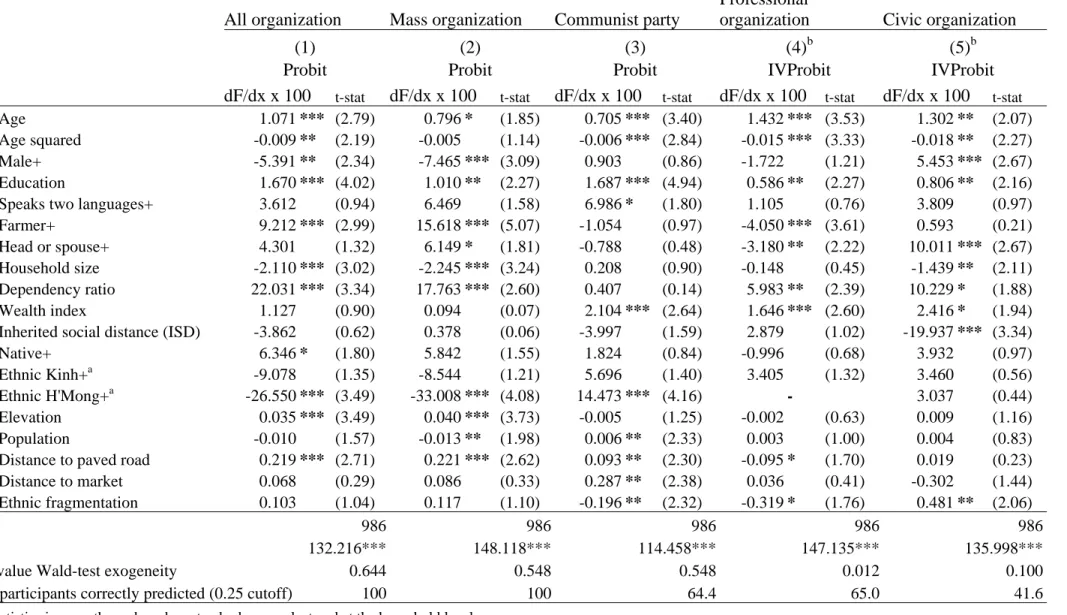
Probit estimates of the participation model are reported in Table 3. The first column presents 493
the model that predicts participation in any association, and the following columns present 494
estimates of models predicting participation in different types of organizations, namely mass 495
organizations, the communist party, professional, and civic organizations. 496
We test for the endogeneity of ethnic fragmentation using an instrumental variable 497
approach. The instrumental equation is presented in Table A3 of the Appendix, and shows that 498
the occurrence of involuntary resettlements in the village, the instrument, strongly influences 499
the village ethnic composition and the observed degree of heterogeneity. The results of Wald-500
tests of exogeneity are presented at the end of Table 3, for each equation. The tests lead us to 501
reject endogeneity in the first three models (any organization, mass organization and 502
communist party), but not in the last two models that predict participation in professional and 503
civic organizations. We report in the first three columns results from the simple probit 504
estimates, while in the last two columns, the IV probit estimates are reported (i.e. after 505
instrumentation)10. 506
10
Due to space constraints we do not present estimation results before instrumentation for these two models. These are available upon request to the authors.
[Insert Table 3 about here] 507
Individual characteristics such as age and gender significantly explain participation. The 508
probability of participation increases with an individual’s age, but starts to decrease once the 509
person reaches 64.5 years. Women are significantly more likely to take part in any 510
organization. Individuals with a higher level of education are also more likely to participate, as 511
are those whose main occupation is farming. 512
Households with many members and those with a high dependency ratio are less likely to 513
participate, indicating that labour allocation within the household does plays a role. These 514
results however, do not point to a binding labour constraint but shows that the benefits from 515
participation are generated at the household level rather than at the individual level, and thus 516
the marginal net utility from having one more member participating in the organization is 517
negative. The availability of dependants, like elderly members in the household, may give 518
adult members more time to invest in these organizations. In this general model, we do not 519
find that households’ wealth level is an explaining factor, which rejects the hypothesis of a 520
budget constraint. Household members whose head or spouse are native to the village have a 521
higher probability of participating, and members of H’Mong households, everything else being 522
equal, are less likely to take part in any organizations. Other identity indexes are found to be 523
insignificant. 524
Finally, ethnic fragmentation is found to have no direct impact on participation. Household 525
members living in more remote locations (higher elevation or further from a paved road) are 526
more likely to participate. This may indicate that access to services (extension or credit) in the 527
more remote villages is likely to be facilitated through participation in organizations. It may 528
also indicate higher social pressure for villages to participate. 529
Estimates of the first model, as can be seen from the following column are heavily 530
influenced by mass organizations which constitute an important share of households’ total 531
participation. Entrance into these organizations is not always a free choice, and indeed 532
determinants of participation in other organizations differ significantly. 533
In the communist party model, we find that education and the ability to speak at least two 534
languages are significant and positively influencing factors. Household demographic variables 535
do not appear as significant factors, but the wealth level, as measured by the asset-based index, 536
does influence participation positively. The H’Mong, all else being equal, participate more 537
than other ethnic groups. This ethnic group is culturally and politically more marginalized than 538
other ethnic groups in the area, and Vietnam in general (Corlin, 2004). Taking part in the 539
communist party might provide a crucial opportunity for H’Mong people to gain political 540
power. The larger and the more remote the village is, the more likely an individual is to take 541
part in the party. 542
Members of professional organizations are younger than those of the mass organizations. 543
The probability of participation increases with age, but decreases beyond the age of 49. Non-544
farmers and members other than heads or spouses are more likely to participate. Participation 545
increases with the dependency ratio and household’s wealth level. The probability of 546
participation increases as the distance between the village and the paved road increases, and 547
we find a negative and significant effect of ethnic heterogeneity. 548
Civic organizations, as explained in section 3.3, manage public resources, such as schools 549
and health committees, and environmental or security groups. Unlike mass organizations 550
however, these associations are not state-created, but defined within communities. Induction 551
into the groups is voluntary, but because important public resources are managed by these 552
organizations, membership is expected to be influenced at the village level. The probability of 553
participation increases with age, but decreases after the age of 37. Males and educated 554
individuals, as well as household heads and spouses, are more likely to take part in these 555
organizations. We find, as for mass organizations, that participation decreases with household 556
size, but increases with the household dependency ratio. The asset-based wealth index, which 557
might be related to social status, is found to have a positive impact on participation decision. If 558
ethnicity or the birth place of household heads and spouses are not found to have a significant 559
effects, we find that the index of inherited social distance (ISD), which captures the difference 560
of identity between the household and its neighbours, negatively affects participation. All else 561
held equal, the less similar the household is to its neighbours, the less likely the household 562
members are to enter such organizations. Finally, we find that ethnic heterogeneity positively 563
influences participation, while other village attributes are found to have no impact. 564
We thus find ethnic heterogeneity to have an ambiguous effect on participation incentives, 565
an effect that depends on the type of organization considered, the entry rule, and on the types 566
of goods that are managed by the organization. Participation in the communist, party, which 567
may be viewed as compliance with the political regime, is negatively influenced. Participation 568
in professional organizations is also negatively affected, while participation in civic 569
organizations is positively influenced. Inherited social distance however, is found to have a 570
negative impact on participation in this last model. We thus do not find ethnic heterogeneity to 571
negatively affect participation in the management of public resources, as is suggested, for 572
instance, by Alesina and La Ferrara (2005). The authors develop a model that shows how 573
ethnic heterogeneity might favour the emergence of private goods, while homogeneity is 574
expected to enhance the formation of public goods. While estimates here do not provide 575
information on the quantity and quality of public goods generated at the village level, they do 576
show that if the quality of public goods were negatively affected by ethnic heterogeneity, as is 577
suggested in other literature, this would not be a result of lower preference mechanisms (and 578
lower participation), but rather of cooperation failures (among participants). The negative sign 579
of inherited social distance shows however, that the competition for managing these public 580
resources might be important, and those who inherited “better” social positions are more likely 581
to participate in the controlling of these goods. The negative indicator for professional 582
organizations is more puzzling, as these organizations manage what can be qualified as club 583
goods. This sign can be interpreted as a greater ability and willingness of individuals living in 584
an homogeneous environment to organize professionally, as a way to increase productivity. 585
This may occur more in homogeneous environments, where individuals can make use of a 586
common cultural material (see Section 2.2) and cooperate effectively. 587
5.2 The determinants of households’ social network capital 588
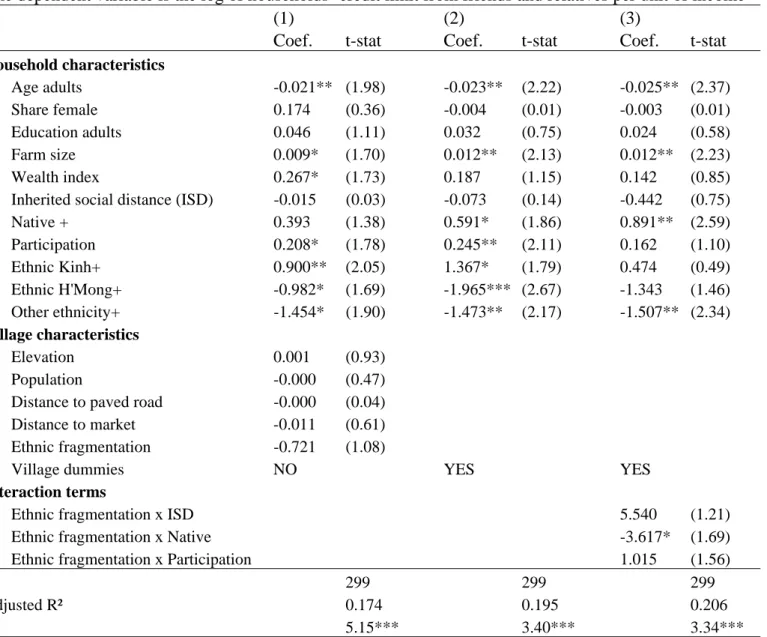
OLS estimates of the financial social network capital model described in Section 4.2 are 589
reported in Table 4. 590
In the first column, we test the direct impact of ethnic heterogeneity on households’ 591
network size using control variables to capture village heterogeneity. The small difference 592
observed between Columns 1 and 2 in coefficients and in the adjusted–R² indicate that the 593
control variables capture village heterogeneity well. We test, as in the previous model, for 594
endogeneity of the ethnic fragmentation variable using the same instrument as above, i.e. the 595
occurrence of involuntary resettlements of households in a village after independence. With a 596
partial-R² of 0.10, an F statistic of 31.4, and a Wu-Hausman test yielding a p-value of 0.39 we 597
confidently treat the variable of ethnic fragmentation as exogenous. 598
[Insert Table 4 about here] 599
We find that a household’s informal lending network size decreases with the age of adult 600
members, but is not affected by the gender of household members nor their education level. 601
Unsurprisingly, households’ farm size and wealth level positively influence their borrowing 602
capacity from their friends and relatives. Inherited social distance and whether the household 603
heads or spouses are native to the village are not significant, but once village fixed effects are 604
controlled for, we find that this latter variable has a positive and significant effect. The 605
participation of household members also positively influence households’ borrowing capacity 606
from their social networks and this effect is even stronger once we control for village fixed 607
effects. Comparatively to Thai, Kinh households have a larger borrowing capacity from their 608
networks, while the H’Mong and other ethnic groups can borrow less. Once we control for 609
village fixed effects (Column 2), these effects become larger. Ethnic dummy variables in the 610
village fixed-effect model capture ethnicity effects in heterogeneous villages, because 611
ethnicity in homogeneous villages is captured by the village dummies. Therefore, these results 612
indicate that a H’Mong household living in a H’Mong village has higher borrowing capacity 613
than it would in a heterogeneous village. 614
Village-level variables, including ethnic heterogeneity are found to have no direct effect on 615
households’ level of social network capital. 616
In the third column, we test for interaction effects between ethnic heterogeneity, i.e. the 617
dispersion of identities within the village and identity and participation variables. The idea 618
here is to test whether village-level heterogeneity indirectly affects such capital by influencing 619
the effect of identity, and participation variables. While identity variables capture households’ 620
inherited level of social network capital, the participation variable captures an investment that 621
household member may undertake, consciously or unconsciously, as a way to expand their 622
personal network. Following the discussion on subjective identity in Section 2.3, we expect 623
that heterogeneity affects the way individuals perceive their own identity and the identities of 624
their neighbours, and thus their ability and willingness to connect with their neighbours. We 625
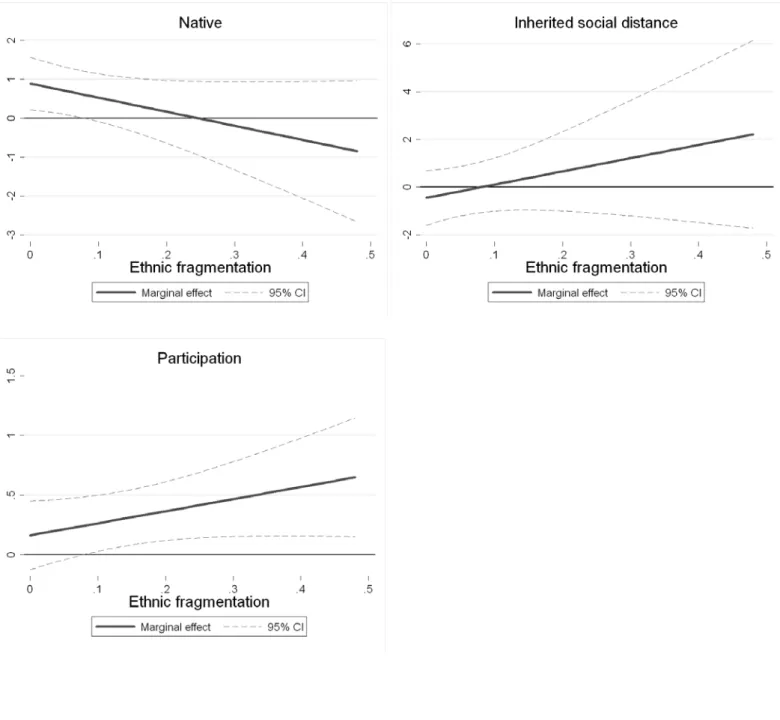
present results in Column 3 of Table 4. As pointed out by Brambor et al., (2006), results 626
displayed in regression tables provide limited information on the combined effect of two 627
continuous variables, as the effect of one is estimated at the mean value of the other. We report 628
in Figure 1, in addition to the table results, an estimation of the marginal effects of the three 629
interacted variables for different values of ethnic heterogeneity with their respective 95% 630
confidence interval (these are marginal effects on the log value of the dependent variable). 631
Results show that being a village native in a homogeneous village has a positive effect on 632
households’ access to credit from their social network, but that this effect decreases as ethnic 633
heterogeneity in the village increases, and becomes quickly insignificant. No statistically 634
significant effect is found regarding inherited social distance. Finally, the marginal effect of 635
participation is also positively influenced by the degree of heterogeneity in the village. The 636
marginal effect becomes significantly different from 0 for a value of ethnic fragmentation that 637
is greater than 0.1. 638
[Insert Figure 1 about here] 639
Now we consider identity variables as indexes of households’ innate social characteristics, and 640
participation as an index of households’ investment in social life. Results indicate here that 641
while the innate characteristics pay off in homogeneous settings in terms of social network 642
capital, they lose their value as the degree of heterogeneity increases. Conversely, while 643
investment efforts have no significant return in homogeneous communities, their returns 644
appear to increase as ethnic heterogeneity increases. 645
In the literature on individual social capital, differentiates distinction is often made 646
between bonding and bridging social capital, the former referring to the strong links tying 647
similar individuals (kinship ties and close friendship), while the latter refers to weaker ties 648
linking more distant individuals (Gittell and Vidal, 1998; Woolcock, 1998; Woolcock and 649
Narayan, 2000). The combination of the two, rather than the possession of one type, is seen as 650
the most conducive to economic development (Granovetter, 1973; Woolcock and Narayan, 651
2000). The above-mentioned results show that bonding ties are more important in 652
homogeneous settings, since identity plays a strong role there. A household’s social network is 653
likely to be composed of households sharing the same identity, if this social network is 654
sufficiently rich, individuals may not seek out additional relationships. This provides an 655
explanation for the low return of participation on households’ social network capital observed 656
in homogeneous villages. As pointed out by Dasgupta (2005), the marginal utility of creating 657
new relationships, and therefore the incentives to do so, decreases as the amount of inherited 658
relationships increases. In heterogeneous settings, on the other hand, where individuals are de 659
facto more distant, individuals need to invest in expanding their networks, and participation in 660
local organizations, as we saw, is a mean of doing so. 661
This raises questions regarding social mobility in homogeneous settings. If indeed social 662
networks are determined by inherited position, the capacity of those who were born in low 663
positions (or who migrated to the village) to move upward in the social and economic space 664
appears to be rather limited. Heterogeneity instead seems to induce more flexibility in the way 665
people connect with each other, and seems to favour the emergence of bridging connections. 666
Hayami (2009) notes that the bridging connections help in adapting ‘obsolete social norms’ to 667
current contexts. By ‘obsolete social norms’ he refers to norms and other institutions 668
established overtime in traditional societies aimed at ensuring a social order, which may 669
become inefficient as the economic and natural context evolves quickly (i.e. population 670
growth and natural resource scarcity, transition to a market economy, etc.). These norms need 671
considerable time to adapt to changing conditions, and the social interactions between 672
individuals of different identities and traditions are likely to speed up this process. Based on 673
our finding, we conclude that heterogeneous communities may be more likely to adapt rapidly 674
to changing economic and ecological contexts. 675
6 Conclusion
676The economic importance of ethnic diversity is gaining interest in the literature. Indicated as a 677
factor that explains differences between levels of development observed in different countries 678
or regions (Easterly and Levine, 1997), a growing body of literature seeks to explore the 679
existence of mechanisms in place at the microeconomic level. Social capital, while difficult to 680
capture in a single and tangible measure, appears as a powerful concept to explain differences 681
in the economic performance of groups or societies. It is also often cited as one of the 682
mechanisms through which ethnic heterogeneity undermines the economic performance. This 683
article reviewed the literature and explored this question empirically. The existing empirical 684
evidence on this relationship is relatively scarce, and findings appear to vary strongly from one 685
country to another. 686
Recognizing the multi-faceted and complex nature of social capital, we use two measures 687
and study two of its facets, namely participation in local organizations and households’ social 688
network capital, concentrating, for the latter, on a measure of households’ financial social 689
network. We make use of a particular setting in a rural district of Northern Vietnam in which 690
ethnic heterogeneity within communities has been externally induced through resettlement 691
policies conducted by the government in between 1960 an 1982. Using a detailed individual-, 692
household- and village-level dataset collected in 2007/2008 on individuals’ membership in 693
organizations, households’ credit access, and village-level settlement history among many 694
other issues, we estimate econometrically the determinants of participation in local 695
organizations as well as the determinants of households’ social network capital. 696
Our results show that ethnic heterogeneity has an ambiguous impact on participation 697
incentives, and that this effect strongly varies depending on the type of association considered, 698
namely its political nature, the type of entry requirements, or whether it manages public or 699
club goods. Using the past resettlement policy as an instrument, we are able to test and control 700
for endogeneity of ethnic heterogeneity. The results do not confirm the negative relationship 701
between ethnic diversity and participation in the management of public goods that is predicted 702
in the literature, but show in fact a positive impact. Results, furthermore, indicate that 703
competition for the management of these goods is important within villages, and that identity 704
and ethnicity in particular play a significant role in determining who among village members 705
will take part. We find however, a negative impact on participation incentives in the 706
communist party, and also on professional organizations which are aimed at creating club 707
goods. These results do not seem to confirm the prediction that participation in the elaboration 708
of public goods decreases with the degree of heterogeneity. 709
We then develop an econometric model of household investment in social network capital, 710
focusing on finance-related social networks. We hypothesize that households’ level of such 711
capital is both a function of innate characteristics, denoted by identity and inherited social 712
distance between the household and its neighbours, and investment decisions such as 713
participation in local organizations. We find no direct impact of ethnic heterogeneity on 714
households’ network social capital even after controlling for the endogeneity of this variable. 715
However, a household’s wealth level and variables denoting its identity and the participation 716
of its members in local organizations appear to play a significant role. Furthermore, the test for 717
the existence of interaction effects between ethnic heterogeneity, identity, and participation 718
variables shows that ethnic heterogeneity has an indirect effect on households’ social network 719
capital. We find that households whose head or spouse are native to the village have a greater 720
level of capital in homogeneous villages, but that this effect is diminished as ethnic 721
heterogeneity increases. On the other hand, the effect of participation in local organizations is 722
insignificant in the homogeneous setting, but becomes significant and increases in magnitude 723
as the degree of heterogeneity increases. These results indicate that social mobility might be 724
limited in homogeneous settings, where inherited economic statuses are likely to persist 725
through generations. Conversely, in heterogeneous settings, households seem more disposed to 726
invest in establishing bridging connections, which may help communities to adapt to rapidly 727
changing conditions (population growth, climate change, etc.). 728