Scheduling Coordination in a Supply Chain Using
Advance Demand Information
Vincent GIARD and Gisèle MENDY
University of Paris-Dauphine, LAMSADE, Place du Maréchal de Lattre de Tassigny, 75016, Paris, FRANCE E-mails : vincent.giard@dauphine.fr, gisele.mendy@neuf.fr
Abstract: In an environment of mass customization where demand information can be placed in
advance with sequencing orders, the question of the best use of this information arises in a supply chain. This situation led the authors to analyze the efficiency of current mechanisms of scheduling coordination when suppliers' processes are not completely reliable. Policies such as periodic re-plenishment or the kanban system, characterized by a replacement of the items to consume, cannot be exploited effectively with the current rules. This paper presents and justifies new scheduling co-ordination rules allowing synchronous production in an unreliable environment. This new ap-proach has been benchmarked in the automotive industry as an appropriate method to avoid stockouts and decrease the safety stock.
Keywords: supply chain; scheduling coordination; order penetration point; kanban; synchronous
production.
1 Introduction
Over the two last decades, the evolution of the economic environment of the compa-nies has led to an increasing tension on flows, in particular for the compacompa-nies specialized in the mass customization. Mass customization implies high volume and high variety production and that requires specific mechanisms for managing the supply chain's complexity (Coronado et al. 2004). Research has been investigating in supply chain conditions and structures that can adequately support mass customization (Feitzinger and Lee 1997). Manufacturing practices such as closer structures like ASTS (Advanced Store Supplier) and ASS (Advanced Site Supplier) in the automotive industry or delayed differ-entiation are no longer sufficient to face new challenges. Moving to mass customization in a supply chain frequently leads to excess lead times, huge stocks and creates conflicts in a manufacturing system where information sharing becomes too difficult (Simchi-Levi
et al. 2000). In response to this situation, the demand information must take place in
advance not only a few hours before the needs but for a few dozen hours:this triggers a change of scope. The solution which consists in improving the quality of the information in circulation throughout the supply chain is no longer sufficient when certain suppliers' processes are not perfectly reliable. This issue has not been considered in current researchs. Thus, it is necessary to find new scheduling rules to reconcile effectiveness and efficiency. The authors examine herein a few of the available approaches and the neces-sary adaptations to contend with these new challenges, then presenting a new approach based on synchronous production successfully tested in two industrial cases.
This research was supported for three years by a leading European firm which has just decided to generalize the use of this new approach. Some automotive manufacturers, conscious of the potential profits enabled by synchronous production, decided to transmit their orders in advance to some of their suppliers. This approach led the authors to identify by simulation those profits associated with this new information by benchmarking the established rules and the new rules based on synchronous production. Modeling the
processes of two different suppliers allows for an analysis of the current rules such as kanban for the first supplier or periodic replenishment for the second one. This benchmark based on simulations, provides answers to these questions and gives some insight into the robustness of these new rules.
First at all, concepts will be presented in order to justify our approach. The distinction between a pull system and a push system, with its implications for scheduling coordina-tion, requires it to be specified when it is used in the analysis of production flows in a supply chain. In this chain, the speed of information flows relating to firmed orders plays a major role in the organization of production, from the process of having to satisfy the end-users' demand to the direct or indirect supplier process. The analysis of the interde-pendence between an industrial customer's process and his suppliers' process is profitable and can be facilitated by using the Order Penetration Point (OPP). The remarks which result from it form the basis for the structure of this analysis.
In a second time, new rules are proposed allowing a synchronous production when suppliers' processes are not completely reliable. Simulation runs show that synchronous production leads to pratically eliminate stockouts while decreasing inventories; further-more, this approach instantly takes into account any change in demand structure and does not require accurate data for distant periods.
2 Concepts
2-1 The logistics chain
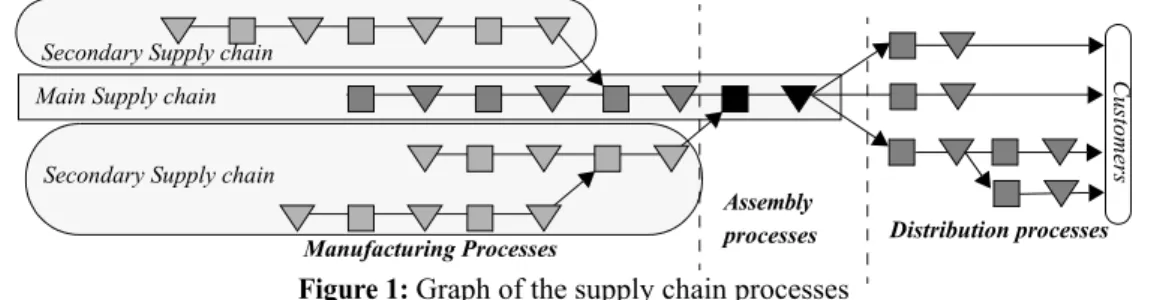
Many problems arise in the definition of the logistics chain and its use from an operational standpoint (Giard 2003, 2004). The authors will limit the analysis to certain specific elements dependent upon the use of information in scheduling the flows of a logistics chain as a sequence of the production process or of transportation, bound by customer-supplier type relations and directed towards the satisfaction of a final demand. In this context, the logistics chain allowing the manufacturing of a given range of products is generally characterized by a network of processes converging towards a final assembly process; the distribution and the sale of these products are often then carried out by a diverging type of distribution network. This logistics chain can be described by the general diagram shown in flow chart of figure 1.
We are especially interested in the logistics chains directed towards manufacturing and assembly to satisfy final customer orders or those of intermediaries of the distribution network, whether formulated in response to known demands or anticipated. In this network, we will distinguish the principal supply chain, made up of a sequence of processes converging towards the assembly process which delivers products which satisfy the demands of customers, from the secondary supply chain, which feeds components into the processes of the principal logistics chain. Generally, the manufacturing system of the principal logistics chain belongs to the same legal entity which may or may not own whole or part of the manufacturing systems associated with the secondary logistics chains. In either case, the problems of scheduling coordination the supply chain arise in the same
Assembly
Figure 1: Graph of the supply chain processes
Cu
stomers
Distribution processes Manufacturing Processes
Main Supply chain Secondary Supply chain Secondary Supply chain
manner but it seems easier to reconcile the local points of view when all the processes are within the same ownership perimeter. The traditional distinction between a pull system and a push system must be supplemented when it applies to the scheduling coordination of a supply chain.
2-2 Scheduling coordination with push and pull systems
Firstly, it is necessary to specify if it is the local or global point of view which is used when speaking about pull systems. From the local point of view, the qualification of pull systems is worthwhile only for the supplier's process, whose production is started only by the ordering of the one of the customer's processes to which it is directly related. From the global point of view of a supply chain, the same qualification can be used when the production of a process is not necessarily started by the ordering of one of the customer's processes to which it is directly related.
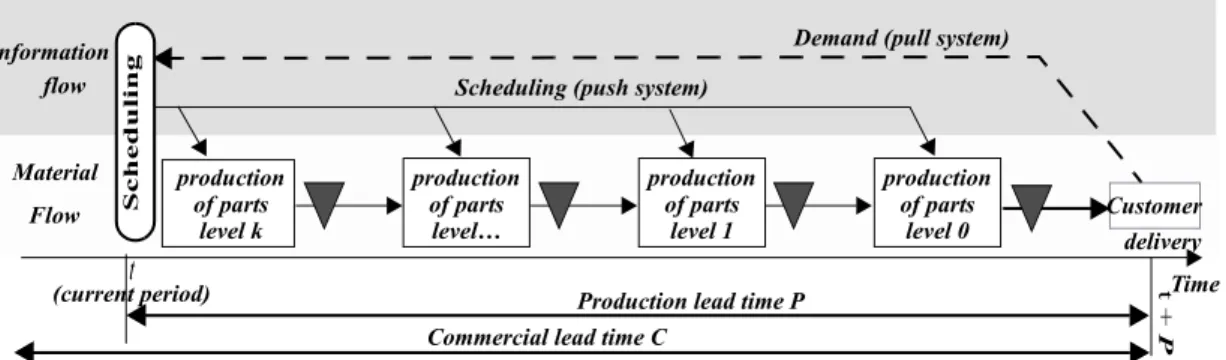
A push system can be used when the production of a process is decided in response to an anticipation and not in response to an order placed by the customer's process. This antic-ipation can be the result of a forecast in which case we are clearly in a production to stock approach. It can also result from a calculation of a supply in time of components to a customer's process. It make possible the delivery of products on a later date in accordance with an effective order already placed by a customer of the last process in the supply chain considered; this last process can't be the customer's process of the process considered here. This situation is characterized locally in a push system logic and, globally, in a pull system logic. In the following figure, orders are controlled globally by the pull system but locally, the scheduling of production is carried out with a push system logic.
When the request cannot be satisfied by a stock with products available and if the commercial lead time C is higher than the production lead time P, production can be carried out entirely on order. However, in the presence of a highly diversified production based on delayed differentiation, it can be useful to limit the number of production launch-ings, to produce to stock the common components for the majority of finished products whose nomenclature level is far from level 0. When diversity is lower and if the request for each part relates to sufficient volumes, it can also be economically preferable to produce to stock. The information of taking away from a stock can be exploited by one of the methods with pull systems using approaches like periodic replenishment but also with a kanban system. Information relating to the final request can also be immediately trans-mitted towards all the processes upstream of the supply chain and exploited locally in a push system approach.
Let us add finally that, in certain sectors, the principal supply chain tends to transmit their needs to the secondary supply chain earlier in order to shorten their reply deadlines. The displacement of the order penetration point (OPP) which results from it gives the
possi-Customer production of parts level k production of parts level… production of parts level 0 production of parts level 1 t Flow Information Time Material flow Scheduli n g
Commercial lead time C
Production lead time P t +
P
delivery (current period)
Demand (pull system) Scheduling (push system)
bility of increasing the proportion of production to order, making it thereafter possible to improve effectiveness and efficiency under certain conditions of demand.
2-3 Order Penetration Point (OPP)
This concept is relatively old. It refers to the reflexion led on postponement used since 1920 and formalized in the Fifties (Alderson 1950). According to this concept, the company must, insofar as possible, delay the execution of certain production operations, such as assembly or conditioning, by starting them only with the reception of firmed orders to answer, without useless stocks, and with the exact needs expressed by the customer. The concept of the order penetration point can also refer to the point of decou-pling (CODP, Customer Order Decoudecou-pling Point) introduced by Philips Logistics School in the Netherlands and defined as "the point on the logistic chain where the order of the
customer penetrates". Philips left the report that the whole of its processes which cannot
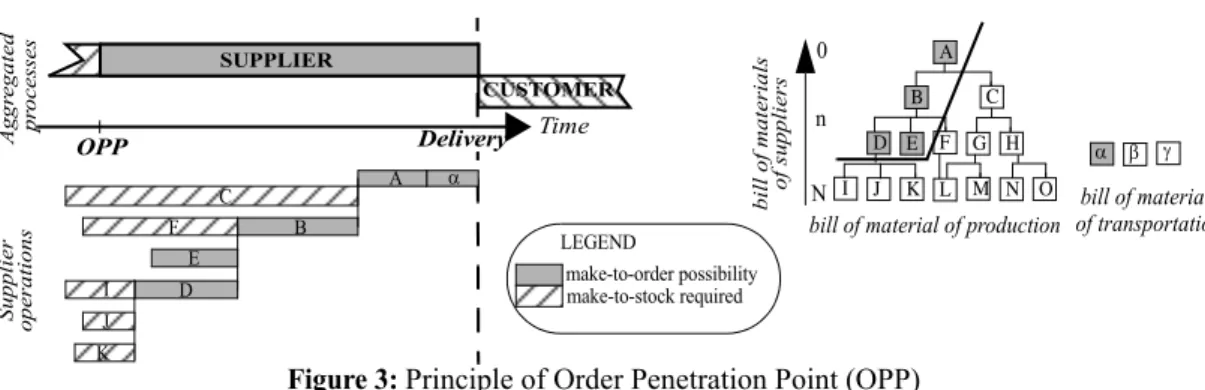
function at the same speed required the introduction of a point of decoupling. The order penetration point is successively presented as a topic of strategic interest. Vollmann et al. (1997) refers to the OPP by distinguishing Make to stock, Assembly to order and Make to order approaches. Olhager and Östlung (1990) discuss the use of push and pull systems relative to the position of the OPP, arguing that pull systems are necessarily applicable upstream of the OPP and push systems are for downstream operations. This approach could be different in the logistics chain depending upon the global or local vision, presented above. Olhager's article (2003) investigates factors that affect the positioning and shifting of the OPP; these factors have been categorized through market, product and production characteristics. He proposed a conceptual model that can assist in choosing the right product delivery strategy and wants to highlight the most large issues concerning market, product and production attributes, illustrating that there is a fundamental differ-ence between pre-OPP and post-OPP operations. The main competitive priority that is directly related to the position of the OPP is delivery speed. He proposes strategic issues, reasons and negative effects of shifting the OPP forwards or backwards. Researchers in logistic chains are also interested in this concept for its potential to improve productivity (Hoover et al. 2001) or for the flexibility of productive systems (Roos 2000). But the production of a complex product also implies the combined use of the bill of materials and the production route sheet of this product and its components. The route sheets make it possible to associate a process to the manufacturing of each component; the bill of mate-rials then makes it possible to thus establish the flows involved in the production of the product and of the logistics chain concerned. Knowledge of the time interval separating acceptance of the order from its delivery can be reflected in cascade in the concerned processes upstream from the original order in the logistics chain. On a Gantt chart visual-izing the sequence of the processes of the logistics chain, the length of the rectangles asso-ciated with the processes being proportional to their duration, one can locate on the axis of time the point corresponding to the date on which the delivery date is known in a secondary logistics chain. This point, a single one if all of the processes have that infor-mation at the same time, is described as the OPP. It makes it possible to trace a border in the processes between those which can order and those which must make-to-stock, a similar border being able to be established in the bill of materials. Figure 3 illus-trates this determination of the OPP and the division which it operates in the whole of the processes and in that of the parts.
Upstream to the OPP, the knowledge of the final demand comes in too late to be able to make-to-order but it can be used by certain policies of make-to-stock production (e.g., policy of periodic replenishment of an order-up-to-level). Downstream from the OPP, this information allows a make-to-stock strategy as well as a make-to-order strategy.
The passage to synchronous production, with which one is interested here, has as a conse-quence the displacement from the left of the OPP, allowing the replacement of a make-to-stock production by a make-to-order production. This is accompanied by the transition from scheduling with pull systems locally to scheduling with pull systems overall, locally becoming scheduling with push flows. Synchronous procurement and synchronous production can effectively relate to these two approaches. The tension on flows, combined with an insufficient reliability of the productive processes of the secondary logistics chain, led to imagine new methods of scheduling synchronous production to limit stocks and avoid stockouts.
3 Synchronization with an insufficiently reliable supply chain
The problem of storage space close to the line of production, due to a strong diversity in assembly, led automotive constructors to turn to synchronous supplying in a context char-acterized by a low anticipation of demand. In this case the only solution is to use the delayed differentiation carried out by one of the last processes of the secondary logistics chain, starting from preexisting stocks of different components (the assembly of automo-bile seat covers constitutes the classical example). An increase in this anticipation makes it possible to go from a synchronous supply system to a synchronous production system, where the components ensuring differentiation can be manufactured with the order instead of being stocked. When a firm sends periodically schedules to his suppliers, they may define their production using this anticipation, if their OPP allow it. Holweg et al. (2003) set out the dynamics aspects of changing vehicule supply from forecast to an order driven strategy. They present a model of the information flow within the automotive supply chain. It was found that current vehicle scheduling systems are heavily constrained by long order throughput times and a high degree of variability for components that is passed onto the suppliers. The lack of reliability of suppliers’processes and forecast demand has not been taken into account in existing researchs. If the reliability of the processes of the secondary logistics chain is good, one is brought back to the scheduling issue evoked in synchronous delivery but in a logic of slipping programming within a range of a few dozen hours. The problem is definitely more complicated when the produc-tion process of the secondary logistics chain does not have sufficient reliability compared to quality standards (the severity of which tends to increase).
Graves et al. (1995) and Stevenson et al. (2005) present notable reviews of production planning and control mechanisms such as kanban, CONWIP, MRP, base stock system...
Figure 3: Principle of Order Penetration Point (OPP) Time CUSTOMER Ag gr eg ated A B C L K SUPPLIER M G H I J N O E D F α β γ
bill of material of production
bill of m aterials of su pp liers bill of materials of transportation Su pp lier op er at io ns Delivery OPP A C B F E D I J K α 0 n N make-to-order possibility make-to-stock required LEGEND pr ocesses
but only partially treat the short term and fail to make use of the possibilities of demand anticipation. Some mechanisms devoted to the short term decisions, like the kanban system and most inventory management policies, use previous consumption as a basis for replenishing stocks.
New approaches of scheduling coordination must therefore be designed.
3-1 Synchronous delivery
Synchronous delivery is based on placing an order with a supplier in charge of supplying a workstation assembling substitutable components. The principle is to deliver a batch of components at a precise time in order to cover exactly the demand until the next delivery, these components being arranged in the order of their use (sequenced delivery whick takes into account all of the differences of the finished products due to options). The problem of lack of space in the line stock does not arise any more, as it depends on the frequency of deliveries. The sequence of the order, passed a few hours before consumption by the supplier, must exactly respect the sequence on the customer assembly line after delivery. This sequence can be the one observed at the entrance of the first station of the production line or at a subsequent station, if this order can be disrupted (Danjou et al., 2001). Then scheduling in pushed system on the basis of anticipation can be considered reliable. The short reaction time left to the suppliers forces them to mobilize the principles of delayed differentiation in the design of their products and processes (Tarondeau, 1982) and to use closer structures making it possible to prepare the delivery of a sequenced batch (Advanced Store Supplier, ASTS) or to complete the differentiation required by their customers (Advanced Site Supplier, ASS).
3-2 Synchronous production
After presenting the industrial context, we will successively examine the two principles which brought about the new approach of scheduling synchronous production that we propose.
3.2.1 The industrial context
Synchronous production is basically characterized by a transmission of the requisition of components to the supplier, several dozen hours in advance instead of a few hours in advance as is the case with synchronous delivery. This solution is somewhat useful because the upstream movement of the order penetration point makes it possible to decrease the share of production for stock to the benefit of production to order, making the use of closer structures such as ASTS or ASS less attractive. However it encounters two difficulties.
- First of all, it is necessary that transmitted information be completely reliable. This reli-ability is not ensured if the order observed at the time of the sending of information to the supplier can then be disturbed for reasons already mentioned (line control of quality or stockout upstream to the assembly station). The use of corrective mechanisms (Auto-mated Storage and Retrieval System allowing a partial rescheduling of flow, safety stock…) proves to be necessary. In the analysis presented here, one will suppose that transmitted information is reliable, the presentation of mechanisms of correction being incidental respective to the objective of this article.
- It is then necessary that the supplier benefits from transmitted information. If the usual approaches of scheduling flows are not adapted, it is appropriate to design new ones. We will examine some successfully tested usable principles.
The authors will only examine here the case of a process allowing manufacturing of several alternative components used at a given station of the assembly line. This research will be based on a study of two industrial cases, the first one using a kanban system and the second one, a periodic replenishment policy. Numerous simulations made it possible to compare the performance of these rules of scheduling with the new rules suggested here. If the production process of the supplier guarantees defect free quality, the sched-uling of flows is relatively easy. Nevertheless, we will start by presenting our approach in a deterministic universe, which facilitates the comprehension of first founding principle. Its adaptation in a stochastic universe is based on a second principle. Of course, the comparison of this approach with current practices will only be presented in stochastic universe on the basis of industrially validated observed characteristics.
3.2.2 Decision-making in a deterministic environment- presentation of the first prin-ciple mobilized by the new approach of synchronous production
The assumption of deterministic universe has three high consequences on which the algo-rithm of synchronization is based; only the third will call into question when one passes into a stochastic universe.
- The decisions of production launching by the supplier are made at regular intervals of amplitude τ. This interval cannot be lower than the maximum unit operational time τ0 of the process nor higher than a threshold τ1 defined by the last requisitions known by the customer at the time of the decision-making. The definition of τ must take into account the periodicity of the rounds of removal but also, as shall be seen, the possible existence of a launching time. At the time of the decision, date t, one lays out for each part number i of a stock and the sequencing demand to satisfy starting from this date on a horizon H corresponding to the anticipation provided by the customer (with H≥ τ). The demand to satisfy between t and is noted . If, at the time of the decision-making, parts are still in production, their precise dates of delivery are known. Lastly, the interval of time between launching in production and delivery is certain. - The provisioning of the studied process is guaranteed (absence of stockouts). Thus one
is not worried here about the scheduling of the process-upstream. The rejection of this hypothesis does not create a problem but complicates the analysis without changing the bases; it is more difficult in a stochastic universe.
- The production of this workshop is without defect. The rejection of this hypothesis will result in proposing new rules of production programming.
In a deterministic universe, the existence of stock is justified only for three reasons: - The launching of part number i in production is preceded by a set-up time and in order
to satisfy the whole of the demands the output of the workshop does not allow for much time wasted in launching (a point of view adopted for each production program in particular) but one can also justify these stocks by the decision to limit the set-up costs of the production program (angle agreed for the whole of the production program). - For technical reasons, launching in production of a part can be brought to respect a batch
size importance of which is more than likely to exceed the request to satisfy until the next decision-making. It can be observed when the process led to simultaneously treat several batches (heat or chemical treatment), each batch of fixed size relating to the same part (which does not exclude the possibility of having several batches relating to the same part).
- Only a judicious accumulation of stock makes it possible to avoid any stockout if the number of batches which one can launch between two successive decision-makings is lower than the number of parts.
Sit
t' Dit' (t t' t H≤ ≤ + )
At the date t of decision-making, in addition to stock available , we know the request to satisfy between t and . The first principle of operation of the
algo-rithm proposed is that of a simulation of the evolution of stocks starting from this date t to seek the parts which will be most quickly in stockout condition. In this simulation, we take into account the deliveries made between t and , corresponding to the decisions taken before t as well as those of the decisions taken in t (they will be taken gradually during simulation).
- We seek initially the first date of estimated stockout, which occurs for the part number ; in order to avoid this rupture, it is decided to launch in production by anticipation at the date t the quantity generally defined by a batch of minimal size under constraints of exogenous rule of batching, which leads to an update of stock of the part number , at the date in the simulation:
- If there remains a residual capacity at the date t the simulation goes on until the second stockout which occurs in and relates to the part number (which can possibly be the same one as that which caused the preceding rupture), which results in launching at the date t the quantity .
- The simulation continues as long as an unexploited residual capacity remains. Three remarks can be made:
- If initials stocks are sufficient, the stockout is impossible; a solution prohibiting any rupture consists in dimensioning the initials stocks on the estimated request until the next decision-making.
- An adjustment of this rule is possible if one is in the presence of production constraints (cost of launching depending on manufacturing order, regrouping of parts for constraints of colors…); these adaptations primarily exploit the definition of the residual capacity and the sequencing of the parts launched in production, if the latter is spread out in time, without affecting the stated principle.
- The capacity available cannot be saturated when the horizon H is reached in simulation. In this case, and if the production rate is higher than the rate of the customer’s consump-tion , we can use (or not) this residual capacity to increase the size of the batches of the parts and/or decide to launch the production of new parts.
3.2.3 Decision-making in a stochastic environment- presentation of the second prin-ciple mobilized by the new approach of synchronous production
The hypothesis of a production without defect does not hold out for production processes; a vehicle implies some adaptation of decision rules. The painting processes, for example, generally have a rejection rate p going from 5 to 15%. The classic industrial solution consisting in considering that on n produced parts (n corresponding to the upper round-off of , noted ), will be good, cannot guarantee the absence of stockout, the number of good parts according to the binomial distribution .The risk incurred with this solution is illustrated with an example in table 1.
Compared to a deterministic universe, the only change relates to the update of stocks , … During the simulation, the update of stock used in a deterministic universe must be adapted since it is possible that one or more units among the delivered will be defective. The second mobilized principle is that of a control of the
stockout risk. This risk is managed while replacing by that is the greatest quantity such as , where α is a risk of rupture of maximum provisioning accepted (α =1% in our example) and follows the Binomial distribution B . Table
Sit Dit' t' t t' t H( ≤ ≤ + ) t' i1 qi 1 qi min≥1 Si 1t1' i1 t1' Si 1t1'←Si1t1'+qi1 ( ) t2' i2 qi 2 Si0 Si0 qit⁄(1 p– ) qit⁄(1 p– ) qit Xit B{ qit⁄(1 p– ) ,(1 p– )} Si 1t1' Si2t2' Si 1t1'←Si1t1'+qi1 ( ) qi 1 qi 1 xi P X( i<xi) α< Xi {qi,(1 p– )}
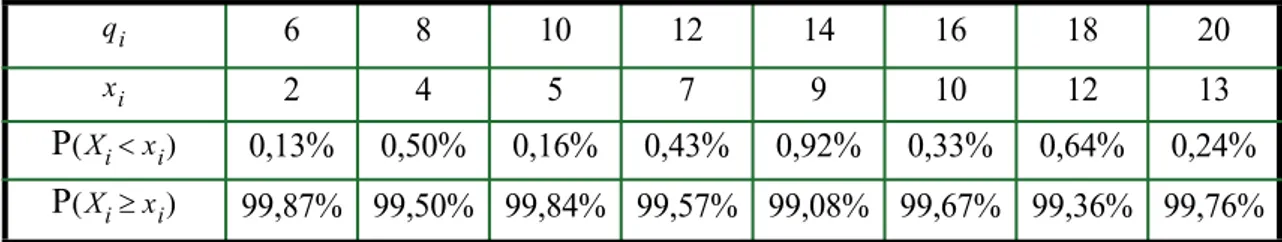
2 illustrates this determination for a probability of non-acceptance of an unspecified part of the batch, equal to 10%.
If we launch into production a batch of 10 units, only 5 units are taken into account when updating the stock during the simulation. That decision implies to accept a probability of 0,16% of stockout for the customer (delivery of less than 5 units). Let us suppose now that during the same simulation made to launch production at time t, the same item falls again into shortage. The batch size must be revised and passed, for example, with 20 units. By keeping the same risk, reading the table shows that we cannot hope to fall under 13 good parts (risk of 0,24% accepted). Before, for this same item, one had entered 5 good parts, this new decision of launching into production results in entering 8 more units (and not 5 again) to come up to 13.
Six complementary remarks must be made.
- This algorithm allows an immediate adaptation to any variation in the structure of the request. It is not the case for other approaches classically used (unless their decision variables are updated permanently). The problem of the variation in volume is implicitly taken into account if the production rate or the daily duration of work adapts easily, the level of anticipation necessary to calculate the estimated stockout (a number of products sequences asked by the customer) remaining the same.
- Calculations of the estimated position of stock underestimate the quantities in stock. With the following decision-making in t +τ, the whole or part of the production decided in t will be completed; this new decision will be made on the basis of stock observed , calculated from and part of delivered goods between t and t +τ (and not the “worst case” quantity used during the previous simulation).
- The risk of rupture of provisioning of a part i used at the time t of decision making is normally higher than that actually incurred.
- If the date of estimated rupture is posterior to the date t +τ, the probability of stockout on this date does not correspond to the risk α, associated with a delivery, but with , the risk incurred is then normally weaker than that which one accepts a priori. If, with the delivery, we observe more than one good part, the estimated date of stockout is then more distant. We can hope, with this slipping programming
Table 1: Probabilities of stockouts of supplying for the customer for various rejection rates p and various productions demanded ( = 5, 10, 15 and 20) • Use of the law L(X) = B
p n = n = n = n =
5% 6 3,3% 11 10,2% 16 18,9% 22 9,5%
10% 6 11,4% 12 11,1% 17 23,8% 23 19,3%
15% 6 22,4% 12 26,4% 18 28,0% 24 28,7%
Table 2: Good production having more than 99% of chances to be exceeded on a batch of size knowing that each part of the batch has a probability p = 10% of being defective
6 8 10 12 14 16 18 20 2 4 5 7 9 10 12 13 0,13% 0,50% 0,16% 0,43% 0,92% 0,33% 0,64% 0,24% 99,87% 99,50% 99,84% 99,57% 99,08% 99,67% 99,36% 99,76% P X q( < it) qit qit 1 p– ( ) --- ,(1 p– ) ⎩ ⎭ ⎨ ⎬ ⎧ ⎫ 5 1 p– ( ) --- P X 5( < ) 10 1 p– ( ) --- P X 10( < ) 15 1 p– ( ) --- P X 15( < ) 20 1 p– ( ) --- P X 20( < ) xi qi qi xi P(Xi<xi) P(Xi≥xi) qit Si t, +τ Sit qit P X( it = 0) = pqit
system, that if the first estimated dates of stockout are rather distant (2τ), we have time to react if certain deliveries are too bad.
- If initial stock does not cover the request to satisfy between t and t + τ, and if the date of estimated rupture is prior to t + τ, there are necessarily stockouts if there is no delivery before t + τ; in the opposite case due to a continuous delivery, this rupture can sometimes be avoided with a suitable sequencing.
- We already saw that at the time of the decision-making, the components in production can be in progress in the workshop and can be delivered before the next decision. The quality of these deliveries to come are not necessarily known, so we can decide, in the update of , either to use the principle of precaution retained for the deliveries to come, or to carry out a random pulling of the number of good parts (binomial distribu-tion). This second solution was used in the second case study, the simulation relating then to more than one month of operation.
Conventions selected to describe this algorithm in detail are as follows: - j is the rank of the component to be delivered to the customer (j = 1, …, J);
- i is a part number; then i(j) is the part number of the component of row j to be delivered to the customer;
- is the quantity of the part number i that is launched at time t, to be produced between
t and t+τ is ; the first decision of launching of this part number will relate to a quantity and each following decision increasing will relate to a quantity
(possibly equal to );
- is the capacity consumed by ; KA is the total capacity available for this period τ; KC is the capacity consumed overall by the program of production during that period
.
In the algorithm in table 1, one will preferably use notation i(j) is with i retained in the last two subparagraphs. In addition, the part number to the date t of decision-making will be omitted there in the indices used, which is without ambiguity, since it is a question of establishing a program of production to be implemented at this date until the next deci-sion, to take at the date t + τ.
Let us illustrate this algorithm supposing that, for the part number i = 5, one has
(opening inventory at the time of the decision-making), and , the risk selected is α = 1% and that we need not worry about problems of available capacity. Let us suppose that the 27th required component corresponds to the 4th required unit of this part number i = 5 (j = 27→ i(27) = 5); the stock (estimated) passes from 0 to – 1 (stage 1), then at stage 3 we have: and (see table 3) and the stock
(estimated) passes from – 1 to – 1 + 2 = 1. Let us suppose that to the required compo-nents 45th and 56th correspond to this same part number i = 5 and that they are the only ones between the 28th and 56th rows; when j = 56, the stock (estimated) passes from 0 to – 1 (stage 1); stage 3 one has , then , then , then
passes from – 1 to – 1 + 5 – 2 = 2.
Compared to scheduling rules based on the kanban system or that of the periodic replen-ishment policy, the application of this algorithm to two industrial problems in which a difficulty of production quality arose, allows one to clearly present the associated profits; the use of stochastic models made it possible to evaluate the rationality of the results.
Si0 Di t, +τ Sit' qit qimin≥1 q it qiΔ≥1 qimin K q( )i qit KC KA≤ ( ) S5 = 3 q5min = 6 q 5Δ = 4 S5 q5 = q5min = 6 x 5 = 2 S5 S5 z1 = 2 q5 = 6 q+ 5Δ = 10 x5 = 5 S5
4 Illustration by two industrial cases in the automotive environment
4-1 Modeling supplier processes in the automotive sector
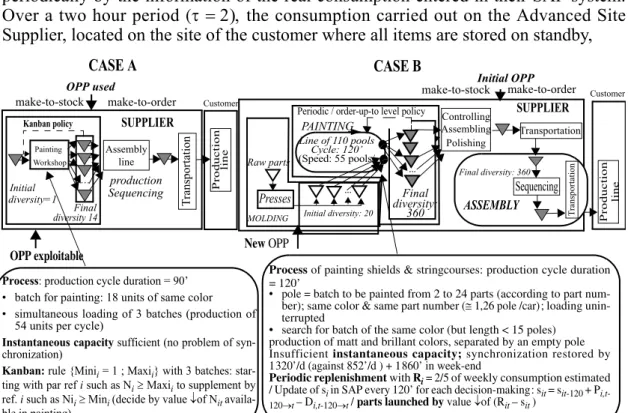
The two cases have in common the fact that the production processes are not completely reliable but they differ by the mode of scheduling currently in use (figure 3).
- In case A, the supplier introduces diversity by a painting process and thereafter carries out setting in stock the various colors obtained. Whereas the information transmitted by the customer has been exploitable upstream of the painting workshop for several months (administrative information sequenced over a few days), the OPP actually exploited is positioned by the supplier downstream from this diversity. The supplier uses firm infor-mation from the customer’s final assembly line and proceeds at the end of the course to the parts sequencing in the order of consumption of the customer’s assembly line. The production control of case A between painted stock and launchings performed in the painting workshop is based on a rather traditional kanban system. The initial stock dimensioned at the exit of the painting workshop for each referred color, corresponds to a number of kanbans defined by the supplier according to the structure of the request and of its practices of risk management. The setting of stock is defined on the upper limit of units making it possible to ensure a lesser risk of stockout (2 racks/color items); we are not here in the case of a maximum calculation of kanbans corresponding to the maximum quantity requested between two deliveries with the objective of canceling any risk of stock-out. For a diversity of 14 colors, the supplier can launch in painting, as a minimal size of batch, 3 batches of 18 units (cycle of 54 units) for a cycle time of 90
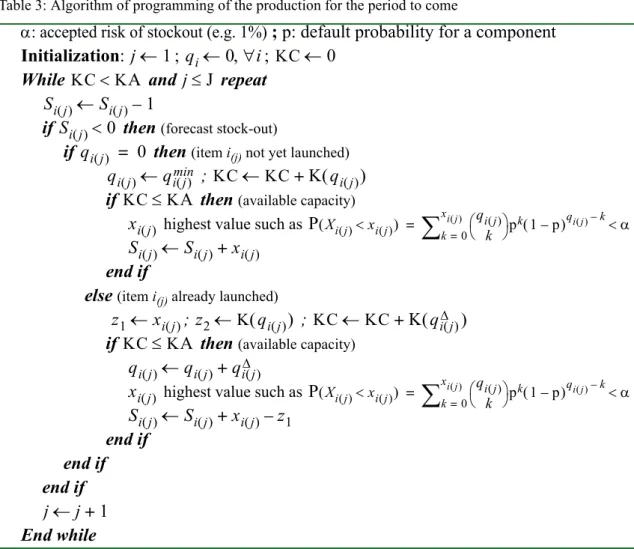
Table 3: Algorithm of programming of the production for the period to come
α: accepted risk of stockout (e.g. 1%) ; p: default probability for a component
Initialization: ; ;
While and repeat
if then (forecast stock-out)
if then (item i(j) not yet launched) ;
if then (available capacity)
highest value such as
end if
else (item i(j) already launched)
; ;
if then (available capacity)
highest value such as
end if end if end if End while j←1 qi←0,∀i KC←0 KC KA< j J≤ Si j( )←Si j( )–1 Si j( )<0 qi j( ) = 0 qi j( )←qi jmin( ) KC KC K q i j( ) ( ) + ← KC KA≤ xi j( ) P(Xi j( )<xi j( )) qi j( ) k ⎝ ⎠ ⎛ ⎞ pk(1 p– )qi j( )–k k=0 xi j( )
∑
<α = Si j( )←Si j( )+xi j( ) z1←xi j( ) z2←K(qi j( )) KC←KC+K q( i jΔ( )) KC KA≤ qi j( )←qi j( )+qi jΔ( ) xi j( ) P(Xi j( )<xi j( )) qi j( ) k ⎝ ⎠ ⎛ ⎞ pk(1 p– )qi j( )–k k=0 xi j( )∑
<α = Si j( )←Si j( )+xi j( )–z1 j←j 1+ Si0minutes. The periodicity of the decision-making for launching in production is with regular intervals of minimal amplitude of
τ =
90 minutes and the launching rules corre-spond to a traditional system of kanban.- The organization of case B is a little more complex; the supplier initially ensures the production of semi-finished products on the basis of an estimated request on his own manufacturing site located a few dozen miles from the customer’s factory. The initial diversity is of 18 colors for twenty different parts carrying final painting workshop exit diversity to 360 items. Launching in painting is not done on the basis of sequenced orders sent by the customer but with a logic of periodic replenishment policy monitored periodically by the information of the real consumption entered in their SAP system. Over a two hour period (τ = 2), the consumption carried out on the Advanced Site Supplier, located on the site of the customer where all items are stored on standby,
operation of final assembly, are recorded in their system. The order-up-to level is fixed for each item to 2 days of average consumption with an aim of avoiding any stock-out. The logic of a periodic replenishment policy is based on launching in painting for item i having the most high value of the difference (with = position of stock at the moment t). The parts to be painted are hanged on the poles of a conveyer with a loading capacity in painting of 55 poles/hour (maximum diversity produced in two hours equal to 110, whereas total diversity is 360), with this rule we exhaust the available launching capacity. Case B is more complex than case A characterized by the simultaneous launching of three components in painting: the decision relates to the sequence of the items to charge on the next 110 poles, by taking into account certain technical constraints; there is a need to separate with an empty pole any sequence of poles charged with compo-nents to be painted in a matt color from sequences of poles charged with compocompo-nents to be painted in a brilliant color; limitation of 15 of the sequences of poles of same color; seeking a minimization of the number of color changes. Supplier B carries out one last time the transportation of all the components (for all diversity) from his site towards the ASS where it carries out a final assembly of the parts on the basis of the sequencing request coming from the final customer before conveying them by internal transportation to the final station of consumption.
Pr od uction SUPPLIER Painting Sequencingproduction Assembly Kanban policy
Process: production cycle duration = 90’
• batch for painting: 18 units of same color • simultaneous loading of 3 batches (production of
54 units per cycle)
Instantaneous capacity sufficient (no problem of
syn-chronization)
Kanban: rule {Minii = 1 ; Maxii} with 3 batches:
star-ting with par ref i such as Ni ≥ Maxii to supplement by
ref. i such as Nii ≥ Mini (decide by value ↓of Nit availa-ble in painting) OPP used OPP exploitable make-to-stock make-to-order ... Final diversity 14 Initial diversity=1 Workshop line T ransportation line Production encyclée Initial OPP make-to-stock make-to-order Diversité finale = 360 ... Initial diversity: 20 ... Line of 110 pools Cycle: 120’ (Speed: 55 pools/ PAINTING MOLDING Presses Raw parts
Periodic / order-up-to level policy Controlling Polishing Assembling
ASSEMBLY
Final diversity: 360
Process of painting shields & stringcourses: production cycle duration
= 120’
• pole = batch to be painted from 2 to 24 parts (according to part num-ber); same color & same part number (≅ 1,26 pole /car); loading unin-terrupted
• search for batch of the same color (but length < 15 poles) production of matt and brillant colors, separated by an empty pole Insufficient instantaneous capacity; synchronization restored by 1320’/d (against 852’/d ) + 1860’ in week-end
Periodic replenishment with Ri = 2/5 of weekly consumption estimated
/ Update of si in SAP every 120’ for each decision-making: sit = sit-120 + P
i,t-120→t – Di,t-120→t / parts launched by value ↓of (Rit – sit )
New OPP Pr od uctio n T ra ns por tati on Sequencing Transportation CASE A CASE B
Figure 4: Modeling supplier processes (case A and B)- Kanban and Periodic Replenishment Policies
Customer Final diversity: SUPPLIER Customer line 360 Ri Rit–Sit Sit
4-2 Simulation of the current and new rules of scheduling coordination in a stochastic universe and analysis of results
The identification of the profits of a displacementof the OPP upstream by the introduction of diversity in the supplier goes through the analysis of a stochastic problem of scheduling production in painting for which simulation using the Monte Carlo method is very well suited. With the objective to obtain results by simulation, we retained herein two scenarios tested in a stochastic universe, with a rejection rate in painting of 10%. In steady state, a periodic rule of correction of the defective production has been applied to the two cases A and B.
Scenario 1 represents the current rules of the supplier (Kanban for the case A and Periodic Replenishment Policy for the case B).
Scenario 2 uses the new rules of scheduling in synchronous production.
The simulation of the two cases was carried out starting from the same sequenced set of 25 000 cars; the alternative part assigned to each vehicle is randomly defined using the current structure of demand. The simulation of different rules with such a set gives good information about the behavior of these systems in a steady state within the framework of the two scenarios. The neutralization of the end of that sequenced set was necessary in order to keep the minimum horizon required by the new rule of synchronous production; it leaves 4 weeks of production. Figures 4 and 5 provide the results of the simulations made with use of a rejection rate of 10%.
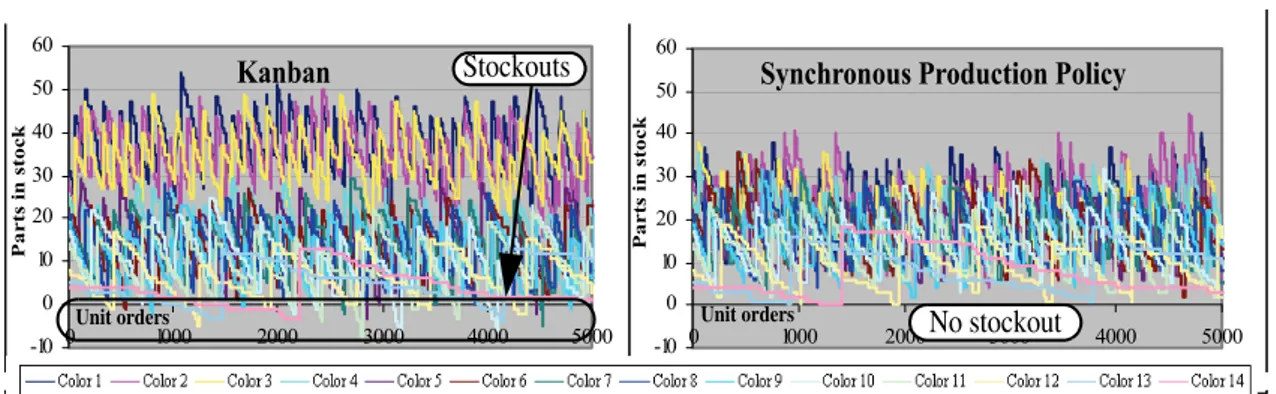
In case A (figure 5), the current scheduling of the kanban (including with a larger initial stock) does not make it possible to cover the risks of stockout which is explained by a total myopia of the orders of consumption coming in the absence of a dynamic readjustment from the number of kanbans being based on estimated information. In scenario 2, the application of the synchronous production algorithm with a visibility of the work orders on a horizon H = 10 (visibility which is equivalent to 10 cycles of 54 units or the next 540 orders) allows, with an initial stock reduced by 50% (initial stock defined by the supplier), to cover the whole of the requests and to preserve from risks of stockout. During several simulated data files, the first estimated dates of rupture appeared starting from a horizon ranging between H = 9 and H = 10. This highlights that the value of information is limited beyond that, knowing that the programming is slipping; in other words information beyond 540 sequencing orders does not have an added value (H = 10 corresponds to one day of firm). This conclusion is related to on the characteristics of the studied system and the setting of the initial stock; in addition, the algorithm presents the advantage of an immediate adaptation to all modifications of structure (the request being able without problem to concentrate durably on a single item).
. -10 0 10 20 30 40 50 60 0 1000 2000 3000 4000 5000 -10 0 10 20 30 40 50 60 0 1000 2000 3000 4000 5000
Kanban Synchronous Production Policy
No stockout
Figure 5: Results in a Stochastic Universe for case A: Evolution of inventory levels
Stockouts Unit orders Parts in stoc k Parts in stock Unit orders
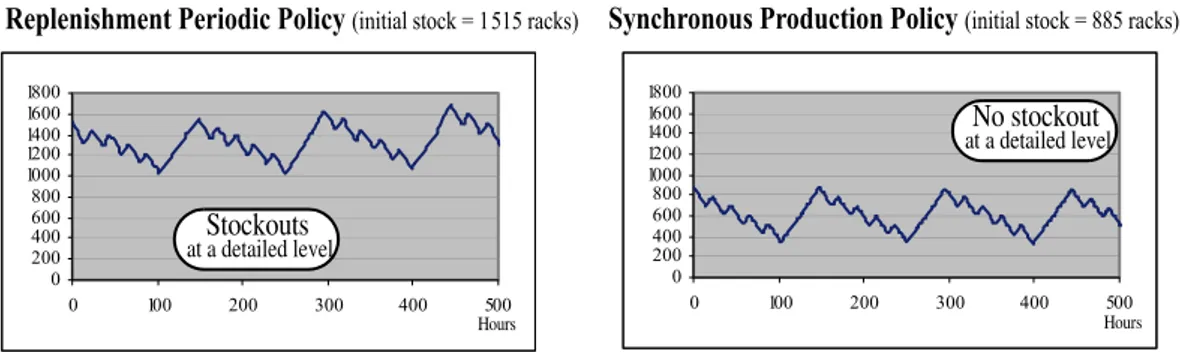
Figure 5 illustrates the results of the case B and shows the high reduction of stocks (60%) permitted by the new approach and this without any stockout, contrary to what occurs in scenario 1 where, for a 4 week simulation, we note 1.7% of unsatisfied requests due to stockouts; this rate† could be decreased by a dynamic parameter setting of the scheduling rules used. The stockouts are not visible in the figure 5 because the curve shows the total of the parts in stock (in racks). In synchronous production, with this initial stock, the last estimated date of stockout is shown as 25 hours, which highlights that any additional information does not have an added value. Modifications of the structure of the request are absorbed without any problem.
Case B is characterized by an additional attribute, that of a desynchronization of flows, induced by a supplier's output rate being lower than that of the customer. This shift is caught up with a daily production for the supplier with a longer duration than for the customer and by additional production during the weekend. This problem does not affect the proposed algorithm; it makes it possible however to understand the shape of produc-tion evoluproduc-tion curves (figure 5) as well as the fact that it is impossible to observe one stockout during the first two days with the current scheduling rules. It should be added that the scenario of case B rests on the consumption rate that the client forecast reaching; the current rate being lower.
5 Conclusion
Compared to scheduling rules based on the kanban system or the periodic replenishment review system, the application of this algorithm to two industrial problems in which a difficulty of a production quality arose, showed that it was possible to notably reduce safety stocks while improving the security of the customer's supply. Moreover, these studies showed the limits of the value of the information transmitted by the customer: in applying this algorithm, as soon as the available capacity for the period to come is satu-rated, information relating to the further demands which triggered the final decision of production is of no interest for scheduling the workshop. This assertion has to be discussed further if one also intends to control the process located upstream, but this anal-ysis is much more complex because of the uncertainty of production quality. Lastly, the reactivity of this approach to radical changes in the structure of the request constitutes a great additional advantage.
This exploration of new scheduling rules must go with an improvement of the quality of information circulating in the logistic chain and its speed of circulation, which rests on a better co-operation between the various actors and a reduction in stocks (the greater the level of stock, the wider the horizon of information is). This tendency also happens to point out what has been observed for ten years in the downstream part of the logistic
†. The actual rate is lower which is due to an actual consumption rate lower than the one the consumer wants to reach and asked us to use in the simulation.
0 200 400 600 800 1000 1200 1400 1600 1800 0 100 200 300 400 500 0 200 400 600 800 1000 1200 1400 1600 1800 0 100 200 300 400 500
Replenishment Periodic Policy (initial stock = 1515 racks) Synchronous Production Policy (initial stock = 885 racks)
Figure 6: Results in a Stochastic Universe for case B: Evolution of Cumulated Inventory Levels (in racks)
Stockouts at a detailed level No stockout at a detailed level Hours Hours
chain, with the installation of CPFR (Collaborative Planning Forecasting and Replenish-ment) types of collaborative policies implemented in mass distribution where distributors and industrialists divide work out and forecast jointly, jointly defining provisioning strat-egies and calling or not upon the approaches of the VMI type (Vendor Managed Inven-tory). This delay is explained mainly by a higher level of complexity: it is not only a question of managing provisioning in a network but, in addition, of producing with the order. To work in this direction is a high stake, likely to reinforce the defenses of our industrial system. As regards respect of the information transmitted to the supplier by the customer, one moved from a situation often characterized by a late and brutal passage of an absence of information to precise information, and a situation in which the customer engages gradually and relatively early with respect to his supplier, with an increasingly precise request as one approaches delivery. The analysis of the sensitivity of synchronous production regarding this problem of the reliability of information remains a track to be explored. A first analysis, carried out for case A, gives useful indications: when one works with estimated information for the first two hour periods (amplitude corresponding to the interval separating two successive decisions) then with the information aggregated per two hours, it is necessary to adapt the algorithm when a residual capacity remains when simulation exceeds the horizon of sequencing information; for the period during which the last estimated ruptures occur, there are normally more candidate parts than loading possibilities; one decided to choose these last parts to be charged at random. The simula-tions carried out show the robustness of the algorithm: sequenced information for the first three periods is sufficient as well as incorporated information for the following periods in order to avoid stockout (which occurs if one has sequenced information on a shorter horizon). Although it is difficult to generalize this precise result beyond the system studied, we can think that this algorithm puts up with less precise remote information.
6 References
Alderson, W., Marketing Efficiency and the Principle of Postponement, Cost and Profit Outlook, September, 1950.
Anderson, D.M., and Pine II, J., Agile Product Development for Mass Customization: How to Develop and Deliver Products for Mass Customization in Niche Markets, JIT,
Build-to-Order and Flexible Manufacturing, McGraw-Hill, 1997.
Anthony, R.N., Planning and Control Systems: a framework for analysis. Harvard
University Press, 1965.
CPFR: an overview, Voluntary Interindustry Commerce Standards. Available online at : www.vics.org/committees/cpfr/CPFR_Overview_US-A4.pdf, 2004.
Cachon, G.P., and Fisher, M., Supply chain inventory management and the value of shared information. Management Science, 2000, vol. 46, 8.
Coronado, A.E., Lyons, A.C., Kehoe, D.F. and Coleman, J., Enabling mass customization : extending build-to-order concepts to supply chains. Production Planning and Control, 2004, vol.15, n°4, pp. 398-411.
Danjou, F., Giard, V., and Boctor, F., Analyse théorique des décyclages sur lignes de production, Journal Européen des Systèmes Automatisés (APII-JESA), 2001, vol 35, n°5, pp. 623-645.
Feitzinger, E., and Lee, H., Mass customization at Hewlett-Packard: the power of post-ponement. Harvard Business Review, 1997, 75 (1), pp. 116-121.
Giard, V., Cohérence décisionnelle et réseau. Les réseaux: dimensions stratégiques et
organisationnelles, (C. Voisin, S. Ben Mahmoud-Jouini & S. Edouard editors).
Economica, 2004.
Giard, V., and Mendy, G., Le passage de l’approvisionnement synchrone à la production synchrone dans la chaîne logistique. Revue Française de Gestion, 2007, vol 33, n°171, pp. 64-88.
Giard, V., and Mendy, G., Amélioration de la synchronisation de la production sur une chaîne logistique. Revue Française de Génie Industriel, 2006, vol 25, 1, pp. 63-82. Graves, R.B., Konopka, J.M. and Milne, R.J., Literature review of material flow control mechanisms. Production Planning and Control, 1995, vol 6, n°5, pp. 395-403.
Holweg, M., Disney, S., Hines, P., and Naim, M., Towards responsive vehicle supply: a simulation-based investigation into automotive scheduling systems. Journal of
opera-tions Management, 2005, 23, pp. 507-530.
Hoover W., Eloranta, E., Holmstrom, J., and Huttunen, K., Managing the demand chain
: Value innovation for customer satisfactions, Hardcover Press, Novembre 2000.
Olhager, J. and Östlund, B., An integrated push-pull manufacturing strategy. European
Journal of Operational Research, 1990, 45 (2-3), pp. 135-142.
Olhager, J., Strategic positioning of the order penetration point, International Journal of
Production Economics, 2003, 85, pp. 319-329.
Roos, H.B., The concept of the Customer Order Commercial Decoupling (CODP) in
logistics management; a case study approach, http://www.few.eur.nl/few/people/roos,
Rotterdam, 2000.
Schwarz, L.B., The state of practice in supply chain management: a research perspective, in Applications of Supply Chain Management and E-Commerce Research. Kluwer Academic Publishers, 2004.
Simchi-Levi, D., Simchi-Levi, E., and Kaminsky, P., Designing and Managing the Supply
Chain, New York, Irwin/McGraw-Hill, 2000.
Stevenson, M., Hendry, L.C., and Kingsman, B.G., A review of production planning and control: the applicability of key concepts to the make-to-order industry. International
Journal of Production Research, 2005, vol 43, n°5, pp. 869-898.
Tarondeau, J.C., Produits et technologies, Choix politiques de l’entreprise industrielle. Dalloz, 1982.
Vollmann, T.E, Berry, W.L., Whybark, D.C., Manufacturing Planning and Control
Systems, 4th Edition. Irwin/McGraw-Hill, New York, 1997.
7 Biography
Vincent Giard is a professor at the University Paris Dauphine, after being professor at La Sorbonne (University Paris 1) for 12 years. He is a specialist of operations management and control, project management and quantitative techniques applied to management. He has written several books and many articles dealing with those topics. Web site http:// www.lamsade.dauphine.fr/~giard.
Gisèle Mendy studies Logistics Operations Management and Production at the University Paris Dauphine. After an experience of three years in the automotive industry, she started her PhD in 2003 and works in partership with Renault Industry in the Department of Logistics. Her main research interests are the demand of flexibility and reactivity to antic-ipate and adapt to changes in Logistics and Production Operations in JIT environment. She focuses her research on the analysis of knowledge value of the final demand in the Logistics chain using tools for simulation.