DIAL • 4, rue d’Enghien • 75010 Paris • Téléphone (33) 01 53 24 14 50 • Fax (33) 01 53 24 14 51 E-mail : dial@dial.prd.fr • Site : www.dial.prd.fr
D
OCUMENT DE
T
RAVAIL
DT/2007-05
Is the End of the MFA a threat for
the Tunisian Economy?
IS THE END OF THE MFA A THREAT FOR THE TUNISIAN ECONOMY?
Mohamed Ali Marouani
Université Paris1-Panthéon-Sorbonne/IEDES, DIAL et ERF marouani@dial.prd.fr
Document de travail DIAL
Mai 2007
ABSTRACT
The end of the Multifiber Agreement in January 2005 had a negative impact on the Tunisian apparel industry, but the effects were weaker than expected. Using a dynamic general equilibrium model, the article provides a prospective assessment of the impact on Tunisia of the phase out of the MFA and of the agreement which manages the rate of growth of Chinese clothing exports to Europe until the end of 2007. The main findings are an increase in unemployment and wage inequality, but no significant effects on the main macroeconomic variables if the exchange rate management takes into account this shock.
Key Words : CGE models, employment, textiles, apparel, trade, Tunisia RESUMÉ
Le démantèlement de l’Accord Multifibres en janvier 2005 a eu un impact négatif sur l’industrie d’habillement tunisienne, mais les effets ont été plus limités que prévu. A l’aide d’un modèle d’équilibre général dynamique l’article propose une évaluation prospective de l’impact sur la Tunisie du démantèlement de l’AMF et de l’accord d’auto-limitation des exportations de vêtements qui prend fin en 2007. La principale conclusion consiste en un accroissement du chômage et des inégalités de salaires. Cependant, en présence d’une gestion adéquate du taux de change par la Banque centrale, les principales autres variables macro-économiques sont peu affectées par le choc.
Mots clés : modèle EGC, emploi, textile, habillement, commerce, Tunisie JEL Code : D58, D91, D92, F16, J41
Contents
1 INTRODUCTION... 4
2 WHAT HAPPENED SINCE THE 1st JANUARY 2005 ... 5
2.1 The main competitors of Tunisia ... 5
3 THE QUANTITATIVE FRAMEWORK ... 7
3.1 A Dynamic general equilibrium model of the Tunisian Economy... 7
3.1.1 Consumption... 7
3.1.2 Investment behavior... 7
3.1.3 Debt evolution ... 8
3.1.4 Terminal period and steady state conditions... 8
3.2 Structure of the intra-period model ... 9
3.2.1 The labor market block: a multisectoral model of efficiency wages ... 9
3.2.2 The production and factor demand block ... 10
3.2.3 Income and expenditure block ... 11
3.2.4 The foreign trade block... 11
3.3 The database ... 12
3.4 The dynamic calibration procedure ... 12
4 SIMULATIONS AND RESULTS... 13
4.1 The scenarios ... 13
4.2 The results... 13
5 CONCLUSION... 17
REFERENCES ... 18
List of tables
Table 1 : Changes in the Value of Exports of textile and clothing to the EU ... 5Table 2: Value of some key parameters of the dynamic model... 12
Table 3: Evolution of the main variables characterizing the apparel sector in Tunisia, 2006-2020 (change in % of the reference scenario level) ... 13
List of figures
Figure 1 : Degree of competition (measured by the Cos Cos indicator) in 2003... 6Figure 2: Evolution of unemployment in scenario 1 (2006-2020)... 14
Figure 3 : Evolution of unemployment in scenario 2 (2006-2020)... 14
Figure 4 : Evolution of the ratio WFs/WFuns... 15
Figure 5 : Evolution of the ratio WFhs/WFs... 15
Figure 6 : Evolution of total investment (volume)... 16
Figure 7 : Evolution of investment in some sectors in Scenario 2 (volume)... 16
1
INTRODUCTIONThe 1st January 2005 all the quotas on textile and clothing from WTO member countries were theoretically dismantled, according to the Agreement on Textile and Clothing (ATC) signed in 1995. This day which was supposed to be celebrated by all “pro-development trade” promoters as a victory has finally probably been celebrated only in China, India and in a few other efficient suppliers who have lower wage costs and/or integrated supply chains (eg. Turkey). According to Bhattacharya and Elliott (2005) the main losers will be least developed countries who have neither the infrastructure to deliver high quality apparel products, nor the geographic proximity some regional exporters take advantage of. Countries that took advantage of preferences, indirect protection through quotas and geographic proximity found themselves in a very critical situation (IFM and CEPII, 2005). If we want to assess if international trade is fair for all1, it is no longer enough to think of the interests of developing countries as a homogenous group, but we have to take into account their different situations. In this article we examine the Tunisian case as one of the main regional exporters to the EU before 2005.
The Multi-Fiber Agreement (MFA) through its quotas imposed on the most efficient exporters, and the privileged access of Tunisian clothing products to the European market were behind the spectacular development of the Tunisian apparel industry during the last twenty years. The weight of textile products in Tunisian exports of non-oil goods and services (58% in 2004, according to World Bank, 2006) and the concentration of clothing exports on the European market (94 %) explain why the issue of the MFA phase out is very sensitive economically and politically for Tunisian policymakers. A negative shock endured by the clothing sector could be harmful for the unemployment situation in Tunisia since this sector employs about 1/7th of the labor force. Unskilled workers and especially women who constitute the bulk of clothing employees (80% according to World Bank, 2006) are the most vulnerable.
Until early 2006, regional exporters (except Turkey) and among them Tunisia have seen their share in the European market reduced, but not by as much as some previous models have predicted2. The main reason is certainly the agreement of self restriction of Chinese exports signed between the EU and China in June 2005. China agreed to limit its exports because of the threat of the special textile specific safeguard clause which can be used by WTO member countries until December 2008. But what will happen the 1st January 2009? When tariffs on clothing imports will decrease due to WTO commitments the erosion of preferences for regional exporters will even be stronger.
Most of the studies which dealt with the impact of the MFA dismantling had a global or regional scope (see OCDE (2003) for a survey of the existing quantitative studies)). These have the advantage of giving a wide view of the situation, but do not allow the analysis of the impact on a particular country, which is the main concern for policy makers. More recently, Martin and al. (2004) use a global general equilibrium model, but focus their analysis on a country, Pakistan, which will benefit from the quota dismantling and suffer from a greater competition with China and India. Since our study is on Tunisia we prefer to rely on a single-country model, which allows us to enrich the model with institutional detail and introduce dynamics in its functioning.
Therefore, the quantitative assessment is based on an intertemporal multisectoral general equilibrium model of the Tunisian economy which incorporates imperfect labor markets functioning. As stressed by Stiglitz and Charlton (2005), to be able to analyze the impact of trade reforms and especially adjustment costs, models need to take into account unemployment and market failures. The model developed in this paper allows formalizing the adjustment path by dealing explicitly with intertemporal optimization of firms. The presence of an adjustment costs function permits to formalize the installation costs linked to the process of capital accumulation. The model also incorporates the
1 “Fair trade for all” is the title of the recent book of Stiglitz and Charlton (2005) advocating for an alternative “pro-development”
international trade negotiations agenda.
intertemporal preferences of households, which allows capturing demand side effects of the trade shock. In addition, disaggregating the economy into industries allows for explicit dynamic analysis of the intersectoral reallocation of resources that is central to the policy debate.
One of the main innovations of the dynamic general equilibrium model developed is that it uses a non steady-state calibration procedure. As stressed by Francois, Nordstrom and Shiells (1999), empirical studies showed that considering developing countries in applied models as growing on a steady-state path is an invalid hypothesis.
Moreover, since we focus on the effects of the MFA dismantling on unemployment, a significant part of the modeling effort is devoted to the labor market. Thus, intersectoral wage differentials for workers of the same category are endogenous, and explained by efficiency considerations. We propose a multisectoral model of efficiency wages based on imperfect monitoring considerations following the work of Shapiro and Stiglitz (1984) and Walsh (1999).
The article is organized as follows: section two presents the outcome observed so far, section three deals with the quantitative framework, section four presents the simulations and the results and section five concludes.
2
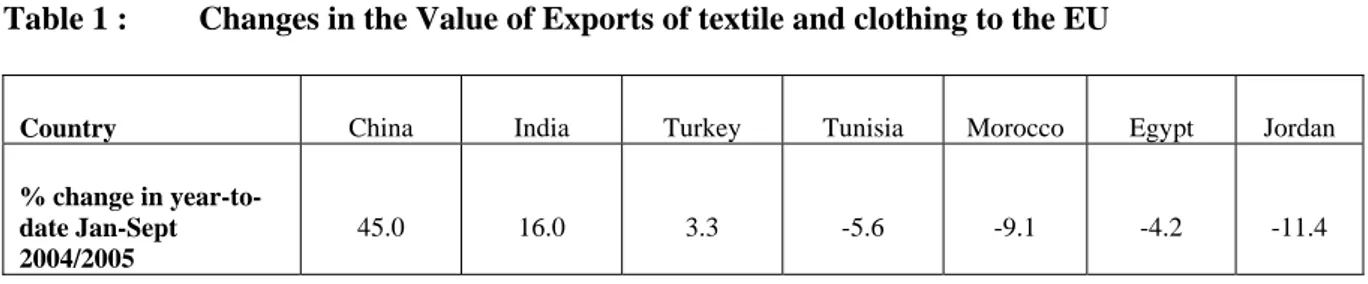
WHAT HAPPENED SINCE THE 1st JANUARY 2005The first half of 2005 has seen a surge of Chinese exports to the EU (by 45% in value terms). China increased its market share by 145% in volume and 95% in value for products which quotas have been removed in 2005 (European Commission, 2005). This increase has been at the expense of the main regional exporters (see table 1). However safeguard measures can only be used if importing countries are affected and not competitors even if the EU has stated in its guidelines for consideration of safeguards against China that the East and South Mediterranean Countries “are part of the natural zone of competitiveness of the EU textile and clothing industry and are an important destination of both exports and investments of EU industry”. The European Textile Association started complaining very early, but its position was weakened by three elements. First, China is a significant trading partner and a big market for European products. Second, many European countries do not produce apparel and were thus against imposing any restriction on Chinese imports to avoid trade disputes with China. Third, distributors inside Europe prefer having access to cheaper Chinese products and some of them had already launched significant orders when the EU and China started negotiating an agreement of self limitation of exports. An agreement was finally reached the 10th of June 2005, which manages Chinese apparel exports to the EU until end 2007. The agreement imposed on ten categories of products (among 35 liberalized) fixes the rates of growth of Chinese exports between 8 and 12.5%, which is higher than the 7.5% which the special safeguard clause would have allowed the EU to impose (EU, 2005).
Table 1 : Changes in the Value of Exports of textile and clothing to the EU
Country China India Turkey Tunisia Morocco Egypt Jordan
% change in year-to-date Jan-Sept 2004/2005
45.0 16.0 3.3 -5.6 -9.1 -4.2 -11.4
Source: The World Bank (2006)
2.1 The main competitors of Tunisia
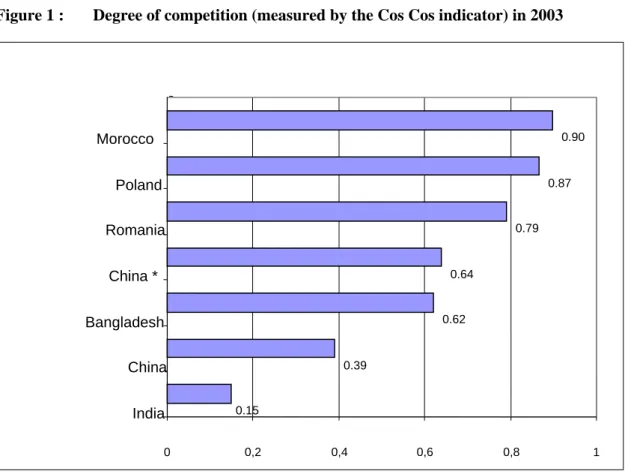
To be able to assess qualitatively the intensity of competition between Tunisia and its main competitors on the European market, Cling Chaponnière and Marouani (2005) have compared the structure of their exports to the EU. For that purpose they disaggregated apparel exports in 236 categories (six digit nomenclature). The degree of competition between two countries is assessed
through the cosine of the angle of the 236 dimensions vectors which represent the structure of clothing exports of each country.
Morocco, Poland and Romania seem to be the main competitors of Tunisia (figure 1). Using the Export Similarity Index calculated on the basis of 2004 data, the World Bank (2006) confirms that ECEC (Bulgaria and Romania) and Morocco are the closest competitors to Tunisia. In the case of China, the quotas have been highly binding, so their structure of exports based on 2003 figures is not very relevant. To avoid this problem, the authors have used the structure of China’s exports to Japan which did not impose quotas on China. The new indice is called China*.
Figure 1 : Degree of competition (measured by the Cos Cos indicator) in 2003
Source : Eurostat
∑ ∑
∑
=
k k jk ik jk k ik ijE
E
E
E
Cos
2 2*
*
Even if the previous analysis shows that Tunisia and China do not necessarily produce the same categories of apparel products, the impact of Chinese competition will be stronger after 2008 when the EU will not be able to use anymore the special textile safeguard clause. We thus will have to distinguish two periods in the simulations. A 2005-2008 period where Chinese exports increase according to an agreed rate with the EU, and an after 2008 where these products will have an unlimited access to the European market.
It is thus necessary to elaborate an ex ante assessment framework which allows the simulation of various scenarios for the post 2008 period.
0.15 0.39 0.62 0.64 0.79 0.87 0.90 0 0,2 0,4 0,6 0,8 1 India China Bangladesh China * Romania Poland Morocco
3
THE QUANTITATIVE FRAMEWORK3.1 A Dynamic general equilibrium model of the Tunisian Economy
In this section we present the intertemporal general equilibrium model of the Tunisian Economy. The model built for this purpose draws upon the work of Go (1994), Devarajan and Go (1998) and Dissou (2002). Its main differences consist in its detailed and innovative treatment of the labor market and its non-steady state calibration procedure.
In presenting the model we will first describe its dynamic dimension, which is intended to capture the intertemporal allocation of investment and consumption, and then the intra-period dimension, which is equivalent to a one-year static CGE model.
3.1.1 Consumption
Households allocate expenditure across time so as to maximize lifetime utility subject to a dynamic budget constraint. Devarajan and Go (1998) derive3 the forward change of consumption between two successive periods as a function of the relative prices of the two periods, the rate of time preference, and the discount rate for consumption:
)
1
(
)
1
(
1 1 1 v c t t t tr
PC
PC
C
C
+ + −⎟⎟
⎠
⎞
⎜⎜
⎝
⎛
+
+
=
ρ
(1)where ρ is the consumer’s constant rate of time preference, ν is the constant elasticity of marginal utility, rc the discount rate and Ct is aggregated consumption.
3.1.2 Investment behavior
Unlike static CGE models where investment is savings driven, the investment decision in dynamic models follows a forward looking optimization rule. The manager chooses the investment path that maximizes the firm’s value, defined as the discounted value of net income, subject to the capital accumulation equation. Investment expenditures (INVCOST) include both acquisition and adjustment costs. Investment expenditures in our model are given by:
)
)
1
(
(
ti i ti ti i tID
dist
AJC
PK
INVCOST
=
−
+
(2)Where ID represents sectoral investment, AJC are adjustment costs, PK is the price of capital, and dist is a parameter which captures the existence of distortions or incentives to investment. The adjustment cost function is increasing with investment and decreasing with the capital stock (K) accumulated by the firm:
2
2 i t i t i i tK
ID
AJC
=
β
(3)The intertemporal optimal conditions imply that:
) 1 ( ⎟⎟ ⎠ ⎞ ⎜⎜ ⎝ ⎛ − − = i i t i t i i t i t dist PK q K ID
β
(4)and 2 ) 1 ( ) 1 ( 2 1 i t i t i t i i t i t i i t i p PK K ID RK q q r ⎟⎟ ⎠ ⎞ ⎜⎜ ⎝ ⎛ + + − = +
δ
+β
(5)where q is the shadow price of capital, rp is the discount rate of the producer in sector i, δ is the depreciation rate, and RK is the marginal revenue product of capital. The interpretation of equation (4) is that investment will be positive if the ratio of tobin’s q to the replacement cost of capital is greater than one. Equation (5) gives the dynamic rule of growth of the shadow price of capital.
3.1.3 Debt evolution
Following Diao, Roe and Yeldan (1998), the two components of public debt (internal and external) and the two components of external debt (private and public) are modeled. However, yearly public deficit is allocated to the two components of public debt (in fixed proportions), whereas the authors allocate it exclusively to public external debt.
t t
t
DEBTP
DEBTGE
DEBT
=
+
(6)where DEBT is the stock of total external debt, DEBTP is private external debt and DEBTG public external debt.
t t
t
DEBTP
BCDEF
DEBTP
+1=
+
(7)where BCDEF is the current account balance net of foreign direct investments.
t t
t
DEBTGE
shrdebtg
GOVSAV
DEBTGE
+1=
−
(
1
−
)
*
(8)where shrdebtg is the share of internal debt in total public debt and GOVSAV corresponds to the public deficit in year t.
Total public debt DEBTG is composed of internal debt, DEBTGI and external public debt, DEBTGE:
t t t
DEBTGE
DEBTGI
DEBTG
=
+
(9) withshrdebtg
GOVSAV
DEBTGI
DEBTGI
t+1=
t−
t*
(10)The stock of foreign private capital in Tunisia (CAPEX) grows every year through the arrival of foreign direct investment (IDE).
t t
t
CAPEX
IDE
CAPEX
+1=
+
(11)This stock of capital is rewarded the average rate of return of investment in Tunisia. 3.1.4 Terminal period and steady state conditions
To solve an infinite-horizon model like ours, we need to truncate the time horizon by imposing steady-state conditions at some future terminal period. Devarajan and Go (1998) have found forty years to be a reasonable time-horizon.
On the capital growth side, the required condition is that the ratio of investment to the stock of capital equals the depreciation of capital plus the exogenous growth rate of the labor force (g) and the growth rate of technical progress (prt):
) ( ) ( /K g t prt t IDtpi tpi =
δ
i + + (12)On the consumption growth side, the transversality condition imposes that consumption at the terminal period is equal to the household income (YH) net of investment expenditures financed by households:
)
(
tp tp i i tp tp tptp
CT
YH
INVCOST
FSAV
GOVSAV
PCT
=
−
∑
−
−
(13)FSAV are foreign savings and GOVSAV corresponds to the Government surplus or deficit.
A transversality condition is also imposed on foreign debt to avoid ponzi games. The growth rate of external debt is the same as that of capital:
)
(
p
)
(
/
DEBTP
g
t
rt
t
BPDEF
t t=
+
(14)Many variables (not described above) grow at an exogenous rate, imposed by the modeler on the basis of their historical evolution (migrants’ remittances, foreign direct investment) or their forecasted evolution (labor force, technical progress).
Having described the dynamics of growth of the jumping variables, we now turn to describe the intratemporal dimension of the model.
3.2 Structure of the intra-period model
The Tunisian Economy is disaggregated into ten sectors. The model distinguishes four inputs: three categories of labor and capital, and four types of agents: a representative household, firms, the Government and the Rest of the World.
3.2.1 The labor market block: a multisectoral model of efficiency wages
In the eighties, various models called “efficiency wage models” have been developed to explain the intersectoral wage differentials observed and the existence of involuntary unemplyment. They are based on the principle stipulating that the productivity of a worker depends on his wage (Akerlof (1982), Shapiro and Stiglitz (1984) and Bulow and Summers (1986)). This means that in order to elicit effort from their workers, employers may find it optimal to pay more than the going wage.
The efficiency wage theory provides an alternative analytical framework to the standard model describing the labor market as perfectly competitive, free of information problems, and where firms face perfectly elastic labor supply (Summers, 1988). The main interest of the different efficiency wage models is that they explain involuntary unemployment while allowing at the same time for an endogenous determination of wages (Cahuc and Zylberberg, 1996). Their aim is to study the microeconomic foundations explaining why a firm facing an adverse shock chooses to fire workers rather than reducing wages (Summers, 1988).
Among the different models of efficiency wages, we will focus on the model based on the imperfect monitoring of the workers’ effort by the firm, developed by Shapiro and Stiglitz in their seminal paper: “Unemployment as a Worker Discipline Device” (1984).
In the Shapiro and Stiglitz model, the involuntary unemployment level acts as an incentive for workers to provide a certain level of effort4. This is equivalent to a principal-agent problem with rationing at equilibrium, since some individuals proposing to work at a lower wage will not be hired. Indeed, by giving them less than the efficiency wage, the firm would not be sure that they will not shirk.
The utility function of the employees is increasing with wages and decreasing with the level of effort they provide. In its simplest form it could be expressed as: U = w – e. The effort variable e takes two values, 0 if the worker shirks and e*>0 otherwise. If he shirks, there is a probability q that he be caught and fired. If he provides the level of effort required, the probability of loosing his job reduces to b, the exogenous separation rate.
To summarize the functioning of this model, we can say that level of unemployment and of wages are complementary to elicit effort from employees. Indeed, if the level of unemployment is low, loosing a job will not be very constraining since it is easy to find another one. Likewise, loosing a badly-paid job will not cause a big loss in utility.
The principal contribution on efficiency wages in a general equilibrium framework is the work of Thierfelder and Shiells (1997). On multisectoral models of efficiency wages, we can cite mainly the article of Walsh (1999).
If we rewrite the utility functions defined by Shapiro and Stiglitz (1984) in a multisectoral framework and disaggregate the labor factor in various skills of qualification, we obtain:
) ( ifns u f if if if ns if w e b V V rV = − + − (15)
for a non shirker (ns), and,
) )( ( ifs u f if if if s if w b q V V rV = + + − (16)
for a shirker (s), and,
) ( 1 u jf jf f n j u f a V V rV =
∑
− = 5 (16)for an unemployed (u),
where r is the discount rate, V the utility function, i the sector, f the level of qualification, w is the wage, e is the disutility of effort, b is the exogenous separation rate, q is the probability of being caught shirking and a the probability for an unemployed worker to find a job.
After some algebraic derivations we obtain the expression characterizing the evolution of wages in the multisectoral general equilibrium model applied to Tunisia.
1 1 ∑ = + ⎟⎟ ⎟ ⎠ ⎞ ⎜⎜ ⎜ ⎝ ⎛ + + = ∗ n j jf e f U jf q jf L jf b if e if q r if b if w (17)
3.2.2 The production and factor demand block
The production function is a nested one which permits to capture the substitution and complement relations among the various inputs. At the highest level, output is a Leontief of value added and intermediate input. Aggregate intermediate input is a Leontief function of intermediate input from
4 The term effort is used here in its broadest meaning.
different sectors, whereas value added (VA) is a nested Constant Elasticity of Substitution (CES) function with two stages. At the first stage, VA is a CES of two composite bundles. At the second stage, the first bundle is a CES function of unskilled and skilled labor whereas the second bundle is a CES of capital and highly skilled labor, which are supposed to be highly complementary. Concerning the Government sector, capital and the three labor categories are set in fixed proportions.
The three categories of workers are supposed to be mobile across sectors, but the workers are not allowed to look for a job requiring more or less qualifications then they have. The wages and the unemployment level at equilibrium are obtained through the equalization of the marginal productivity of labor with the efficiency wage in all but two sectors. In the agricultural sector the wage is linked to the average urban wage through an extended Harris-Todaro function6 capturing the difficulty of getting an urban job for a rural worker. Concerning civil servants, we suppose that the Government set their wages as a fixed proportion of the urban average wage. Labor supply increases from one period to another at a fixed rate. Physical capital is sector-specific in the short run. It grows from one period to another through investment, following the path defined by the intertemporal optimization rule. 3.2.3 Income and expenditure block
Households earn their income from wages, returns to capital, interests on Government bonds and transfers (public or migrants’ remittances). Their expenditures are composed of interest payments on private external debt and of consumption of goods and services. After determining the optimal path of total consumption and savings (equation 1), households choose the optimal composition of their basket of goods and services at each period. Total consumption is a Cobb-Douglas function of different consumption commodities.
The Government earns income from various taxes (income taxes, corporate taxes, tariffs and value added taxes) and from foreign transfers. Its expenditures consist in Government consumption (mainly civil servants wages), social transfers and interest payments on public debt. The Government closure chosen is to allow public spending to grow at the GDP growth rate, which seems more realistic than fixing total spending or the nominal value of deficit. In the simulations where taxes will be endogenized to compensate for tariff losses, the ratio of public deficit to GDP is also fixed.
3.2.4 The foreign trade block
The allocation of output between domestic and foreign markets is modeled as a Constant Elasticity of Transformation (CET) function. On the demand side, the Armington assumption is adopted to describe imperfect substitution between domestic products and imports, and between imports originating from different geographical areas. At the first stage, a composite product results from a CES aggregation of domestic and imported commodities. At the second stage, total imports are disaggregated into imports from the EU and from the Rest of the World, which permits to simulate the reduction of tariffs on products originating from the EU. The small country assumption holds for imports, which implies that world import prices are exogenous. However, an export demand function is modeled according to Decaluwé, Martens and Savard (2001):
i i i i i
PWE
PED
EXDP
EXD
η⎟⎟
⎠
⎞
⎜⎜
⎝
⎛
=
(18)where EXD is the demand for export of product i, EXDP is a sectoral scale parameter, PED is the sectoral price of Tunisian exports, PWE the world price of the same products and η the elasticity of demand of exports.
The existence of an export demand function means that Tunisian exporters need to lower their prices if they want to increase the volume of their exports (for an unchanged quality of products).
6 The extension in The Harris-Todaro function consists in adding an elasticity of mobility for rural workers, calibrated from the base year
The current account balance is composed of the foreign trade balance, of net transfers from abroad and of interest payments on foreign debt. The ratio of external debt to GDP is fixed to its first year level, and the nominal exchange rate adjusts to equilibrate the current account balance.
3.3 The database
The model is calibrated from a 1994 database for the Tunisian economy. The advantage of using 1994 data is to be able to perform a dynamic calibration of the model by comparing the path of evolution of the main variables produced by the model with the actual path observed in the national accounts (1994-2002). The social accounting matrix (SAM) has been built on the basis of the Input-Output table provided by the Tunisian National Institute of Statistics. Aggregate investment by sector is provided in the national accounts (INS, 1997). Information on the different components of private and external debts and on transfers comes from the annual Central Bank report (BCT, 1995). The data on employment and labor supply are from the population and employment census. Wage differentials by level of qualification in each sector are determined using tables appended to industrial collective agreements.
Calibration of the model involves selecting certain parameters from external sources (from the literature or fixed a priori) and deriving the remainder from identifying restrictions (Goulder and Eichengreen, 1992).
The elasticities of substitution and transformation of the CES and CET functions of the trade block come from the econometric estimations of Devarajan, Go and Li (1999). Derivation of the scale and share parameters of these functions follows the usual procedure. The interest rates are those practiced by the Tunisian Central Bank.
The disutility of effort parameter of the efficiency wages function is calibrated using the base year values of wages, employment, unemployment, the turnover rate and the probability of being detected shirking. The elasticity of mobility of rural workers in the Harris-Todaro function is calibrated from the benchmark data on agricultural and urban (average) wages, on employment in agricultural and non agricultural sectors, and on urban unemployment.
The depreciation rate of capital, the household elasticity of intertemporal substitution of consumption and the sectoral adjustment cost function scale parameters are calibrated following a tâtonnement process described in the next section.
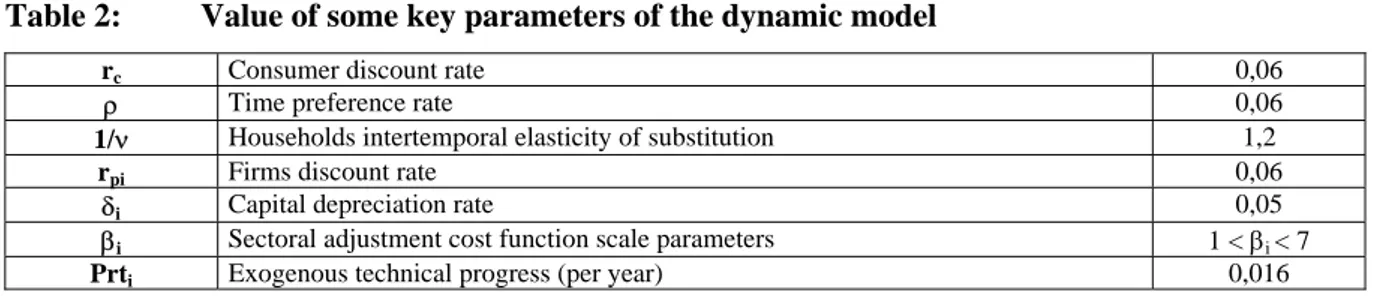
Table 2: Value of some key parameters of the dynamic model
rc Consumer discount rate 0,06
ρ Time preference rate 0,06
1/ν Households intertemporal elasticity of substitution 1,2
rpi Firms discount rate 0,06
δi Capital depreciation rate 0,05
βi Sectoral adjustment cost function scale parameters 1 < βi < 7
Prti Exogenous technical progress (per year) 0,016
3.4 The dynamic calibration procedure
Most of the existing dynamic general equilibrium models rely on a steady-state calibration procedure (Wendner, 1999). It has the advantage of being relatively simple since it consists in manipulating the data to impose a steady-state growth of the jumping variables. However, it relies on a false hypothesis, especially in developing and transition countries (Francois, Nordstrom and Shiells, 1999). The procedure used in this model consists in implementing a dynamic calibration in three steps.
First we calibrate the parameters which determine the evolution of the main macroeconomic variables (total household consumption, total investment, the external debt and the GDP growth rate). These parameters are the elasticity of intertemporal substitution of consumption, the capital depreciation rate and the annual growth rate of technical progress. They are calibrated by implementing many
simulations until the main macroeconomic variables are close to their actual value during the 1994-2001 period.
The second step consists in calibrating sectoral parameters, and mainly the adjustment cost function scale parameter. In this case we use the historical evolution of sectoral investment to obtain the value of the parameters. In some cases the value of the stock of capital has been slightly modified to obtain reasonable values.
The third step consists in recalibrating the macro parameters to take into account the impact of the second step modifications. After several iterations we obtain relatively satisfactory values for macro and sectoral parameters.
4
SIMULATIONS AND RESULTS4.1 The scenarios
The reference scenario includes the tariff dismantlement on imports from the EU, according to the Euro-Tunisian Free Trade Agreement7. It also includes a compensation of the fiscal losses due to the tariff dismantling by a uniform increase of the different taxes (VAT, income tax and corporate tax). Two shocks are simulated to analyze the impact of the MFA phase out on the apparel sector, on unemployment and on other relevant variables in Tunisia. The idea is that the export demand addressed to Tunisian firms from the EU can decrease, but also prices, due to higher competition. In the first scenario we simulate a decrease of volumes (the implicit hypothesis being that Tunisia moves to a higher segment of products and sells at higher prices). In the second we assume that both volumes and prices could decrease due to the end of the special safeguard measures in 2009.
1. The first scenario consists in implementing a gradual decrease of export demand from 2002 to 2004 (10% in three years), than a decrease by 10% in 2005 and a decrease by 20% in 2009.
2. The second scenario adds to the first one a decrease of world prices of apparel products by 10% in 20098. We do not simulate a price decrease between 2005 and 2008 because it seems that the
agreement between the EU and China has limited the impact on world prices of apparel products.
4.2 The results
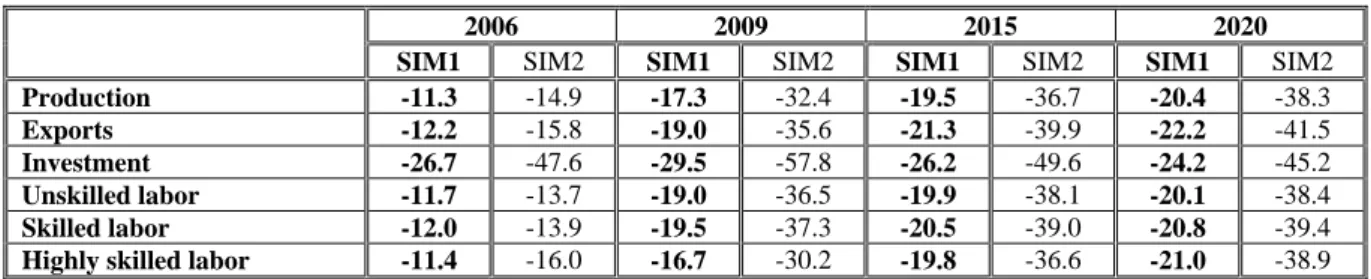
Table 3: Evolution of the main variables characterizing the apparel sector in Tunisia, 2006-2020 (change in % of the reference scenario level9)
2006 2009 2015 2020
SIM1 SIM2 SIM1 SIM2 SIM1 SIM2 SIM1 SIM2
Production -11.3 -14.9 -17.3 -32.4 -19.5 -36.7 -20.4 -38.3
Exports -12.2 -15.8 -19.0 -35.6 -21.3 -39.9 -22.2 -41.5
Investment -26.7 -47.6 -29.5 -57.8 -26.2 -49.6 -24.2 -45.2
Unskilled labor -11.7 -13.7 -19.0 -36.5 -19.9 -38.1 -20.1 -38.4
Skilled labor -12.0 -13.9 -19.5 -37.3 -20.5 -39.0 -20.8 -39.4
Highly skilled labor -11.4 -16.0 -16.7 -30.2 -19.8 -36.6 -21.0 -38.9
As shown by table 3, the decrease of the world prices of textile products is very harmful for the Tunisian textile and clothing sector. Investment is the first variable that reacts strongly to the shock, due to the forward looking behavior of firms in terms of capital accumulation. The results of the second scenario are much stronger because the combined effects of export demand and prices
7 The tariff dismantling scenario is implemented at a very disaggregated level, than we aggregate at the sectoral level.
8 The magnitude of world prices decrease is totally counterfactual. We would need a global CGE model to simulate the impact of Chinese
decreases. The less competitive firms and those who can not move to a higher segment of the apparel industry will be forced to exit the market.
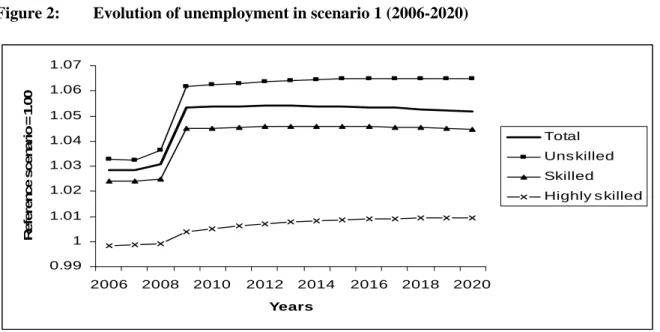
Labor demand decreases dramatically from 2009 and does not recover afterwards. These negative effects on the textile sector were expected due to the nature of the shock. What is less obvious is to which extent this shock is transmitted to the rest of the economy and its effects on unemployment. The first shock induces a rise in total unemployment, which harms mainly unskilled workers, due to the labor composition of the textile and clothing sector (figure 1). After a dramatic increase in 2009, total unemployment decreases slightly due to the evolution of the labor force in Tunisia where the share of unskilled workers decreases over time.
Figure 2: Evolution of unemployment in scenario 1 (2006-2020)
0.99 1 1.01 1.02 1.03 1.04 1.05 1.06 1.07 2006 2008 2010 2012 2014 2016 2018 2020 Years R e fe re n c e sc en ar io = 1. 0 0 Total Uns killed Skilled Highly s killed
In the second scenario the rise of unemployment is much stronger (by about 10%, which represents 1.5 point of percentage given a 15% unemployment rate in Tunisia). For unskilled workers, the number of unemployed in 2009 is about 12% higher than would have been the case without the quotas removal.
Figure 3 : Evolution of unemployment in scenario 2 (2006-2020)
0.99 1 1.01 1.02 1.03 1.04 1.05 1.06 1.07 1.08 1.09 1.1 1.11 1.12 1.13 1.14 2006 2008 2010 2012 2014 2016 2018 2020 Years R e fe re n c e sc en ar io = 1. 0 0 Total Unskilled Skilled Highly skilled
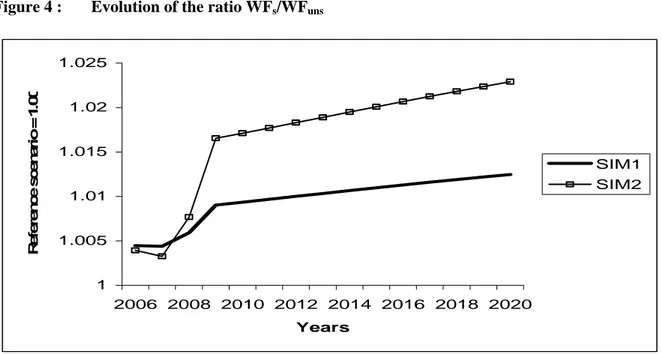
Wage inequality between skilled and unskilled also increases after 2008 (figure 4), due to the high intensity of the textile and clothing sector in unskilled labor. The pace of the rise of inequality decreases after 2009 but remains high.
Figure 4 : Evolution of the ratio WFs/WFuns
1 1.005 1.01 1.015 1.02 1.025 2006 2008 2010 2012 2014 2016 2018 2020 Years R e fe re n ce scen a ri o = 1. 0 0 SIM1 SIM2
Inequality between skilled and highly skilled wages also increases in the two scenarios until 2009, but remains stable after 2009 (figure 5).
Figure 5 : Evolution of the ratio WFhs/WFs
1 1.005 1.01 1.015 1.02 1.025 2006 2008 2010 2012 2014 2016 2018 2020 Years R e fe re n ce scen ar io = 1. 0 0 SIM1 SIM2
To understand the evolution of unemployment, we need to look at the evolution of investment, which is the main vector of change in a dynamic model.
Figure 6 : Evolution of total investment (volume) 0.99 1 1.01 1.02 1.03 1.04 2006 2008 2010 2012 2014 2016 2018 2020 Years R ef er en ce scen ar io = 1. 0 0 SIM1 SIM2
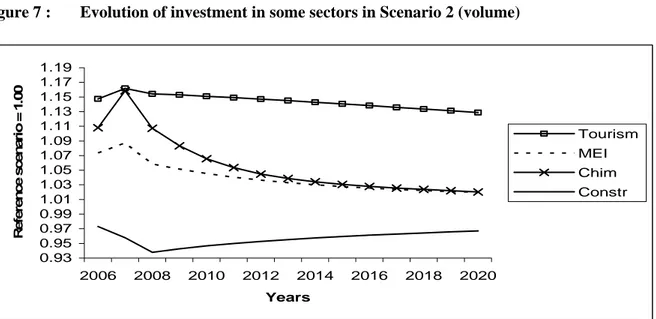
Total investment is higher than its reference scenario level until 2008, than it decreases to around its base scenario level. This increase of investment is due to the depreciation of the Tunisian Dinar induced by the decrease of apparel exports10, which exerts a positive effect on the exports of other sectors, mainly tourism and mechanical and electrical industries. As the apparel sector in Tunisia is highly labor intensive, the dramatic decrease of investment in this sector does not have a significant impact on total investment.
Figure 7 : Evolution of investment in some sectors in Scenario 2 (volume)
0.93 0.95 0.97 0.99 1.01 1.03 1.05 1.07 1.09 1.11 1.13 1.15 1.17 1.19 2006 2008 2010 2012 2014 2016 2018 2020 Years R e fe re n ce scen ar io = 1 .00 Tourism MEI Chim Constr
Figure 7 shows the evolution of investment of four significant sectors. We can see that investment increases in all except the construction sector who bears the cost of the decline of the apparel industry investments (table 2).
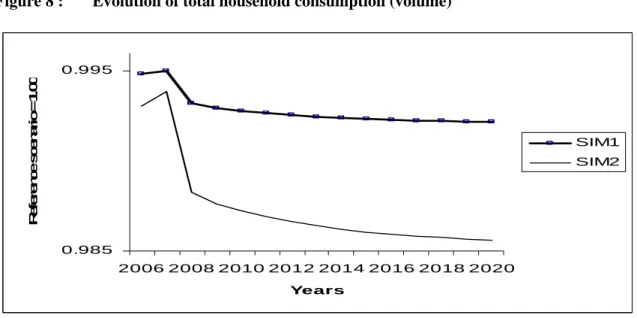
Let us now look at the evolution of total household consumption. It decreases slightly in scenario 1 and more in scenario 2, but the decrease does not reach 1.5% in the worst case (figure 8). This decrease is due to higher unemployment, which has a negative impact on households’ income.
When we look at the potential impact on GDP, in the worst case (second scenario, after 2009), the losses do not go beyond 0.5%. However, it is important to note that these figures are the outcome of
the simulated export demand and prices decreases. If prices decrease by more than 10% after 2009, the effects could be stronger.
Figure 8 : Evolution of total household consumption (volume)
0.985 0.995 2006 2008 2010 2012 2014 2016 2018 2020 Years R ef er en ce scen ar io = 1 .0 0 SIM1 SIM2
5
CONCLUSIONAs expected, the MFA phase out appears as a very negative shock for the textile and clothing sector and for unemployment which is already high in Tunisia. It also raises wage inequality due to the high intensity of the textile and clothing sector in unskilled labor.
To be able to analyze more in detail the effects of the MFA dismantling we would need disaggregated data on the textile and clothing industry. As shown by Martin and al. (2004), the real effects will depend on the degree of substitutability between each country’s exports and those of its competitors. If the structure of exports of Tunisia and the most competitive countries (mainly China) remain different (as shown by the export similarity index) Tunisia could be less affected by the MFA phase out and the end of the special textile safeguard clause. Since the Tunisian textile and clothing sector is mainly constituted by European offshore companies, the amplitude of the shock will also depend on the capacity of these companies to switch to the highest segment of the clothing sector. Indeed, the comparison of the two simulations shows clearly that even if the European export demand decreases, when export prices remain stable (or increase), the negative impact of the shock is much more limited. Moreover, the negative effects on the main macroeconomic variables (investment, consumption and GDP) are very limited due to the hypothesis of a depreciation of the Tunisian Dinar which exerts a positive effect on the other main exporting sectors. This puts a higher pressure on the Tunisian Central Bank which manages the exchange rate to be very reactive to the evolution of clothing exports.
One of the limits of the model used in this article is that it does not take into account heterogeneity since it is a representative agent one. It would be interesting to link the CGE model to a microsimulation model to be able to analyze the effects of the shock on individual firms and households11. Another issue raised at the beginning of the article is the gender dimension of the shock. Indeed, the textile and clothing sector relies mainly on female labor, which will consequently be the most affected by the MFA dismantling. If data were available it would be very interesting to study the impact of this shock on women’s employment and income12.
11 See Bourguignon, Robilliard et Robinson (2003) for microsimulation models in a CGE framework with heterogeneous households and
Van Tongeren (1995) for heterogeneous firms.
REFERENCES
Akerlof G. (1982), “Labor contracts as partial gift exchange”, Quarterly Journal of Economics, 87, p. 543-569.
BCT (1995), “Rapport annuel 1994”, Tunis: Banque Centrale de Tunisie.
Bourguignon F., Robilliard A.S. et Robinson S. (2003), « Representative versus Real Households in the Macro-economic Modeling of Inequality », DELTA Working N° 2003-05, Paris.
Bulow J.I. and Summers L.H. (1986), “A Theory of Dual Labor Markets with Application to Industrial Policy, Discrimination, and Keynesian Unemployment.” Journal of Labor Economics 4, p. 376-414.
Cahuc P. and Zylberberg, A. (1996), “Les salaires d'efficience.”, Economie du travail, De Boeck Université, p. 179-225.
Cling JP., Chaponniere JR. and Marouani MA. (2005), « Les conséquences pour les PED du démantèlement de l’AMF : le cas de la Tunisie », Revue française d’économie, october, vol. XX, pp. 151-196.
Decaluwé B., Martens A., and Savard L. (2001), La politique économique du développement et les
modèles d'équilibre général calculables, Montréal: Les Presses de L'Université de Montréal.
Devarajan S. and Go D.S. (1998), “The Simplest Dynamic General-Equilibrium Model of an Open Economy”, Journal of Policy Modeling, 20(6), pp. 677-714.
Devarajan S., Go D.S., and LI H. (1999), Quantifying the fiscal effects of trade reform: a general
equilibrium model estimated for 60 countries, Washington, D.C.: The World Bank.
Diao X., Roe T.L., and Yeldan A.E. (1998), “How Fiscal Mis-Management May Impede Trade Reform: Lessons from an Intertemporal, Multi-Sector General Equilibrium Model for Turkey”, Economic Development Center Bulletin N 98-1, Minneapolis: University of Minnesota.
Dissou Y. (2002), “Dynamic effects in Senegal of the regional trade agreement among UEMOA countries”, Review of International Economics, 10(1), pp. 177-99.
European Commission (2005) “Evolution of EU textile imports from China 2004-2005”, mimeo. Fontana, M. and Wood A. (2000), “Modeling the effects of trade on women at work and at home”,
World development, 28(7), pp. 1173-90.
François J.F., Nordstrom H., and Shiells R. (1999), “Transition dynamics and trade policy reform in developing countries”, in Dynamic issues in commercial policy analysis, J.F. François (ed.), Cambridge: Cambridge University Press, pp. 14-40.
Go D.S. (1994), "External shocks, adjustment policies and investment in a developing economy: Illustrations from a forward-looking CGE model of the Philippines", Journal of Development
Economics, 44, pp. 229-61.
Goulder L.H. and Eichengreen B. (1992), “Trade Liberalization in general equilibrium: intertemporal and inter-industry effects”, Canadian Journal of Economics, 25(2), pp. 253-80.
IFM and CEPII (2004), “Study on the Implications of the 2005 Trade Liberalization in the Textile and Clothing Sector”, European Commission, Brussels.
Institut d’Economie Quantitative (2003), « Impact du démantèlement de l'Accord Multifibre sur l'économie tunisienne », Les Cahiers de l'IEQ, 17, pp. 117-44.
INS (1997), Les comptes de la Nation: agrégats et tableaux d'ensemble 1992-1996, Tunis: Institut National de la Statistique.
Martin W., Manole V. and Van Den Mensbrugghe D. (2004), “Dealing with Diversity: Analyzing the Consequences of Textile Quota Abolition”, seventh annual conference on Global Economic Analysis, Washington D.C, June 17-19.
OCDE (2003), “Libéralisation du commerce dans les secteurs textiles et de l’habillement: examen des etudes quantitatives”, Groupe de travail du Comité des échanges, TD/TC/WP (2003)2/FINAL, Paris.
Shapiro C. and Stiglitz J.E. (1984), “Equilibrium Unemployment as a Worker Discipline Device”,
American Economic Review 74, p. 433-444.
Stiglitz J. and Charlton A. (2005), Fair Trade for All: how Trade can promote Development, New York: Oxford University Press.
Summers L.H. (1988), “Relative Wages, Efficiency Wages, and Keynesian Unemployment”,
American Economic Review 78, p. 383-388.
Van Tongeren, F.W. (1995), Microsimulation modeling of the corporate firm, New York: Springer. Walsh F. (1999), “A Multisector Model of Efficiency Wages.”, Journal of Labor Economics 17,
p.351-376.
Wendner R. (1999), "A Calibration Procedure of Dynamic CGE Models for Non-Steady State Situations using GEMPACK", Computational Economics, 13, pp. 265-87.
World Bank (2006), “Morocco, Tunisia, Egypt and Jordan after the end of the Multi-fiber Agreement: Challenges and Prospects”, mimeo.
![Risiko- & [und] Schutzfaktoren der psychischen Gesundheit humanitärer Einsatzhelfer : eine systematische Literaturübersicht](data:image/gif;base64,R0lGODlhAQABAIAAAP///wAAACH5BAEAAAAALAAAAAABAAEAAAICRAEAOw==)