HAL Id: tel-02513428
https://pastel.archives-ouvertes.fr/tel-02513428
Submitted on 20 Mar 2020HAL is a multi-disciplinary open access archive for the deposit and dissemination of sci-entific research documents, whether they are pub-lished or not. The documents may come from teaching and research institutions in France or abroad, or from public or private research centers.
L’archive ouverte pluridisciplinaire HAL, est destinée au dépôt et à la diffusion de documents scientifiques de niveau recherche, publiés ou non, émanant des établissements d’enseignement et de recherche français ou étrangers, des laboratoires publics ou privés.
communication impact of Paris resilience strategy
Rosa Vicari
To cite this version:
Rosa Vicari. Digital traces of climate risks : assessing the communication impact of Paris resilience strategy. Climatology. Université Paris-Est, 2018. English. �NNT : 2018PESC1168�. �tel-02513428�
This PhD thesis presents a research work that has been carried out at:
the Hydrology Meteorology and Complexity Laboratory of École des Ponts ParisTech
6-8 Avenue Blaise Pascal, Cité Descartes 77455 Marne-la-Vallée cedex 02 France hmco.enpc.fr
A
BSTRACT
C
limate pressures contribute to the complexity of urban systems that have mul-tiple functions and interacting components. The concept of resilience introduces a holistic approach, embracing both the physical environmental (PE) and the socio-economic (SE) components of cities. ‘Resilience thinking’ involves overcoming fragmentation in risk management, by creating synergies among stakeholders. It is a challenge that illustrates the importance of the ‘social construction of reality’: a specific dimension of the city that corresponds to the perceptions and attitudes of the urban community regarding an issue or solution.This thesis contributes to the current need to forge this link between the PE and SE components when studying climate-related risks in urban areas. More specifically, it attempts to answer the question: how can we analyse the role of communication in urban resilience?
With these premises in mind, the thesis proposes novel Resilience Communication Indicators (RCIs) that are a prerequisite to collecting meaningful data on stakeholders’ views that can affect urban resilience. We designed and tested RCIs to investigate the communication processes that occur in the context of Paris region and local climate resilience strategies.
A first series of experiments are based on research methods that are usually adopted by SIA (Social Impact Assessment) experts. These experiments (press coverage moni-toring and a questionnaire on an exhibition) were carried out in the framework of the communication strategy of Interreg NWE IVB RainGain (2012-2015), a European project on urban flood resilience.
Exploration techniques of unstructured big data (text mining and graph representa-tion) were used for a second set of experiments. Four corpora of texts were extracted from the Web (with Europresse and Twitter Advanced Search) and analysed (with Gargan-text, Gephi and Data Miner): tweets and press articles covering two major flood events in Paris (2016) and in Côte-d’Azur (2015); public authorities’ documents on flood risk management in the Paris region (2003-2017).
The press monitoring highlighted that the RainGain communication activities and iii
visitors’ results and the control group results and it provided an approximate indication of the impact of the exhibition in terms of information dissemination and the RainGain project acceptance.
The experiments based on text mining and graph representation highlighted that in the press and on Twitter the peak of publications per day is determined by the date of the highest river discharge. Paris flood had more media visibility than the Côte-d’Azur flood, even though the second flood caused a higher number of victims. The press described the damages caused by the floods in both regions, but in the case of Paris the debate on various levers for flood risk management was more detailed. The tweet analysis called attention to the minor discussion on flood risk management solutions, if we compare it to the debate on the press. It also brought out that the most popular users belong to the press and public administration sectors. As for the analysis of public authorities’ documents, it highlighted the recent emergence of the following themes: nature based solutions, integrated and multi–scale risk management, subsidiarity.
Both set of experiments showed that there can be correlations between a social factor and an environmental factor: indeed, we detected peaks in communication pro-cesses caused by meteorological events. The first series of experiments also proved that RainGain communication efforts resulted in a modest but positive effect on the respon-dents’ awareness and support for a resilience project. The results of the second series of experiments showed that the press and Twitter made a chronicle of immediate flood consequences. In the case of the press, the higher visibility of Paris is probably due to the higher newsworthiness of the events occurring in the French capital and to the extremely high economic risks related to a flood event in the Paris region. The results of the tweet analysis can be explained by the fact that Twitter is typically used as an early warning system (i.e. to disseminate factual information on the time and location of a flood) and that in case of emergency the press and public institutions are considered as official and reliable sources of information. As for the results of the last experiment, these indicate that there is a slow transition towards the resilience paradigm in public authorities’ strategies to cope with flood risk in Paris.
To conclude, this research enabled us to test relevant RCIs and analyse quanti-tative data on communication trends in the context of Paris region and local climate resilience strategies. The experiments showed that SIA techniques and big data explo-ration techniques complement each other. They also proved that interactions between communication processes and environmental processes can occur: detecting these cor-relations is the first step to integrate communication evaluation in a general urban resilience assessment.
We encountered experimental constraints that can be addressed with further research. For instance, some methodological limitations can be overcome by integrating SIA
techniques and big data exploration techniques. Most of the experiments were carried out in the Paris region, but can be easily implemented in other regions and with different time scales. We made an hypothesis on how the detected communication trends can affect urban resilience: this has to be validated by analysing potential correlations between communication trends and other resilience factors (e.g. the surface of regreened areas, the amount of insurance compensation, etc.) in the framework of a general resilience assessment.
Keywords: urban resilience, climate hazards, new media, resilience metrics, big data, graph representation.
R
ÉSUMÉ
L
es pressions climatiques contribuent à la complexité des systèmes urbains, qui sont dotés de multiples fonctions et composantes en interaction. Le concept de résilience introduit une approche holistique qui englobe les composantes physico-environnementales (PE) et les composantes socioéconomiques (SE) de la ville. L’approche de la résilience consiste à surmonter la fragmentation dans la gestion des risques, en créant des synergies entre les acteurs. C’est un défi qui souligne l’importance de la construction sociale de la réalité : une dimension spécifique de la ville, qui correspond aux perceptions et aux attitudes de la communauté urbaine vis-à-vis d’un problème ou d’une solution.Cette thèse contribue au besoin actuel de forger un lien entre les composantes PE et SE dans l’étude des risques urbains liés aux aléas du climat. En particulier, la thèse tente de répondre à la question suivante : comment analyser le rôle de la communication dans le développement de la résilience urbaine?
À partir de ces prémisses, cette thèse développe de nouveaux indicateurs de commu-nication. Ces indicateurs ont été conçus et testés en région parisienne pour étudier les processus de communication qui caractérisent les stratégies locales de résilience aux risques climatiques.
Une première série d’expériences est basée sur des méthodes de recherche habituelle-ment adoptées dans le domaine du SIA (Social Impact Assesshabituelle-ment). Ces expériences (veille médiatique et questionnaire sur une exposition) ont été réalisées dans le cadre de la stratégie de communication d’Interreg NWE IVB RainGain (2012-2015), un projet européen sur la résilience aux inondations urbaines.
Des techniques d’exploration de big data non structurés (text mining avancé et représentation de graphes) ont été utilisées pour une deuxième série d’expériences. Quatre corpus de textes ont été extraits du Web (avec Europresse et Twitter Advanced Search) et analysés (avec Gargantext, Gephi et Data Miner) : des tweets et des articles de presse sur deux graves inondations à Paris (2016) et en Côte d’Azur. (2015); des docu-ments institutionnels sur la gestion du risque de crue en région parisienne (2003-2017).
La veille médiatique a mis en évidence que les activités de communication du projet vii
un écart entre les résultats des visiteurs de l’exposition et les résultats du groupe de contrôle et a fourni une indication approximative de l’impact de l’exposition en termes de diffusion d’information et d’acceptation du projet RainGain. Les expériences basées sur le text mining et la représentation de graphes ont montré que, dans la presse écrite et sur Twitter, le pic de publications par jour est déterminé par la date du plus haut débit du fleuve. La crue de la Seine a eu plus de visibilité médiatique que les inondations en Côte d’Azur, même si ce deuxième évènement a fait plus de victimes. La presse a décrit les dégâts causés par les inondations dans les deux régions, mais dans le cas de Paris, il y a eu débat plus détaillé sur les divers leviers de la gestion des risques d’inondation. L’analyse de tweet a permis d’observer que le débat sur les solutions de gestion des risques d’inondation a été très limité sur Twitter, si on le compare au débat dans la presse. Il en ressort également que les usagers de Twitter les plus «liké» et «retweeté» ap-partiennent aux secteurs de la presse et de l’administration publique. Quant à l’analyse des documents institutionnels, cette dernière expérience a mis en évidence l’émergence récente des thématiques suivantes : «nature-based solutions», gestion intégrée et multi-échelle des risques, subsidiarité.
Les deux séries d’expériences ont montré qu’il peut exister des corrélations entre un facteur social et un facteur environnemental : en effet, nous avons détecté des pics dans les processus de communication causés par des évènements météorologiques. La pre-mière série d’expériences a également prouvé que les actions de communication autour de RainGain ont influencé de manière positive, mais modérée, la sensibilisation et le soutien des personnes interrogées vis-à-vis d’un projet de développement de la résilience. Les résultats de la deuxième série d’expériences ont montré que la presse et Twitter ont fait une chronique des conséquences immédiates des inondations. Dans le cas de la presse, la visibilité accordée à Paris est probablement due à un intérêt journalistique pour tous les évènements qui surviennent dans la capitale française et, également, aux pertes économiques extrêmement élevées que peut provoquer une inondation en région parisienne. Les résultats de l’analyse de tweet peuvent s’expliquer par le fait que Twitter est généralement utilisé comme système d’alerte précoce (c.-à-d. pour diffuser des infor-mations factuelles sur le moment et le lieu d’une inondation) et qu’en cas d’urgence, la presse et les institutions publiques sont considérées des sources d’information officielles et fiables. Quant à la dernière expérience, les résultats indiquent qu’une lente transi-tion vers le paradigme de la résilience caractérise les stratégies de gestransi-tion du risque d’inondation mise en place en région parisinne par les autorités territoriales.
En conclusion, cette recherche nous a permis de tester des indicateurs de tion pertinents et d’analyser des données quantitatives sur des processus de communica-tion dans le contexte de la région parisienne et des stratégies locales de résilience aux aléas du climat. Les expériences ont montré que les techniques SIA et les techniques d’exploration de big data se complètent. Ces expériences ont également prouvé que des interactions entre processus de communication et processus environnementaux
peu-vent se produire : la détection de ces corrélations est la première étape pour intégrer l’évaluation de la communication dans une évaluation générale de la résilience urbaine. Les expériences menées étaient soumises à un certain nombre de contraintes qui pourraient être résolues à l’avenir. Par exemple, certaines contraintes méthodologiques peuvent être évitées en intégrant les techniques SIA et les techniques d’exploration de données volumineuses. La plupart des expériences ont été réalisées en région parisienne, mais celle-ci pourraient être répétées dans d’autres régions et à différentes échelles de temps. Nous avons fait des hypothèses sur la manière dont les variables de com-munication pourraient influencer la résilience urbaine : ces hypothèses doivent être validées en analysant les corrélations potentielles entre les variables de communication et d’autres facteurs de résilience (par exemple, la surface des zones reverdies, le montant des indemnités d’assurance-dommages, etc.), dans le cadre d’une évaluation générale de la résilience.
Mots clés : résilience urbaine, aléas climatiques, nouveaux médias, indicateurs de résilience, big data, représentation de graphes.
A
CKNOWLEDGEMENTS
I
express my special appreciation and thanks to Professor Daniel Schertzer, who in a distant 2014 read a very incipient research proposal and believed enough in it to accept becoming my supervisors. Thank you for giving me this opportunity and for always encouraging me to try unconventional paths in my research work.Beside my advisors, I would like to thank the rest of my thesis committee: Profes-sor Roberto Grandi, ProfesProfes-sor Marie-Claire ten Veldhuis, ProfesProfes-sor David Chavalar-ias, Professor Dimitri Solomatine, Professor Massimiano Bucchi and Professor Ioulia Tchiguirinskaia. Thank you for your time in reviewing this thesis and for your valuable contributions.
I am very grateful to Veolia and the Interreg IVB NWE program for providing the funding for the work, without which this achievement wouldn’t be possible. Very special gratitude goes to Bruno Tisserand who, since the beginning, believed in this thesis, supported it and gave me helpful advice.
My sincere thanks to the staff of Institut des Systèmes Complexes Paris Ïle de France for giving me the opportunity to use Gargantext for a relevant part of the empirical work. A special thanks goes to Dr. Alexandre Delanöe for his help and patience.
I am also hugely appreciative to all the RainGain project partners, from TU Delft, Im-perial College, KU Leuven, Met Office, Météo France, Aquafin, Veolia, City of Rotterdam, Province of Zuid-Holland, Conseil Général du Val-de-Marne, Département Seine-Saint-Denis, Local Government Flood Forum: three intense years of collaboration with you paved the way to this research work.
Many thanks to the staff and interns of École des Ponts ParisTech and Université Paris-Est who supported me and contributed to this research. I would like to mention in particular Aude Mulard, Mohammad Ali, Bérénice Persoz, Chantal Dekeyser, Frédérique Bordignon, Cécile Blanchemanche, Christine Berol, Annick Piazza, the Research Depart-ment and the Communication DepartDepart-ment of ENPC.
I thank my lab-mates: Ilektra, Jisun, Yangzi, Filip, Pierre-Antoine, Tim, Julien Cravero, Alejandra, Lucas, Igor, Abdellah, Yacine, George, Agathe, Julien Richard. Thank
empathy, and from Auguste, who has always answered my frequent queries on Latex and scientific peer review.
Some special words of gratitude go to my parents, my brother Salvo, my sister Agnese, her companion Jerôme and my big Parisian family: Ambra, Francesca, Simon, Baptiste, Guido, Gigia, Serena, Valeria, Michela, Safet, Amaël, Ali, Delfina, Giulia, Marc and many other dear friends. Thank you for supporting me spiritually throughout writing this thesis and my life in general. I am also grateful to Ali and Elisa who, even from abroad, have been able to give me strength with their wise words.
Finally, but by no means least, I would like to thank my little nephew Arturo for his joyful intrusions while I was working at home. The time devoted to my thesis would have been much more monotone without you!
T
ABLE OF
C
ONTENTS
Page
List of Tables xix
List of Figures xxi
1 Introduction 1
2 Urban resilience to extreme weather: from theory to practice 7 2.1 The concept of resilience . . . 8 2.2 Social-ecological resilience . . . 9 2.3 Implementing social-ecological resilience . . . 11 2.4 Methods and metrics that are suitable to assessing flood resilience in
urban areas . . . 15 2.4.1 Disaster Resilience Scorecard for Cities (DRSC) . . . 15 2.4.2 Mapping and Assessment of Ecosystems and their Services
frame-work (MAES) . . . 17 2.4.3 Integrated Analysis of Territorial Resilience (AIRT) . . . 20 2.4.4 SMARTeST indicators of success (SMARTeST) . . . 21 2.4.5 A ‘Four R’s – Five C’s’ framework to assess community flood
re-silience (4R-5C) . . . 23 2.4.6 100 Resilient Cities network and the City Resilient Framework
(100RC) . . . 25 2.4.7 Resilience Alliance assessment (RA) . . . 28 2.4.8 Disaster Resilience Of Place model and the Baseline Resilience
Indicators for Communities (DROP-BRIC) . . . 30 2.4.9 Performance Indicators to Assess Urban Networks Resilience (UNR) 32 2.5 Guiding principles to assess urban resilience to weather extremes . . . 33
2.6 Communication indicators in the literature on resilience assessment
tech-niques . . . 35
2.7 Conclusions . . . 37
3 Social Impact Assessment 39 3.1 Concept of Social Impacts and their typology . . . 40
3.2 Field of Social Impact Assessment (SIA) . . . 43
3.3 Role and scope of SIA . . . 44
3.4 Review of the methodological frameworks, data sources and tools . . . 47
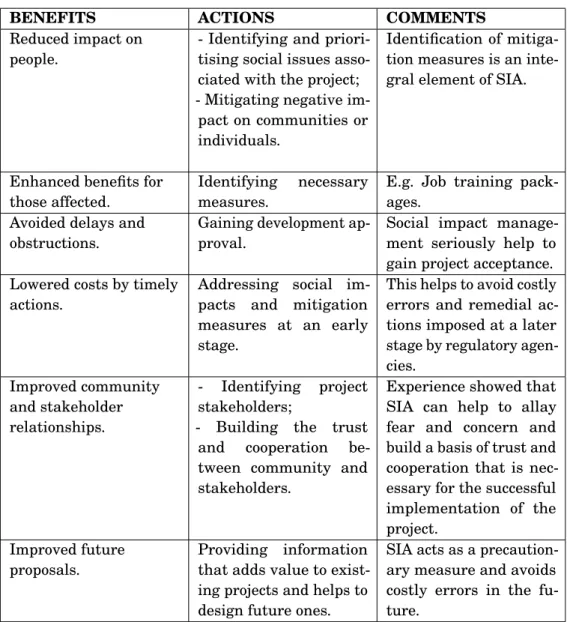
3.5 Benefits of SIA . . . 56
3.6 Examples of SIA good practices . . . 57
3.7 SIA glossary . . . 64
3.8 Specific challenges in mitigating social impacts within the Paris-R100 context . . . 66
3.9 Conclusions . . . 68
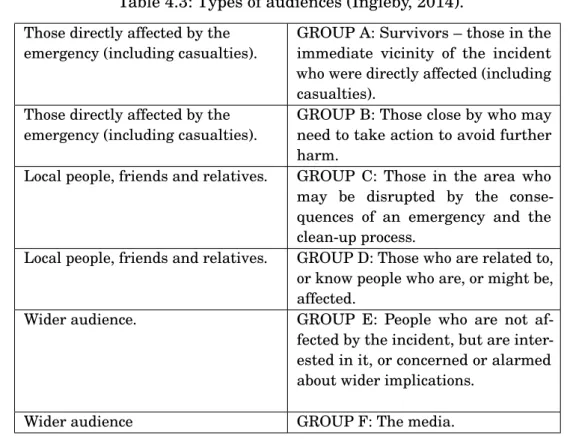
4 Resilience Communication Indicators for the Paris region 69 4.1 Communicating on resilience: who is the audience? . . . 72
4.1.1 Reef Resilience . . . 72
4.1.2 London Resilience Partnership . . . 75
4.1.3 CEPRI . . . 75
4.1.4 TOMACS, CASA and RainGain . . . 76
4.1.5 Wikiresilience . . . 78
4.2 Analysis of 12 communication strategies implemented by public authori-ties to cope with flood risk in Paris . . . 79
4.2.1 Plan de Prévention des Risques D’inondation Du Département de Paris (Direction Régionale de l’Urbanisme du Logement et de l’Équipement d’Île-de-France, 2003) . . . 79
4.2.2 Paris: Dossier Départemental des Risques Majeurs (Préfecture de Police, 2009) . . . 80
4.2.3 Document d’Information Communal sur les Risques (Mairie de Paris, 2009) . . . 82
4.2.4 ORSEC - Plan Familial de Mise en Sûreté (P. Oumraou, P. Ar-rondeau, M. Rousselon, 2010) . . . 83
4.2.5 Stratégie Nationale de Gestion des Risques d’Inondation (MEDDE, 2014) . . . 85
TABLE OF CONTENTS
4.2.6 PAPI de la Seine et de la Marne (EPBT SGL, 2014) . . . 87
4.2.7 OECD Review of the Seine Basin, Île-de-France Resilience to Major Floods (OECD, 2014) . . . 89
4.2.8 Plan de Gestion des Risques d’inondation 2016-2021. Bassin Seine Normandie (DRIEE, 2015) and Stratégie Locale de Gestion des Risques d’Inondation — TRI «Métropole Francilienne» (DRIEE, SGZDS de Paris, 2016) . . . 92
4.2.9 Plan Climat Énergie – Stratégie d’Adaptation (Mairie de Paris, Di-rection des Espaces Verts et de l’Environnement, Agence d’Écologie Urbaine, 2015) . . . 97
4.2.10 Plan Communal de Sauvegarde de Paris (Mairie de Paris, Préfec-ture de Police, 2015) . . . 100
4.2.11 CPIER Plan Seine (DRIEE/DBSN, 2015) . . . 104
4.2.12 Paris Resilience Strategy (Mairie de Paris and 100 Resilient Cities, 2017) . . . 105
4.3 General remarks on the communication objectives, audiences and activities109 4.3.1 The emergence of an integrated approach to risk management . . 109
4.3.2 From centralised communication to public outreach and citizen engagement . . . 110
4.4 Example of assessment of flood risk perception and communication evalu-ation in Île-de-France region . . . 113
4.5 General guiding criteria for RCIs . . . 114
4.6 Conclusions . . . 116
5 The RainGain project: assessing the impact of communication during a project on urban flood resilience 117 5.1 Media coverage monitoring . . . 118
5.2 Questionnaire administered to the visitors of an exhibition . . . 122
5.3 Interviews . . . 128
5.4 Conclusions . . . 130
6 Climate risks and digital media: following Web trails to investigate urban community resilience 133 6.1 Related works . . . 134
6.2 Advantages and constraints of digital media analysis based on advanced text mining and graph representation . . . 136
6.2.1 Method . . . 136
6.2.2 Data . . . 138
6.3 Press coverage of Seine River flood in 2016 . . . 141
6.3.1 Aggregated analysis . . . 142
6.3.2 Graph representation . . . 144
6.3.3 Visual observation of the graph . . . 145
6.3.4 Quantitative analysis of the nodes and the edges . . . 147
6.4 Press coverage of the Côte d’Azur flood in 2015 . . . 148
6.4.1 Aggregated analysis . . . 150
6.4.2 Graph representation and visual observation . . . 151
6.4.3 Quantitative analysis of the nodes and the edges . . . 151
6.5 Twitter coverage of the Seine River flood in 2016 . . . 153
6.5.1 Extraction of the dataset . . . 153
6.5.2 Aggregated analysis . . . 156
6.5.3 Users’ profile and behaviour . . . 156
6.6 Results and discussion . . . 162
6.6.1 Comparison of the four histograms . . . 162
6.6.2 Comparison of the graph representations . . . 163
6.6.3 Tweet analysis . . . 163
6.7 Conclusions . . . 164
7 A graph representation of online strategic documents released by pub-lic authorities 167 7.1 Method and data . . . 168
7.2 Results . . . 169
7.2.1 Documents released between 2008 and 2010 . . . 169
7.2.2 Documents released between 2015 and 2017 . . . 170
7.3 Discussion . . . 173
7.4 Conclusions . . . 176
8 Conclusions 179 8.1 Guidances to assess urban resilience to extreme weather . . . 180
8.2 SIA concepts and methods to relate social impact to territorial development182 8.3 Resilience Communication Indicators for the Paris region and its climate challenges . . . 183
TABLE OF CONTENTS
8.5 Implementation of RCIs through experiments based on unstructured big data exploration techniques . . . 186 8.6 Perspectives . . . 188 Bibliography 193 A Appendix A 209 A Appendix B 219 A Appendix C 225 A Appendix D 229 A Appendix E 239 A Appendix F 243 xvii
L
IST OF
T
ABLES
TABLE Page
2.1 A sequence of resilience concepts, from the narrowest interpretation to the broader social–ecological perspective (Folke, 2006). . . 9 3.1 Key social aspects. . . 45 3.2 Common questions involved in SIA. . . 45 3.3 Five principal sources of information used by SIA experts. . . 48 3.4 Key SIA variables and their evolution from 1994 to 2003 (Inter-organisational
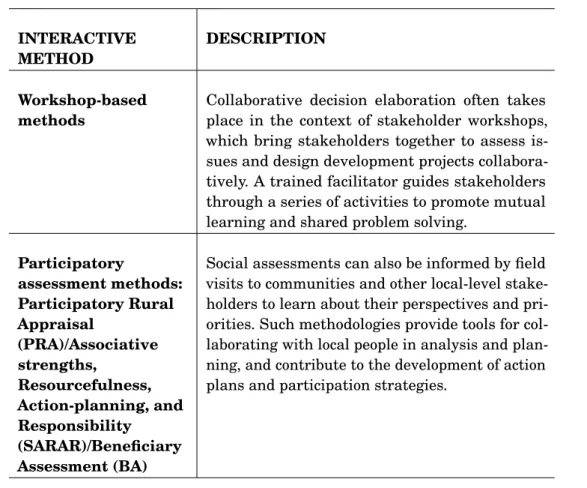
Committee on Guidelines and Principles for Social Impact Assessment, 1994; The Goldman Sachs Foundation and The Rockefeller Foundation, 2003). . . . 50 3.5 Two principal interactive methods that are generally used for profiling of
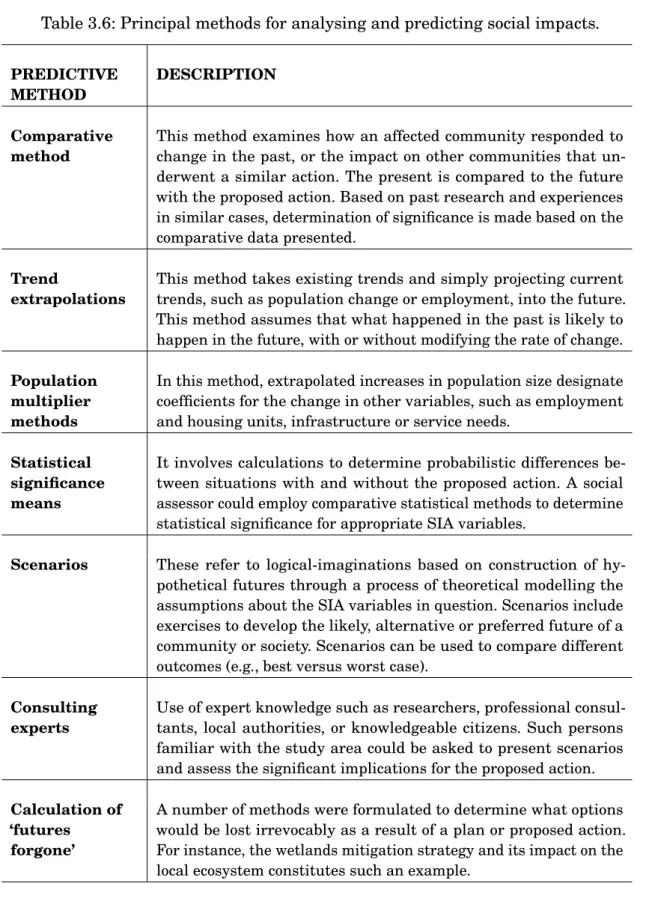
social situations. . . 52 3.6 Principal methods for analysing and predicting social impacts. . . 54 3.7 Six major SIA-induced benefits. . . 57 3.8 Good practice in analysing impact equity. . . 59 3.9 Good practice in impact mitigation and management. . . 60 4.1 Comparison of different approaches to target profiling in resilience
communi-cation activities. . . 73 4.2 Eleven questions that can help determine target audiences (reefresilience.org). 74 4.3 Types of audiences (Ingleby, 2014). . . 76 5.1 Questions to the audience of the video ‘Jeanine presents the radar’ (Mulard,
2015). . . 129 5.2 Questions to the participants of the RainGain workshop, conceived and held
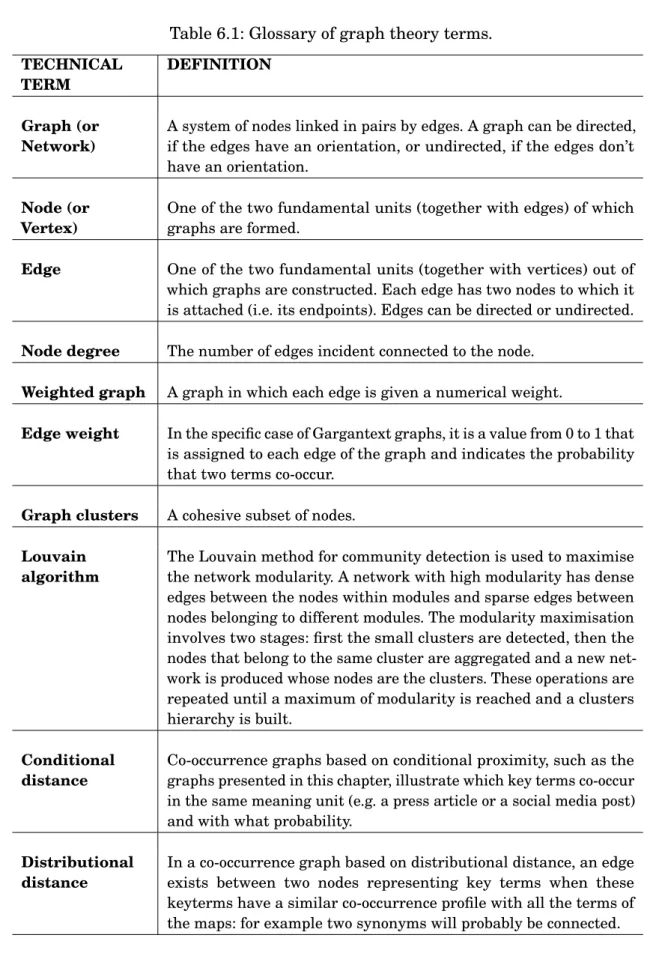
by Auguste Gires in the framework of the Provin Forum (November 2015). . . 130 6.1 Glossary of graph theory terms. . . 139
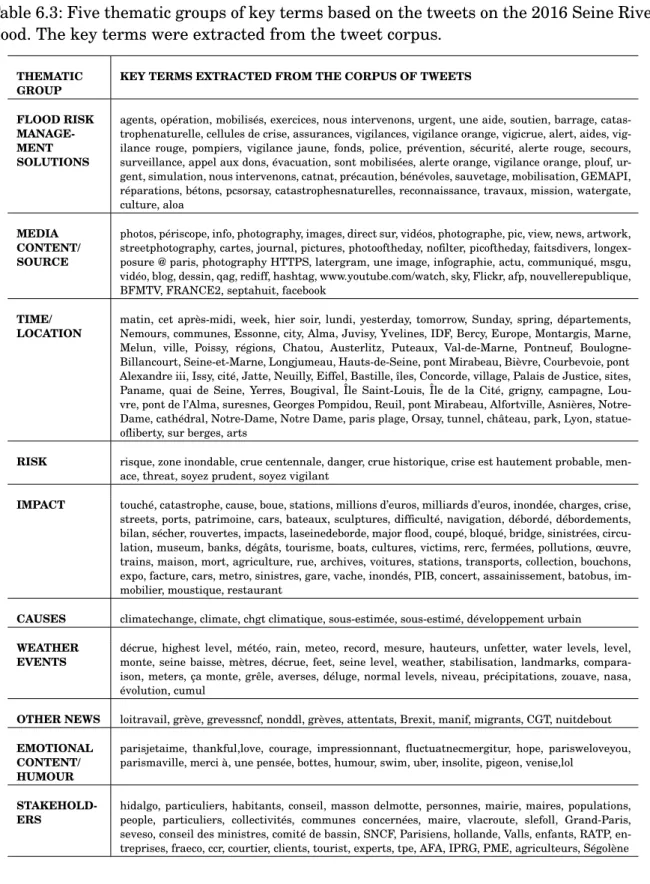
6.2 Key terms related to flood risk management solutions. The terms were ex-tracted from the articles on the 2016 Seine River flood and the 2015 Côte d’Azur flood. The list was automatically created by Gargantext algorithms. Afterwards it was manually refined on the basis of the relevance of the terms. 144 6.3 Five thematic groups of key terms based on the tweets on the 2016 Seine
L
IST OF
F
IGURES
FIGURE Page
1.1 The research plan followed in this thesis. . . 5
2.1 The adaptive cycle (Gunderson and Holling, 2002). . . 11 2.2 The panarchy diagram shows cross-scale interactions (Folke, 2006, modified
from Gunderson and Holling, 2002). . . 11 2.3 Synthesis of the links between pressures condition and ecosystem services in
urban ecosystems (Maes et al., 2018). . . 19 2.4 Zurich Flood Resilience Measurement Framework implementation process
(Keating et al., 2017). . . 25 2.5 The Resilience Wheel illustrating the City Resilience Framework (The
Rocke-feller Foundation and ARUP, 2015). . . 28 2.6 A ‘thresholds and interactions diagram’ presenting ten variables with
thresh-olds in the Goulburn-Broken region (Australia) (Resilience Alliance, 2010). . 30 2.7 Disaster resilience index for the contiguous United States, 2010 (Cutter et al.,
2014). . . 32 2.8 Strategy to assess network resilience (Lhomme et al., 2013a). . . 34
3.1 The impact value chain (The Goldman Sachs Foundation and The Rockefeller Foundation, 2003). . . 44 3.2 Example of scoping algorithm for social impacts from Emergency Tsunami
Reconstruction Project, the Government of Tamil Nadu and Pondicherry (www.worldbank.org/socialanalysis). . . 51 3.3 Schematic illustration on employment of 45 indicators that were measured
over a three-year period in order to assess the baseline and monitor the impact of an action on livelihoods after 12, 24 and 36 months (Anglo American, 2003). 61
3.4 An illustrative example of the monitoring of the changes made to livelihoods and the effectiveness of a better distributed economic development, being quantified by indicators (Anglo American, 2003). . . 62 3.5 Illustration of the multi-dimensional aspect of the notion ‘Quality of life’ in
France (MEDDE, 2015). . . 63 3.6 Graph of happiness of the population vs. GDP (MEDDE, 2015). . . 63 4.1 The CASA centre collects feedback from different groups of target audiences
(i.e. information users) in order to adapt weather information to their back-ground knowledge and on the basis of the relevance that information has for them (V. Chandrasekar et al., 2012). . . 77 4.2 By clicking on one of the five corresponding icons the navigation experience is
adapted to the user profile (http://wikiresilience.developpement-durable.gouv.fr/). 78 4.3 Evolution over time of public authorities’ approaches to communication on
flood resilience issue in Paris region. . . 110 4.4 Assessment plan on flood risk perception and information in Île-de-France
region (EPBT SGL, 28 February 2017). . . 114 5.1 Monitoring of the frequency of the RainGain communication activities in 2013.
During the execution of the RainGain communication plan, the target values (to be attained by the end of the project) were periodically compared with the attained values. . . 119 5.2 Cumulative number of news items (printed press, digital press, TV and radio)
concerning the RainGain project and published from July 2011 to November 2015. The number of news items rapidly raised during specific events: 1) dissemination of a press release on the project (March 2013); 2) a flood event in The Netherlands, followed by a project conference in France (October 2013); organisation of an international scientific conference related to the project (May–June 2015); 3) a flood event in South-Eastern France (October 2015). . 121 5.3 A comparison between the temporal evolution of the cumulative number of
articles and the cumulative audience size of printed press. The differences between the two cumulative curves are due to the fact that different newspa-pers have different impacts in terms of audience size, hence the impact of an article is variable according to the newspaper that publishes it. In order to highlight this variability we overlapped the first and the last values of the two curves. . . 122
LIST OFFIGURES
5.4 The answers to the questionnaire question a) on the RainGain exhibition held in April-May 2014.100% corresponds to the total number of respondents included in each subset: 31 respondents in the first row, 13 respondents in the second row, 5 respondents in the third row, and so on. . . 124 5.5 The answers to the questionnaire question b) on the RainGain exhibition held
in April–May 2014. 100% corresponds to the total number of respondents included in each subset. . . 125 5.6 The answers to the questionnaire question c) on the RainGain exhibition held
in April–May 2014. 100% corresponds to the total number of respondents included in each subset. . . 126 5.7 Answers to a questionnaire question evaluating the risk perception of the
visitors after the RainGain exhibition. 100% corresponds to the total number of respondents included in each subset: 31 respondents in the first row, 13 respondents in the second row, 5 respondents in the third row, and so on. . . . 127
6.1 Comparison between the total number of terms per day (light-blue) and the number of terms per day referring to flood risk management solutions (dark-blue) in a semi-log plot. The histograms are based on four different text corpora: press articles on the 2016 Seine River flood for Fig. 6.1.a, press articles on the 2018 Seine River flood for Fig. 6.1.b, tweets on the 2016 Seine River flood for Fig. 6.1.c, press articles on the Alpes-Maritimes flood for Fig.6.1.d.143 6.2 Graph representation of the press articles on the 2016 Seine River flood:
co-occurrence graph computed on the basis of the measure of conditional proximity between the terms listed in Suppl.2 (Vicari, 2019) and extracted from the corpus of press articles. . . 146 6.3 The key terms corresponding to the nodes of the graph with the highest degree.
The graph representation is based on a corpus of press articles on the 2016 Seine River flood: it was computed on the basis of the measure of conditional proximity between the terms listed in Suppl.2 (Vicari, 2019) and extracted from the corpus of press articles on the 2016 Seine River flood. . . 149 6.4 The most probable pairs of key terms corresponding to the edges with the
highest weight in the graph. The graph is based on a corpus of press articles on the 2016 Seine River flood and on key terms listed in Suppl.2 (Vicari, 2019).150
6.5 Graph representation of the press articles on the 2015 flood in Côte d’Azur: co-occurrence graph computed on the basis of the measure of conditional proximity between the terms listed in Suppl.6 (Vicari, 2019) and extracted from the corpus of press articles. . . 152 6.6 The key terms corresponding to the nodes with the highest degrees in the
graph. The graph representation is based on a corpus of press articles on the 2015 Côte d’Azur flood: it was computed on the basis of the measure of conditional proximity between the terms listed in Suppl.6 (Vicari, 2019) and extracted from the corpus of press articles. . . 154 6.7 The most probable co-occurrences corresponding to the edges with the highest
weight in the graph. The graph is based on a corpus of press articles on the 2015 Côte d’Azur flood and on key terms listed in Suppl.6 (Vicari, 2019). . . . 155 6.8 Twitter coverage of the 2016 Seine River flood: key terms incidence aggregated
in ten thematic categories. Key terms were extracted from the tweet corpus. . 158 6.9 The users’ behaviour (Twitter coverage of the 2016 Seine River flood): (a)
percentage of individual profiles; (b) area of activity of the most active users (59 users who published more than 10 tweets in one month); (c) area of activity of the most liked users (43 users who received more than 50 likes per tweet in one month); (d) area of activity of the most retweeted users (58 users who received more than 50 retweets per tweet in one month). These data were extracted from the tweet corpus and completed with information available on Twitter users’ profile pages. . . 159 6.10 The users’ behaviour: number of likes and number of retweets received by the
five most active users for each of their tweets. These data were extracted from the tweet corpus. . . 161 7.1 Graph representation based on 2008–2010 strategies: the graph
representa-tion was computed on the basis of the measure of distriburepresenta-tional proximity between the terms listed in Suppl.8 (Vicari, 2019) and extracted from the documents released from 2008 to 2010, included in the corpus Suppl.7 (Vicari, 2019). . . 171 7.2 Terms corresponding to high degree nodes in the graph representation based
on strategies released by the public authorities in 2008-2010. The graph was computed on the basis of the measure of distributional proximity between the terms listed in Suppl.8 (Vicari, 2019) and extracted from the 2008-2010 documents, included in the corpus Suppl.7 (Vicari, 2019). . . 172
LIST OFFIGURES
7.3 Graph representation of 2015–2017 documents: graph representation of the strategies developed by the public authorities to cope with the Seine River flood and released from 2015 to 2017. Graph representation based on 2015–2017 strategies: the graph was computed on the basis of the measure of distributional proximity between the terms listed in Suppl.8 (Vicari, 2019) and extracted from the documents released from 2015 to 2017, included in the corpus Suppl.7 (Vicari, 2019). . . 174 7.4 Terms corresponding to high degree nodes in the 2015-2017 graph (based on
distributional proximity between the terms listed in Suppl.8 and extracted from the 2015-2017 documents included in Suppl.7 in Vicari, 2019). . . 175 8.1 Diagram of the empirical part of the thesis and the research perspectives. . . 191
C
HA
PTER
1
I
NTRODUCTION
F
rom a distance, Mark Lombardi’s beautiful, finely pencilled drawingslook like star charts. Up close, however, one sees that his perfect circles and networks of arcing lines connect points labelled with names like Oliver North, George Bush, Bill Clinton. . . The airy, precise webs expanding up to four or five feet across suggest an evil order underlying apparent chaos (Heartney, 2003).
The American artist Mark Lombardi became famous for drawing ‘narrative structures’ as he called them: vast graphs representing links between politicians, businessmen, military men, crime figures, corporations and institutions. These historical diagrams were based on information that he drew from publicly available sources, mainly news stories from reputable media. He was able to synthesise mass of data into something meaningful without using any digital support: he stored his data on some 14 000 note cards, which are now part of the MoMA permanent collection. Beside their aesthetic quality, the artistic value of Lombardi’s schematic drawings relies on their informative purpose: they were means to investigate the labyrinth of global networks and make readable complex underlying systems.
Cities are complex systems that have multiple functions and are located in a changing 1
geophysical environment. The concept of resilience introduces a holistic approach that meets the need to forge links between different urban dimensions: the physical environ-mental subsystems and socio-economic subsystems. This thesis aims at contributing to the current tendency of climate and environmental sciences to unify different disciplines by attempting to answer the question: how can we investigate the role of communication on urban resilience to climate risks? According to this research, exploration techniques of unstructured big data–such as graph representation of public documents–can contribute to the comprehension of a specific component of urban systems: the social construction of realityor, in other words, the perceptions and attitudes that different stakeholders may have regarding the same event, action or project.
The recent development of climate and environmental sciences is attributable to the fact that they confront complex systems where, physical environmental and socio-economic processes interact. In his 1973 seminal paper, the ecologist C.S. Holling stated that ‘resilience determines the persistence of relationships within a system and is a measure of the ability of these systems to absorb changes of state variables, driving variables, and parameters, and still persist’ (Holling, 1973, p. 17). Since then, it progres-sively became necessary to move away from the dichotomy between social sciences and natural sciences and recognise that resilience relies both on physical ecological drivers and social-economic drivers. In this thesis we refer to this approach since it emphasises the human-in-nature perspective and provides a basis for measuring resilience. Indeed, defining resilience metrics is a necessary step to move from theory to implementation. Resilience indexes are helpful to identify objectives, compare the costs with the benefits of new activities, monitor change and adjust ongoing activities. Last but not least, re-silience metrics are an information tool, aimed at ensuring transparency towards the stakeholders and facilitate their active engagement.
As the resilience approach involves apprehending the interactions among different components of a system, resilience implementation necessarily encourages new syn-ergies among decision makers and different policy areas. It is a challenge that calls attention to an important component of urban systems: social networks, information flows, learning processes and other factors that affect the so-called ‘social construction of reality’. The perceptions of a community towards an environmental action, project or policy are evaluated as part of ‘Social Impact Assessment’ (SIA), a methodology that aims at understanding the social effects of territory development interventions by focusing
on the human dimension of environments. According to this thesis, SIA practises, and in particular research on the social construction of reality, could benefit from recent developments in computer-aided exploration of unstructured big data, such as advanced text mining and graph representation.
In this framework, our research springs from the following questions: how can we analyse the role played by communication in cities coping with climate-related risks? With the goal of enriching current resilience assessment approaches, this thesis aims at:
• Outlining new indicators to monitor the role played by communication in urban resilience to weather extremes;
• Employing big data exploration techniques to comprehend the interactions between communication processes and other urban resilience drivers, as well as their space-time variability.
These overarching objectives are broken down into the following detailed objectives:
1. Reviewing different resilience assessment methods and identifying relevant princi-ples for an adequate approach to measure urban resilience to weather extremes; 2. Outlining how Social Impact Assessment (SIA) is undertaken by SIA practitioners
to reinforce balanced and informed decision-making;
3. Identifying Resilience Communication Indicators (RCI) that are tailored to the specific context of Paris region;
4. Testing these indicators through a set of experiments based on SIA research techniques and big data exploration techniques.
These research outcomes will be pursued through six chapters. Chapter 2 starts from comparing nine different methods to assess resilience that are adequate to urban areas facing weather hazards. This overview provides a state of the art of operational definitions of resilience and identifies best practices that can be considered as a frame to define new indicators. Some metrics addressing social construction of reality issues are examined in detail and a first insight is given on how the communication activities can be monitored as part of a resilience assessment.
The third chapter discusses the key role of social impacts in territorial development and outlines SIA practices, their scope and interest. The concept of social construction of realityis also explored, as well as the SIA methodological approach. Lastly, Paris and its resilience strategy are introduced as a challenging context where innovative monitoring methods would be helpful to understand the social dimension of the city and reduce negative social impacts.
In the last fifteen years a significant number of strategies were released by public authorities to cope with extreme weather in the Paris region. The fourth chapter presents a study on the communication activities proposed in twelve strategic documents released by local, national and international institutions from 2003 to 2017. This analysis resulted into the definition of communication variables that are relevant to investigate how the social construction of reality affects resilience in the specific context of Paris region. These variables are used as a basis to define indicators addressing the intensity and quality of communication processes, their space-time variability, the interplay with other resilience drivers, and the underlying socio-semantic networks. Some of these indicators were tested through the experiments that constitute the empirical part (Chap. 5, 6, and 7) of this thesis.
The following chapter presents the experiments that were undertaken in the frame-work of the Interreg NWE IVB RainGain project, a project on flood resilience imple-mented in the Paris region, as well as in three other cities of North-Western Europe. The result of various communication activities (press relations, an exhibition, a promotional video and a workshop) was analysed through SIA techniques: media monitoring, a ques-tionnaire and interviews. Communication results were analysed in both qualitative and quantitative terms. Quantity was considered as corresponding to the communication frequency and audience size. Communication quality was assessed in terms of interpre-tation of scientific information and risk perception. One of the experiments explores the evolution of the press incidence over time and the correlations with weather hazards.
The experiments presented in Chap. 6 and 7 aim at testing indicators that appraise socio-semantics networks and participatory communication. Big data exploration tech-niques, and in particular advanced text mining and graph representation, were adopted as research techniques to explore four corpora of Web communication data. In Chap. 6, we examine digital media contents that were published during and shortly after two
FIGURE 1.1. The research plan followed in this thesis.
flood events: the flood event that hit Côte d’Azur in October 2015 and the Seine River flood of June 2016. In Chap. 7, we consider a longer time period (2003–2017) and we analyse digital documents that were published by public authorities.
The analysis of the four corpora involved an iteration between manual and auto-mated extraction of hundreds of key terms, graph representations based on measures of semantic proximity between key terms (conditional distance or distributional distance), automated cluster visualisation (computed by Louvain algorithm). Visual observation of the graph coupled with quantitative analysis enabled us to detect topics and actors, frequent co-occurrence links and clusters that characterise each corpus. Through a com-parison of the four corpora, it was also possible to observe how these patterns change over time and in the context of different flood-prone urban areas.
C
HA
PTER
2
U
RBAN RESILIENCE TO EXTREME WEATHER
:
FROM
THEORY TO PRACTICE
C
ities are complex systems, with multiple functions and interacting components, where climate pressures contribute to their complexity (Ruth and Coelho, 2007). The socio-economic and physical environmental dimensions are two urban sub-systems that are traditionally studied by researchers from different disciplines. This dichotomy was brought into question by notions such as the ‘social-ecological resilience’ (Folke, 2006). In this thesis, we refer to the social-ecological resilience, as a theoretical frame to comprehend the role of communication in urban resilience. This approach involves analysing the complex interactions between the physical environmental drivers and socio-economic drivers of resilience, the latter including communication processes. Indeed, social networks, information, communication and learning capacities of urban communities influence urban resilience. Furthermore, the social-ecological resilience approach involves the definition of quantitative resilience metrics.After outlining the concept of resilience in Sect. 2.1 and of social–ecological resilience in Sect. 2.2, we discuss the worth of resilience quantitative metrics. Sect. 2.3 and 2.4 present examples of resilience assessment methods to that can be implemented in cities coping with extreme weather. We then outline, in Sect. 2.5, good practices to define relevant indicators. In Sect. 2.6 we examine those resilience indicators that address communication processes and we observe that this social factor is not sufficiently explored
in the literature.
2.1 The concept of resilience
Defining the concept of resilience is necessary to identify the aim of resilience strategies and assess the progress towards those objectives. Different approaches to resilience appeared in a variety of academic and operational fields across the 20thand 21st
cen-turies: from material sciences, engineering and construction, computer networking, to psychology, economy and ecology.
The notion of resilience was introduced in ecology between the 1960s and early 1970s. The early interpretation of resilience was rather concerned by the capacity to absorb a stress and to continue maintaining the function of a system that is assumed to be stable. ‘Engineering resilience’ – as Holling (1996) and Folke (2006) refer to – influenced mainstream ecology and environmental management that were dominated by a single equilibrium view. This approach can be applied to understand the behaviour of linear systems (or non-linear systems that are so close to a stable equilibrium that a linear approximation is acceptable). The focus is on resisting to change and disturbance and on preserving the functions and constancy of a system. The system is presumed to be within or close to a unique, constant, predictable state.
The ‘social-ecological resilience’ perspective, as it called by Folke (2006), departed from the mainstream interpretation of resilience. This new approach points at renewal, reorganisation, innovation, development and adaptation after disturbance as important capacities in a resilient system (Gunderson and Holling, 2002; Berkes et al., 2003; Adger, 2006, Folke et al., 2010).
Holling (1973) is one of the pioneers who applied the concept of resilience to ecosys-tems, with a perspective that is totally different from the engineering resilience. Indeed, Holling considers ecosystems as complex systems with multiple basins of attraction. A perturbation can move a system over a threshold. Beyond this threshold, the system leaves the basin of attraction of its original state to reach the basin of attraction of a new state.
2.2. SOCIAL-ECOLOGICAL RESILIENCE
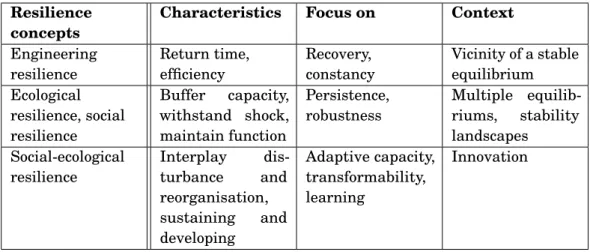
Table 2.1: A sequence of resilience concepts, from the narrowest interpretation to the broader social–ecological perspective (Folke, 2006).
Resilience concepts
Characteristics Focus on Context
Engineering resilience Return time, efficiency Recovery, constancy Vicinity of a stable equilibrium Ecological resilience, social resilience Buffer capacity, withstand shock, maintain function Persistence, robustness Multiple equilib-riums, stability landscapes Social-ecological resilience Interplay dis-turbance and reorganisation, sustaining and developing Adaptive capacity, transformability, learning Innovation
the topic of resilience. The first narrowest concept is ‘engineering resilience’ that relies on the efficiency and time that are needed to return to a stable equilibrium, after a shock. The ‘ecological resilience’ and ‘social resilience’ are two wider concepts, where resilience corresponds to buffer capacity, withstanding shocks, while maintaining functions. Accord-ing to this definition, multiple equilibriums (or stability landscapes) exist for one system. ‘Social-ecological resilience’ is the widest concept according to Folke’s view: resilience relies on a system capacity to sustain and develop, through the interplay between dis-turbance and reorganisation. These dynamics are shaped through interactions between different time and space scales.
2.2 Social-ecological resilience
This section thoroughly outlines the social-ecological resilience approach for two main reasons:
• It emphasises the human-in-nature perspective, by considering interactions and interdependence between the socio-economic and physical environmental subsys-tems;
• It provides measurable definitions of resilience that are a basis to develop and implement resilience metrics.
According to this approach, resilience can be defined as the ‘the capacity of a system to absorb disturbance and reorganise while undergoing change so as to still retain essentially the same function, structure, identity, and feedbacks’ (Walker et al., 2004, p. 2).
The social-ecological resilience perspective puts the accent on thresholds, uncertainty, non-linear dynamics, interplay between gradual change and rapid change (Walker and Meyers, 2004) and on interactions of these dynamics throughout spatial and temporal scales (Gunderson and Holling, 2002). Systems have multiple domains of attraction, that are unstable equilibriums, and the transition from one attractor to another can be sharp or gradual. Because of the complexity of systems, that continuously evolve and are characterised by multiple interactions across scales, the trajectory followed by a system after a perturbation is uncertain: it can be better described with terms such as ‘renewal’, ‘regeneration’ and ‘reorganisation’ rather than ‘recovery’ (Bellwood et al., 2004). For the same reason, Carpenter (2003) prefers the terms ‘regimes’ or ‘attractors’ rather than ‘stable states’ or ‘equilibriums’.
System dynamics are described with the ‘adaptive cycle metaphor’ (Gunderson and Holling, 2002). This heuristic model entails four development phases that are triggered by discontinuous processes and events. This model emphasises the coexistence and complementarity of stable periods:
• The ‘exploitation’ or ‘r phase’ identifies a period of exponential change;
• The ‘conservation’ or ‘K phase’ describes a period of stasis and rigidity. And unstable periods:
• The ‘release’ or ‘omega phase’ corresponds to a period of collapse, creative destruc-tion and readjustments;
• The ‘a phase’ corresponds to a period of renewal and reorganisation;
Instead of focusing on stability, as the conventional earlier approaches to resilience, the adaptive cycle metaphor highlights that disturbance is a component of the develop-ment process.
These dynamics can be observed at different spatial and temporal scales. The interac-tions across scales are described by a model, named ‘panarchy’ (Gunderson and Holling, 2002), of nested adaptive renewal cycles. This model illustrates how a transition from
improve management capacities, to increase transparency and stakeholder involvement during and after a project. According to Carpenter et al. (2001), quantitative definitions and resilience metrics are necessary to test hypotheses on the dynamics of systems. An operational and measurable definition of resilience should be consistent with the theoretical definition, and the same definition should be applicable to different systems and enable cross-system comparisons.
Carpenter et al. (2001, p. 766) agree with the interpretation of Holling (1973; 1996) and they state that resilience is ‘the magnitude of disturbance that can be tolerated before a social-ecological system moves to a different region of state space controlled by a different set of processes’. According to this definition resilience relies on three features of a system:
1. How much change a system can tolerate while maintaining the same functions and structure (or, in other words, while remaining in the same basin of attraction); 2. The capacity of self-organisation;
3. Learning capacity and adaptability (adaptability is understood as defined by Gun-derson (2000), i.e. a learning response to a stress).
In the same paper, the authors also explain that resistance is complementary to resilience: both need to be considered when assessing long-term persistence of a system.
Adaptability is a characteristic of social-ecological systems that is also mentioned by Folke et al. (2010, p. 1). The authors consider ‘adaptability’ as part of resilience and define it as ‘the capacity to adjust responses to changing external drivers and inter-nal processes and thereby allow for development along the current trajectory (stability domain)’. Adaptability of social-ecological systems should be addressed to understand their dynamics and development, as well as ‘transformability’, another characteristic that is interrelated to resilience. Transformability is defined as ‘the capacity to cross thresholds into new development trajectories’. Transformation is necessary to resilience since ‘transformational change at smaller scales enables resilience at larger scales’.
Another important step to assess resilience is to identify the disturbance and the system, exposed to the stress, we are interested in. This is necessary to define the spatial, social and temporal scales of the system. However, the question ‘resilience of what, to
2.3. IMPLEMENTING SOCIAL-ECOLOGICAL RESILIENCE
what?’ (Carpenter et al., 2001) shouldn’t lead to focus on ‘specified resilience’ only, but also to consider ‘general resilience’ that takes into account all parts of a system and all kinds of shocks and stresses, also new ones.
Specified resilience entails the risk of enhancing resilience of specific components of a system to specific shocks, while weakening resilience in other ways (Cifdaloz et al., 2010). The ‘Highly Optimised Tolerance’ theory (Carson and Doyle, 2000) shows that systems that become highly resistant to frequent types of stresses become vulnerable to infrequent shocks. Hence, fostering specified resilience doesn’t necessarily avoid regime shifts. Transformability of systems should always be considered.
Systems are complex in time and space (Schertzer and Lovejoy, 2004). This is pre-sumably the source of the important gaps between theories and applied metrics of resilience. Indeed, operational resilience metrics are usually defined with the help of semi-quantitative indicators that are applied to variables aggregated up to the outer scale of the system, not across the various spatial scales of the system. It is worth mentioning that Tchiguirinskaia et al. (2014) shows that multifractals can be used to define both resilience and its metrics across space-time scales.
In this review we are particularly interested in the city resilience to extreme weather. However the emphasis on this topic doesn’t prevent from considering possible interplay across spatial scales and between floods and other kinds of shocks.
As it is highlighted by Leichenko (2011), the majority of urban resilience studies refer to climate change, considered as one of the pressures that cities face. However, climate-related stresses and shocks happen in combination with other kinds of disturbances, such as environmental, economic, and political pressures. Hence, urban resilience to climate risks necessarily involves the development of resilience to a larger variety of pressures that mutually influence each other.
By the 2000s increasing attention among academics, as well as practitioners, is devoted to the implementation of resilience. Putting the concept of social-ecological resilience into practice involves relevant changes in policy and decision-making. Folke (2006) discusses how policies, following the social-ecological approach, aim to adaptation (Berkes et al., 2003; Smit and Wandel, 2006), rather than controlling change. For
stance, if we consider urban resilience to climate change, the focus would be on adapting and mitigating climate change, rather than controlling it.
Leichenko (2011) proposes an interesting analysis of the topics that are addressed in urban resilience studies. The author traces the origins of four topic areas: urban ecological resilience; urban hazards and disaster risk reduction; resilience of urban regional economies; promotion of resilience through urban governance and institutions. Each study area puts the accent on different aspects of urban resilience and on different components of the cities. Nevertheless, there is a consensus on two points: 1) the need to develop urban resilience to a wider range of risks in order to prepare cities to climate change; 2) climate resilience should be enhanced together with urban development and sustainability. According to Leichenko (2011, p. 166), resilience shouldn’t be equated to ‘reducing vulnerability’ or ‘enhancing adaptive capacity’ and reflection is needed on how to apply the concept in urban areas.
According to the social-ecological resilience perspective, learning how to manage through change is considered a key capacity of individuals and groups to face uncertainty and surprise (Carpenter and Gunderson, 2001; Berkes et al., 2003; Peterson et al., 2003; Kinzig et al., 2003). Hence, citizens are considered as active actors, which emphasise the need to apply the principle of subsidiarity, i.e. to decentralise risk management, encourage citizen participation and share responsibilities (Tanguy, 2015).
Resilience recently became very popular among practitioners in the field of disaster risk management (Keating et al., 2014). A variety of definitions of disaster resilience is proposed by academics, development agencies and NGOs, and multilateral institutions to provide a common basis for resilience implementation. Emergency responders and NGO introduced resilience thinking in their work with individuals and communities, after a disaster. The concept of resilience was also employed in regional and national policies, especially after the Hyogo Conference in 20051. This was a turning point in the UN strategy to reduce natural disasters that has brought the resilience concept in the global arena.
The resilience assessment techniques presented in the next section are extremely
1In January 2005, the "Hyogo Framework for Action 2005-2015: Building Resilience of Nations and
Communities to Disasters" (UN/ISDR, 2007) was adopted by 168 States during the World Conference on Disaster Reduction in Kobe, Hyogo (Japan, 18-22 January 2005).
2.4. METHODS AND METRICS THAT ARE SUITABLE TO ASSESSING FLOOD RESILIENCE IN URBAN AREAS
heterogeneous in terms of the concept of resilience they refer to, the system and distur-bances they consider, the selection of indicators and variables, the degree of the on-site implementation. These examples of resilience indicators include six cases of resilience indicators that are adequate to urban areas (Sect. 2.4.1 DRSC, 2.4.2 MAES, 2.4.3 AIRT, 2.4.6 100RC, 2.4.7 RA, 2.4.8 DROP-BRIC) and three other cases that specifically concern indicators of urban flood resilience (2.4.4 SMARTeST, 2.4.5 4Rs-5Cs, 2.4.9 UNR). Their main characteristics are summarised and compared in the matrix in Appendix A, while the next section discuss in more depth these features.
2.4 Methods and metrics that are suitable to
assessing flood resilience in urban areas
This section offers examples of resilience indicators adopted in different areas: from the academic field to the proposals by multilateral organisations, foundations, and private companies. There is much to be learned from experiences of design and implementation of methods to assess resilience, from qualitative analysis to quantitative metrics.
In 2010, the United Nations secretariat of the International Strategy for Disaster Re-duction launched the campaign ‘Making Cities Resilient’2. Following the adoption of the
‘Sendai Framework for Disaster Reduction’ (UN/ISDR, 2015), the goals and priorities of the campaign were updated, as well as the resilience assessment tool dedicated to cities: the Disaster Resilience Scorecard for Cities (DRSC) (UN/ISDR, 2017). This methodology is aimed at monitoring the implementation of the Sendai Framework at local government level.
2.4.1 Disaster Resilience Scorecard for Cities (DRSC)
Approach to Resilience. According to the United Nations secretariat of the International Strategy for Disaster Reduction (UN ISDR) resilience is ‘the ability of a system, community or society exposed to hazards to resist, absorb, accommodate to and recover from the effects of a hazard in a timely and efficient manner, includ-ing through the preservation and restoration of its essential basic structures and functions’a.
aunisdr.org/we/inform/terminology 2unisdr.org/campaign/resilientcities/
However, we should note that the ‘Sendai Framework for Disaster Reduction’ (UN/ISDR, 2015) puts the accent on ‘disaster risk reduction’ as a main outcome. Nevertheless, resilience is still considered a necessary goal to achieve the outcome of disaster risk and loss reduction. Furthermore, one of the four priorities of the Sendai Framework is ‘Investing in disaster risk reduction for resilience’ (UN/ISDR, 2015, p. 18).
Assessment Framework. The UN ISDR monitors the progress towards the Sendai targets at local government level, in the framework of the ‘Making Cities Resilient’ campaign (www.unisdr.org/campaign/resilientcities/). A guide for munic-ipalities presents the ‘Disaster Resilience Scorecard for Cities’ (DRSC) (UN/ISDR, 2017). This assessment method springs from the following ‘Ten Essentials for Making Cities Resilient’ (UN/ISDR, 2017, p. 4):
1. ‘Organise for disaster resilience;
2. Identify, understand and use current and future risk scenarios; 3. Strengthen financial capability for resilience;
4. Pursue resilient urban development and design;
5. Safeguard natural buffers to enhance the protective functions offered by natu-ral capital;
6. Strengthen institutional capacity for resilience;
7. Understand and strengthen societal capacity for resilience; 8. Increase infrastructure resilience;
9. Ensure effective disaster response; 10. Expedite recovery and build back better.’
Each Essential is aligned to one of the Sendai targets. In this way, local assessment can be compared to national and global assessments. A list of key questions are used as indicators to monitor the progress towards these Essentials. The scorecard offers two levels of assessment: a preliminary evaluation that includes 47 ques-tions/indicators with a graduated 3-point scale; the detailed evaluation requires stakeholders’ involvement and includes 117 questions/indicators with a 0–5 score.
2.4. METHODS AND METRICS THAT ARE SUITABLE TO ASSESSING FLOOD RESILIENCE IN URBAN AREAS
The DRSC methodology has a high international relevance and institutional legiti-macy. An interesting point is the importance given to stakeholder involvement in the assessment process. However, it should be noted that there are discrepancies between the DRSC approach and the social-ecological resilience perspective. Indeed, the DRSC points at disaster reduction, rather than at resilience as an overall objective. Furthermore, seven out of the ten Essentials concern social and economic drivers of resilience, while only three refer to the physical and environmental subsystems.
The Mapping and Assessment of Ecosystems and their Services (MAES) framework, outlined by the European Union (Maes et al., 2018), goes quite the opposite way. The list of indicators for urban ecosystems focus on the physical and environmental dimensions of a city. Indeed this document springs from the ‘Target 2’ of the EU ‘Biodiversity Strategy to 2020’ (European Commission, 2011, p. 12) that is to ‘maintain and restore ecosystems and their services’ in Europe. According to the MAES framework, ecosystem services rely on high ecosystem quantity and quality that are necessary to ensure their resilience.
Nevertheless, the relation between ecosystems and the socio-economic systems is not disregarded: according to the Biodiversity Strategy, ecosystem services increase well-being and have an economic value. The MAES framework specifies that, in urban areas, good living conditions for humans contribute to establish if urban ecosystems are in good condition. The relation between ecosystems and socio-economic systems also arises from the fact that human activities are considered as the drivers of change. Other relevant aspects of the MAES framework are that all the indicators are quantifiable, they are scalable from a local to a global scale, and enable detection of change over time. Experts with particular knowledge in urban areas were involved in defining indicators. EU Member States, other scientific experts and the EC environmental policy units were asked to verify that indicators are policy relevant.
2.4.2 Mapping and Assessment of Ecosystems and their
Services framework (MAES)
Approach to Resilience. In the 2018 MAES report (Maes et al., 2018, p. 15), resilience is defined as ‘the capacity of a social-ecological system to absorb or with-stand perturbations and other stressors, such that the system remains within the same regime, essentially maintaining its structure and functions’.
However, the focus is, in the first instance, on environmental subsystems. Indeed, the objective of the assessment framework is to map and assess ecosystems. High ecosystem quality and quantity are necessary to maintain their resilience and their capacity to provide services. The link between the environmental system and the socio-economic system is made explicit when the report mentions that ‘healthy ecosystems are the fundamental basis for a resilient society and a sustainable economy’ (p. 8). ‘When this capacity is used, ecosystem services flow from ecosystems to humans and deliver benefits. When use exceeds capacity, ecosystems are used in an unsustainable way and degrade’ (p. 15).
Assessment Framework. The MAES framework includes indicators for envi-ronmental pressures (e.g. new built up areas) and ecosystems condition (e.g. urban temperature). This assessment method aims at identifying the links that exist be-tween pressures, conditions and services (e.g. sustainable food production) and inform a broad range of policies related to the use or protection of natural resources (see Fig. 3). For instance, policies that intend to improve human well-being could use this framework to assess the positive impact of reducing a specific pressure on an ecosystem service provision.
All the MAES indicators consider the correlations between ecosystems and socio-economic systems are quantifiable and spatially explicit. The framework was con-ceived to assess ecosystems at EU level, but it is also scalable to national and regional level.
Part of the assessment framework is dedicated to urban ecosystems that are con-sidered as essential for human well-being, since most people live in urban areas. According to a report focusing on urban ecosystems (Maes et al., 2016, p. 69): ‘Urban ecosystems are considered in good condition if the living conditions for humans and urban biodiversity are good. This means, among others, good quality of air and water, a sustainable supply of ecosystem services, species and habitats of community interest in good conservation status and a high level of urban species diversity.’ Some of the indicators for urban ecosystems measure the exposure of the population to an environmental pressure, such as the percentage of the population exposed to noise. These indicators tackle societal challenges and are a clear example of how ecosystem condition can concretely affect people’s lives. Urban ecosystem assessment can be adapted to three different spatial scales (regional, metropolitan and urban scale) according to the policy questions, the socio-ecological processes that are investigated and the available data and indicators.