HAL Id: tel-02122931
https://pastel.archives-ouvertes.fr/tel-02122931
Submitted on 7 May 2019HAL is a multi-disciplinary open access archive for the deposit and dissemination of sci-entific research documents, whether they are pub-lished or not. The documents may come from teaching and research institutions in France or abroad, or from public or private research centers.
L’archive ouverte pluridisciplinaire HAL, est destinée au dépôt et à la diffusion de documents scientifiques de niveau recherche, publiés ou non, émanant des établissements d’enseignement et de recherche français ou étrangers, des laboratoires publics ou privés.
Tunneling under squeezing conditions : Effect of the
excavation method
Manuel de la Fuente Mata
To cite this version:
Manuel de la Fuente Mata. Tunneling under squeezing conditions : Effect of the excavation method. Civil Engineering. Université Paris-Est, 2018. English. �NNT : 2018PESC1071�. �tel-02122931�
Tunneling under squeezing conditions:
Effect of the excavation method
Thèse soumise pour l’obtention du grade de
Docteur de l’Université Paris Est
Ecole Doctorale Sciences, Ingénierie et Environnement (SIE) Spécialité : Géotechnique
présentée le 19 Novembre 2018 à Champs-sur-Marne par
Manuel DE LA FUENTE MATA
Laboratoire Navier, Equipe Géotechnique CERMES
JURY
Amade POUYA Ecole des Ponts ParisTech Président du Jury
Georg ANAGNOSTOU ETH Zürich Rapporteur
Fréderic PELLET Ecole des Mines ParisTech Rapporteur Marc PANET Ecole des Ponts ParisTech Examinateur
Daniel BILLAUX ITASCA Consultants Examinateur
Jean SULEM Ecole des Ponts ParisTech Directeur de thèse Reza TAHERZADEH TRACTEBEL Engineering Co-encadrant de thèse Didier SUBRIN Centre d’Etudes des Tunnels Co-encadrant de thèse
II
III
Tunneling under squeezing conditions:
Effect of the excavation method
Thèse soumise pour l’obtention du grade de
Docteur de l’Université Paris Est
Ecole Doctorale Sciences, Ingénierie et Environnement (SIE) Spécialité : Géotechnique
présentée le 19 Novembre 2018 à Champs-sur-Marne par
Manuel DE LA FUENTE MATA
V
To my parents and to Laura
VII
REMERCIEMENTS
Ce travail est le fruit de collaborations humaines avec des nombreux chercheurs et ingénieurs qu’il me tient à cœur de remercier.
Je tiens à exprimer tout d’abord ma profonde gratitude envers mon directeur de thèse, M. Jean
SULEM, Professeur à l’Ecole des Ponts, pour avoir assuré l’encadrement scientifique de mes
travaux. Je le remercie pour le temps qu’il m’a accordé et surtout par sa gentillesse et ses idées brillantes.
Mes plus vifs remerciements vont ensuite à mon conseiller d’étude M. Reza TAHERZADEH, Directeur Adjoint de l’unité Transports & Infrastructures à TRACTEBEL ENGIE qui m’a fait partager sa grande expérience dans le domaine de la géotechnique de tunnels. Je le remercie également pour être à l’origine du sujet de recherche de ma thèse qui est très passionnant.
Je remercie chaleureusement mon conseiller d’étude M. Didier SUBRIN, Responsable du pôle Géologie, Géotechnique et Dimensionnement au Centre d’Études des Tunnels (CETU), pour tout le temps qu’il m’a consacré et pour sa vaste connaissance et expérience dans le monde des tunnels qu’il a su me transmettre.
Le succès de ce travail a été possible grâce au soutien de l’équipe de ITASCA Consultants SAS. Je remercie vivement M. Daniel BILLAUX, Président de ITASCA Consultant SAS, pour m’avoir accepté dans la formation Itasca Education Partnership (IEP) et M. Huy TRAN MANH, Ingénieur chez ITASCA Consultant SAS, pour m’avoir aidé à maîtriser le code du logiciel FLAC3D.
Je n’oublie pas d’adresser mes remerciements à la Société Française du Tunnel Routier du Fréjus (SFTRF) pour la mise à disposition des données d’auscultations effectuées dans le tunnel routier du Fréjus et sa galerie de sécurité.
J’exprime ma vive reconnaissance à M. Georg ANAGNOSTOU, Professeur à l’ETH de Zürich et à M. Fréderic PELLET, Professeur à l’Ecole des Mines de Paris, pour l’intérêt qu’ils ont bien voulu manifester à l’égard de ce travail, en acceptant de rapporter ce mémoire.
Ma reconnaissance va également à M. Amade POUYA, Professeur à l’Ecole des Ponts, pour m’avoir fait l’honneur d’accepter la présidence du jury de thèse.
Mes remerciements vont également à Messieurs Marc PANET, Professeur Honoraire à l’Ecole des Ponts, Daniel BILLAUX, Président de ITASCA Consultant SAS et Michel LEVY, Directeur à la SETEC, pour avoir accepté de faire partie de mon jury de thèse.
Cette thèse CIFRE a été réalisé dans le cadre de la collaboration entre TRACTEBEL ENGIE, le Centre d’Etudes des Tunnels (CETU) et l’équipe Géotechnique du laboratoire Navier de l’Ecole des Ponts (CERMES). Je les remercie pour m’avoir donné l’opportunité de réaliser ce travail.
J’aimerais de remercier mes collègues et amis à TRACTEBEL ENGIE et au CERMES pour leur accueil toujours sympathique et pour tous les bons moments que nous avons passés ensemble. En spécial je voudrais remercier M. Xuan-Son NGUYEN, Ingénieur chez TRACTEBEL ENGIE qui a participé dans l’obtention d’une grande partie des résultats de ce travail et M. Gildas POTIN, Directeur Technique chez TRACTEBEL ENGIE qui a encadré ma thèse du point de vue des démarches administratives.
Je terminerai en remerciant ma mère, mon père, ma copine Laura et toute ma famille pour son soutien et ses encouragements permanents.
IX
ABSTRACT
During the excavation of deep tunnels, squeezing ground conditions are often encountered. The squeezing behavior of the ground is characterized by large time-dependent and usually anisotropic convergences that take place at the tunnel wall. The technique of excavation has a strong influence on the tunnel response when it is excavated under squeezing conditions. This phenomenon is illustrated throughout the case study of the Fréjus road tunnel excavated with conventional drill and blast methods and of its safety gallery excavated with a single shield tunneling boring machine. They exhibit a very interesting configuration of two tunnels excavated in parallel under the same geotechnical conditions but with different excavation techniques. Monitored geotechnical data from both tunnels are analyzed and compared. Numerical simulations of both tunnels have been carried out with Flac3D. An anisotropic creep model which includes weakness planes of given orientation
embedded in a visco-elasto-plastic matrix has been used for describing the behavior of the ground. A back-analysis of convergence measurements of the Fréjus road tunnel has been carried out. The behavior of the ground identified from the Fréjus road tunnel is extrapolated to predict the response of the Fréjus safety gallery in terms of the stress state in the lining. The influence of the technique of excavation on the time-dependent parameters of the ground is taken into account in the computations and its effects are discussed. It is shown that the long term ground deformations are significantly reduced with TBM excavation as compared to traditional blast and drill method.
Furthermore, the convergence-confinement methods are reviewed and their applicability is discussed when they are applied to full face circular tunnels excavated in rock masses with a stiff support system near the face. In this context, a set of empirical formula are proposed which allows to accurately predict the equilibrium state between the ground and the lining in circular tunnels excavated in full section. These formula are useful in the preliminary phase of tunnel design.
Keywords: tunnel, squeezing ground behavior, Fréjus tunnel, time-dependent behavior,
XI
RESUME
L’excavation d’un tunnel profond dans des terrains poussants pose des difficultés particulières de conception et d’exécution. Ce type de terrain est caractérisé par des fortes convergences en paroi du tunnel de nature différée et souvent anisotrope. Le comportement d’un tunnel excavé en terrain poussant est très influencé par la technique d’excavation utilisée. Le cas d’étude du tunnel routier du Fréjus et de sa galerie de sécurité permet d’illustrer ce phénomène. Il s’agit de deux tunnels parallèles qui montrent une configuration très intéressante étant donné qu’ils traversent des conditions géotechniques similaires et qu’ils sont creusés avec des techniques d’excavation différentes : le tunnel routier a été creusé par méthode conventionnelle à l’explosif tandis que la galerie de sécurité a été creusée avec un tunnelier à bouclier simple. Les mesures d’auscultation réalisées pendant l’excavation des deux tunnels ont été analysées et comparées. Des modélisations numériques pour simuler la réponse des deux tunnels ont été développées avec le logiciel Flac3D.
Le comportement du terrain est simulé avec un modèle visco-elasto-plastique et anisotrope. L’anisotropie liée à la schistosité du terrain est introduite dans le modèle par la présence de plans de faiblesse d’orientation donnée (ubiquitous joint model) insérés dans une matrice rocheuse caractérisée par un comportement visco-elasto-plastique isotrope. Une rétro-analyse a été réalisée sur les mesures de convergence obtenues lors du creusement du tunnel routier du Fréjus. Le comportement du terrain identifié dans le tunnel routier est ensuite extrapolé pour prédire la réponse de la galerie de sécurité. L’objectif est de reproduire l’état des contraintes observé dans les voussoirs de la galerie de sécurité et d’extrapoler les sollicitations à long terme. L’influence que la technique d’excavation, en particulier sur le comportement différé du terrain a été prise en compte dans les simulations numériques. On a mis en évidence que les déformations différées du terrain sont réduites lorsque l’excavation est réalisée au tunnelier.
Par ailleurs, une synthèse critique de la méthode convergence-confinement et de ses variantes a été réalisée. Une discussion a été menée sur l’applicabilité des méthodes convergence-confinent quand elles sont utilisées pour le dimensionnement des tunnels circulaires excavés en section pleine avec l’installation d’un soutènement raide près du front d’excavation comme c’est le cas lors d’une excavation au tunnelier. Dans ce contexte, un ensemble de formules empiriques sont proposées. Elles permettent d’obtenir avec une bonne précision l’état d’équilibre entre le terrain et le soutènement et peuvent être utilisées dans la phase de pré-dimensionnement des ouvrages.
Mots-clés : tunnel, terrains poussants, tunnel du Fréjus, comportement différé, simulation
XIII
TABLE OF CONTENTS
ABSTRACT ... VII RESUME ... XI TABLE OF CONTENTS ... XIII LIST OF TABLES ... XVII LIST OF FIGURES ... XIX
GENERAL INTRODUCTION ... 1
1. Motivation and scope ... 1
2. Knowledge gaps ... 1
3. Aims of the study ... 2
4. Thesis structure ... 3
PART I: STATE-OF-THE-ART ... 5
CHAPTER 1 TUNNELING IN SQUEEZING GROUND ... 7
1.1 Introduction ... 7
1.2 Definition of squeezing ground ... 7
1.3 Identification of squeezing behavior ... 8
1.3.1 Empirical approaches ... 9
1.3.2 Semi-empirical approaches... 11
1.4 Excavation methods in squeezing conditions ... 14
1.4.1 Conventional excavation in squeezing conditions ... 14
1.4.2 Mechanized excavation in squeezing conditions ... 18
1.5 Monitoring of a tunnel excavation ... 22
1.5.1 Monitoring of the convergences in a tunnel excavated with conventional techniques ... 23
1.5.2 Monitoring of the convergences in a tunnel excavated with a TBM ... 25
1.5.3 Monitoring of the stress state in tunnel support... 26
1.6 Conclusion ... 27
CHAPTER 2 DESIGN METHODS ... 29
2.1 Introducción ... 29
2.2 Rock mass classification systems ... 29
2.3 Convergence-confinement (CV-CF) method ... 38
2.3.1 Ground reaction curve (GRC) ... 38
2.3.2 Support Confining Curve (SCC) ... 40
2.3.3 Longitudinal Displacement Profile (LDP) ... 41
XIV
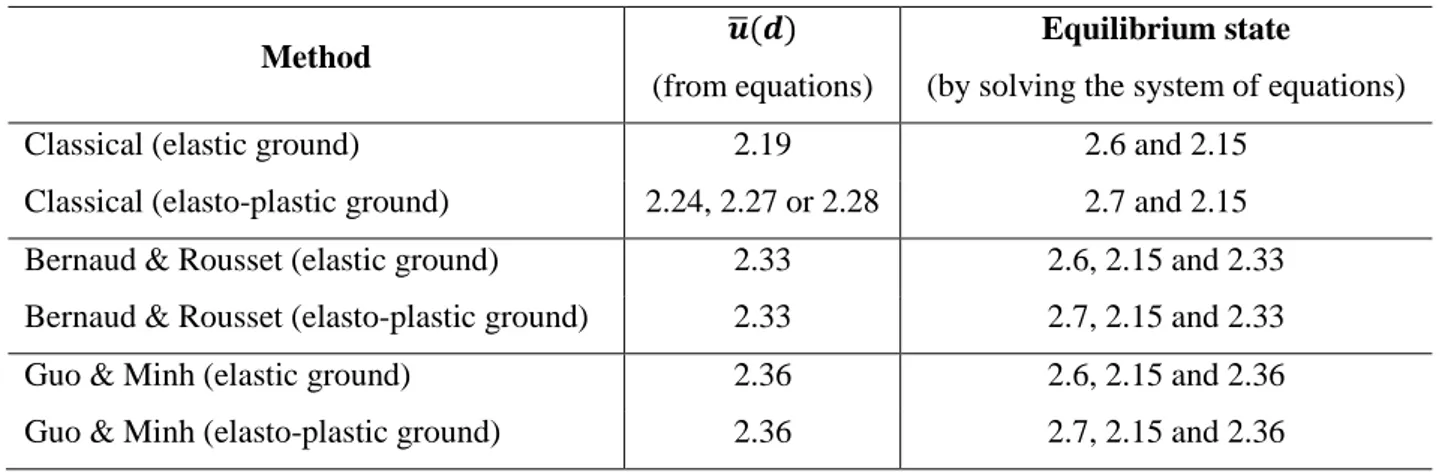
2.3.3.2 The “new implicit CV-CF approach” of Bernaud & Rousset ... 45
2.3.3.3 The implicit CV-CF approach of Guo & Minh ... 46
2.3.3.4 Limitations of the CV-CF method ... 47
2.4 Numerical simulations of ground-support interaction ... 48
2.4.1 Numerical simulations of ground-support interaction for conventional excavation 50 2.4.2 Numerical simulations of ground-lining-TBM interaction for mechanized excavation ... 51
2.5 Conclusion ... 55
PART II: PRELIMINARY DESIGN METHODS ... 57
CHAPTER 3 APPLICABILITY OF THE CONVERGENCE-CONFINEMENT METHOD TO FULL-FACE EXCAVATION OF CIRCULAR TUNNELS WITH STIFF SUPPORT SYSTEM ... 59
3.1 Introduction ... 59
3.2 Applicability of the CV-CF methods ... 59
3.2.1 Numerical 3D reference model ... 60
3.2.2 Plane-strain reference model ... 61
3.2.3 Sensitivity analysis ... 62
3.2.4 Results and discussion ... 64
3.3 Conclusion ... 69
CHAPTER 4 EMPIRICAL FORMULAS FOR THE DESIGN IN THE CASE OF SINGLE SHIELD TBM ... 71
4.1 Introduction ... 71
4.2 Fitting procedure ... 71
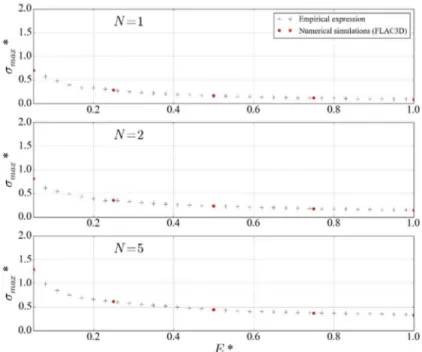
4.3 Expression for the maximal hoop stress in the lining at the equilibrium state ( ∗) ... 71
4.4 Expression for the radial displacement at the tunnel wall at the equilibrium state ( (∞) ∗) ... 76
4.5 Validation of the empirical formulation ... 78
4.6 Conclusion ... 79
Part III: CASE STUDY (THE FREJUS ROAD TUNNEL AND ITS SAFETY GALLERY) ... 81
CHAPTER 5 THE FRÉJUS ROAD TUNNEL ... 83
5.1 Project introduction and general context ... 83
5.2 Geological context ... 84
5.3 Excavation and support techniques ... 85
5.4 Monitoring data and data processing ... 87
5.5 Conclusion ... 98
XV
6.1 Project introduction and general context ... 99
6.2 Mechanized TBM excavation technique ... 100
6.2.1 Characteristics of the TBM... 100
6.2.2 Characteristics of the installed lining ... 102
6.2.3 Backfilling technique of the annular gap ... 103
6.3 Monitoring data and data processing in the safety gallery ... 104
6.4 Conclusion ... 112
PART IV: NUMERICAL SIMULATIONS ... 113
CHAPTER 7 BACK-ANALYSIS OF THE FRÉJUS ROAD TUNNEL ... 115
7.1 Introduction ... 115
7.2 Finite difference technique used in the simulation of the Fréjus road tunnel ... 115
7.3 Anisotropic time-dependent constitutive model ... 116
7.4 Identification of the envelope of the convergences in the Fréjus road tunnel ... 117
7.5 Short-term numerical simulations of the Fréjus road tunnel ... 118
7.6 Long-term numerical simulations of the Fréjus road tunnel ... 126
7.7 Conclusion ... 129
CHAPTER 8 PREDICTION OF THE RESPONSE OF THE FRÉJUS SAFETY GALLERY .. 131
8.1 Introduction ... 131
8.2 Interpretation of stress data retrieved from the segmental lining ... 131
8.3 Numerical prediction of the safety gallery response ... 134
8.4 Long-term numerical prediction of the Fréjus safety gallery ... 138
8.5 Effect of the backfilling on the efforts developed in the segmental lining ... 139
8.6 Conclusion ... 146
CONCLUSIONS AND PERSPECTIVES ... 147
1. Main findings and conclusions ... 147
2. Practical implications for the design ... 150
3. Suggestions for future research ... 151
REFERENCES ... 153
APPENDIX ... 161
APPENDIX A - Total set of results of the comparison of ∗ between the different approaches ... 161
APPENDIX B - Total set of results of the comparison of ∗ between the different approaches ... 163
APPENDIX C - Total set of results of the comparison of (∞) ∗ between the different approaches ... 183
APPENDIX D - Back analysis of convergence data of sections within zone A (from chainage 1905 to chainage 2723) ... 203
XVII
LIST OF TABLES
Chapter 1
Tab. 1.1 Classification of squeezing behavior according to Hoek (2000) compared with Aydan et
al. (1993) classification ( is assumed to be 1 MPa) ... 13
Tab. 1.2 Characteristics of the different TBM types (Ramoni & Anagnostou, 2008) ... 18
Chapter 2
Tab. 2.1 Rock Mass Classification RMR system ratings (Bieniawski, 1989) ... 33 Tab. 2.2 Guidelines for excavation and support of 10 m span horseshoe shaped rock tunnels
constructed using drill and blast method at depth < 900 m, in accordance with the RMR system (Bieniawski, 1989) ... 34
Tab. 2.3 Summary for the application of the CV-CF methods ... 47
Chapter 3
Tab. 3.1 Plane-strain approach: Combination of different LDP curves for various CV-CF
methods for the comparison with 3D numerical results ... 62
Tab. 3.2 Range of values for the parameters ... 63
Chapter 4
Tab. 4.1 Validation of the empirical formulation ... 78
Chapter 5
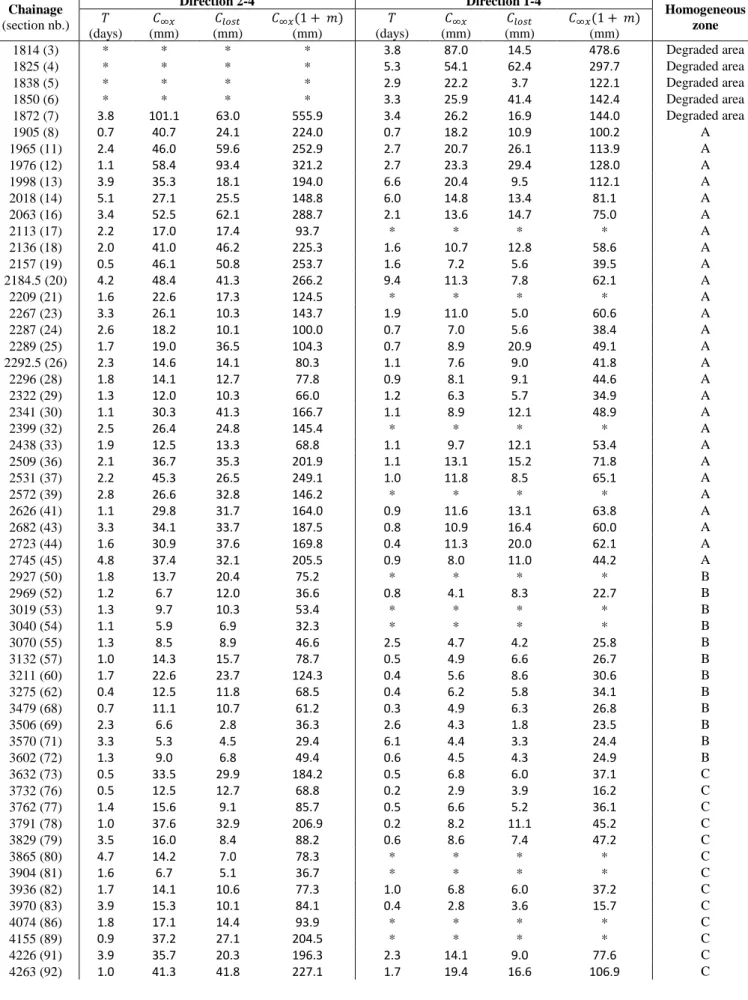
Tab. 5.1 Average mineralogy in the Piémontaise unit ... 84 Tab. 5.2 Results of the fit of sections along the alignment, symbol (*) indicates that monitoring
data is lacking or non-reliable ... 94
Tab. 5.3 Results of the fit of “special” sections along the alignment, symbol (*) indicates that
monitoring data is lacking or non-reliable ... 98
Chapter 6
Tab. 6.1 Quotation system used to assess the cracking degree of each ring Vinnac (2012) ... 111
Chapter 7
XIX
LIST OF FIGURES
Chapter 1
Fig. 1.1 Empirical approach for predicting squeezing conditions after Singh et al. (1992) ... 9
Fig. 1.2 Empirical prediction of squeezing conditions after Goel et al. (1995) ... 10
Fig. 1.3 Approach for predicting squeezing conditions after Jethwa et al. (1984) ... 11
Fig. 1.4 Approach for predicting squeezing conditions (Aydan et al., 1993) ... 12
Fig. 1.5 Side drift excavation (Prague subway) ... 14
Fig. 1.6 Conventional excavation methods after Kovari (1998) ... 15
Fig. 1.7 Cross section of a tunnel with compression slots applied in squeezing rock conditions (redrawn from Schubert W. & Schubert P., 1993) ... 16
Fig. 1.8 Squeezing phenomenon in a cross section of Saint-Martin-La-Porte access adit (Lyon-Turin Base Tunnel), after Bonini & Barla (2012) ... 16
Fig. 1.9 Different parts of a hard rock shield TBM ... 18
Fig. 1.10 Example of a gripper TBM (a), of a single shielded TBM (b) and of a double shielded TBM (c) (Herrenknecht) ... 19
Fig. 1.11 Critical parameters for a gripper TBM (a) and a single shielded TBM (b) after Ramoni & Anagnostou (2011a) ... 21
Fig. 1.12 Ground pressure p acting upon the shield and the lining for three different shield geometries after Ramoni & Anagnostou (2011a) ... 22
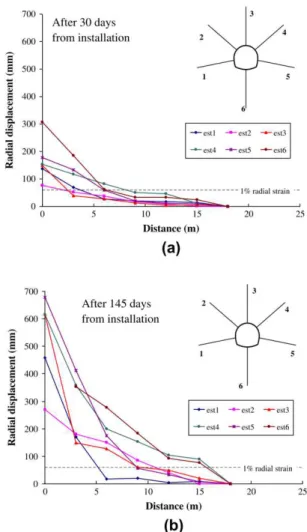
Fig. 1.13 Radial displacements from multi-point borehole extensometers installed at chainage 1330 m in Saint-Martin-la-Porte acces adit after (a) 30 and (b) 145 days from installation after Bonini & Barla (2012) ... 24
Fig. 1.14 Schematic mechanism of core extrusion (Cantieni et al., 2011) ... 25
Fig. 1.15 Image of the TBM used for the excavation of the Fréjus safety gallery. The red circles indicate the position of the hydraulic jacks which measure the gap between the ground and the TBM ... 26
Fig. 1.16 Image of a flat-jack test ... 27
Chapter 2 Fig. 2.1 Barton chart for the support design (NGI, 2015) ... 31
Fig. 2.2 Description of the types of support (NGI, 2015) ... 31
Fig. 2.3 Procedure for measurement and calculation of RQD after Deere (1988) ... 32
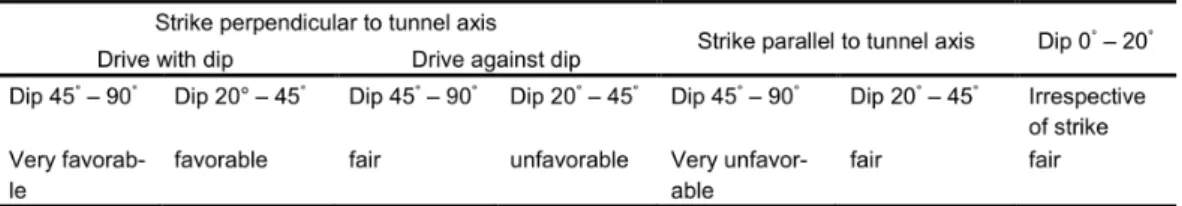
Fig. 2.4 Modified graphic for estimating the Geological Strength Index (Hoek et al., 1998) ... 35
Fig. 2.5 General directions for the immediate support measures for every flysch type (Marinos et al., 2011)... 37
Fig. 2.6 Schematic representation of the curves employed in the CV-CF method ... 42
Fig. 2.7 Influence of the step size on the LDP. Instantaneous excavation and elastic excavations are shown for comparison, after Vlachopoulos & Diederichs (2009) ... 48
Fig. 2.8 Example of an axisymmetric model of a deep tunnel (ZSoil 2014 software) ... 49
Fig. 2.9 Example of a plane-strain model of a deep tunnel with a horse shoe section (ZSoil 2014 software) ... 50
Fig. 2.10 Displacements around the tunnel after the support installation (a) and average stress state in the sprayed concrete layer (b) after Tran-Manh (2014) ... 51
Fig. 2.11 3D model of a double shielded universal TBM excavation (a) working in gripper mode in hard rock and (b) working in single shielded mode in weak rock (Zhao et al., 2012) ... 52
XX
Fig. 2.12 Lyon-Turin Base Tunnel : results for the complete model, crown and invert: (a)
longitudinal displacement profile and (b) contact pressure on the shield and on the lining (Zhao et al., 2012) ... 52
Fig. 2.13 Numerical model for the simulation of tunneling with a double shielded TBM: (a)
complete model and (b) description of the model (Hasanpour et al., 2014) ... 53
Fig. 2.14 Longitudinal contact force profile (LCFP) for different advance rates (3, 6, 12, and 24
m/day) at the tunnel crown over the front shield and the rear shield (Hasanpour et al., 2015).... 54
Fig. 2.15 Ground pressure around the lining: (a) distribution on the ring segment and (b) average
ground pressure on the last set of segment rings versus TBM daily advance rate (Hasanpour et al., 2015) ... 54
Chapter 3
Fig. 3.1 Grid geometry. Axisymmetric model ... 61 Fig. 3.2 Sequence of calculation in the step-by-step method. 1. Installation of the lining. 2.
Excavation and calculation ... 61
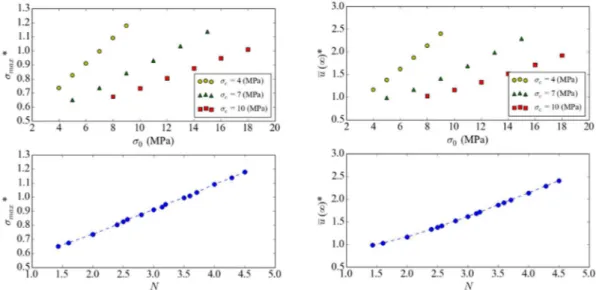
Fig. 3.3 Results of the numerical calculations regarding the normalization. ∗and (∞) ∗
as a function of * ... 63
Fig. 3.4 Results of the numerical calculations regarding the normalization. ∗ and
(∞) ∗as a function of N ... 63
Fig. 3.5 Results of the numerical calculations regarding the normalization. ∗and (∞) ∗as
a function of ∗ ... 64
Fig. 3.6 Comparison of ∗ between the different approaches when ∗=12.5 and ф=25° for
incompressible plasticity ( = 0). Classical methods on the left column and implicit methods on the right column ... 65
Fig. 3.7 Comparison of ∗ between the different approaches when ∗=12.5 and ф=25° for
non-associate plasticity ( = ф/3). Classical methods on the left column and implicit methods on the right ... 66
Fig. 3.8 Comparison of ∗ between the different approaches when ∗=12.5 and ф=25° for
associate plasticity ( = ф). Classical methods on the left column and implicit methods on the right column ... 66
Fig. 3.9 Comparison of (∞) ∗ between the different approaches when ∗=12.5 and ф=25° for
incompressible plasticity ( = 0). Classical methods on the left column and implicit methods on the right column ... 67
Fig. 3.10 Comparison of (∞) ∗ between the different approaches when ∗=12.5 and ф=25° for
associate plasticity ( = ф). Classical methods on the left column and implicit methods on the right column ... 68
Fig. 3.11 Effect of on the difference between the numerical simulation and the plane strain
assumption (ф = 35° and ʋ = 0.25) ... 68
Fig. 3.12 Effect of the friction angle ф on the difference between the numerical simulation and the
plane strain closed form solution for the radial displacement at the tunnel wall ( = 5 and ʋ = 0.25) ... 69
Chapter 4
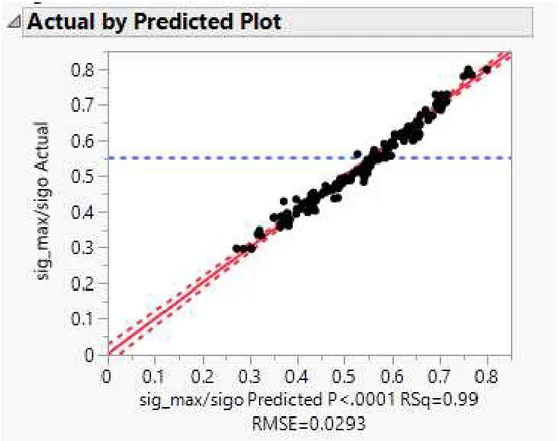
Fig. 4.1 Graphical result of the regression if < 0.4, for ∗ carried out with JMP
(regression coefficient R2 of 0.99) ... 72
Fig. 4.2 Graphical result of the regression if 0.4 ≤ <0.8, for ∗ carried out with JMP
XXI
Fig. 4.3 Graphical result of the regression if F ≥ 0.8 for ∗carried out with JMP
(regression coefficient R2 of 0.97) ... 74
Fig. 4.4 Comparison of ∗ between the numerical simulations and the empirical formula
when ∗=12.5 and ф=25° for incompressible plasticity ( = 0) ... 75
Fig. 4.5 Comparison of ∗ between the numerical simulations and the empirical formula
when ∗=12.5 and ф=25° for non-associate plasticity ( = ф/3) ... 75
Fig. 4.6 Comparison of ∗ between the numerical simulations and the empirical formula
when ∗=12.5 and ф=25° for associate plasticity ( = ф) ... 76
Fig. 4.7 Graphical result of the regression for (∞) ∗ carried out with JMP (regression
coefficient R2 of 0.99) ... 76
Fig. 4.8 Comparison of (∞) ∗ between the numerical simulations and the empirical formula
when ∗=12.5 and ф=25° for incompressible plasticity ( = 0) ... 77
Fig. 4.9 Comparison of (∞) ∗ between the numerical simulations and the empirical formula
when ∗=12.5 and ф=25° for associate plasticity ( = ф) ... 78
Chapter 5
Fig. 5.1 Track alignment in red (bottom) and longitudinal profile (top) of the road tunnel after
SITAF (1982) [the railway tunnel is shown by the discontinuous grey line] ... 83
Fig. 5.2 Geological profile of the alignment ... 84 Fig. 5.3 Main families of discontinuities in the Fréjus road tunnel after Beau et al. (1980) ... 85 Fig. 5.4 Cross section with the boltsing pattern (a) and longitudinal-section of the bolts (b) after
Levy et al., (1981) ... 86
Fig. 5.5 Front face of the Fréjus road tunnel showing the support composed of rockbolts and a
wire grid. Presence of schistosity planes at the tunnel face after SITAF (1982) ... 86
Fig. 5.6 Some instabilities related to the massif discontinuities after Levy et al., (1981) ... 87 Fig. 5.7 Typical cross section of Fréjus tunnel once the final lining is completed after Levy et al.,
(1981) ... 87
Fig. 5.8 Convergence curves and schematic position of the targets in section 13
(chainage 1998) ... 88
Fig. 5.9 Convergences along direction 2-4 between chainage 1872 and 2772 ... 89 Fig. 5.10 Convergences along direction 1-4 between chainage 1872 and 2772... 90 Fig. 5.11 Convergences along direction 1-3 between chainage 1872 and 2772 ... 91 Fig. 5.12 Convergence evolution along direction 2-4 and fit with the empirical convergence law
of from Sulem et al. (1987b) for section 17 at chainage 2113 (a) and section 118 at chainage 5080 (b). On the left in function of time and on the right in function of the distance to the
advancing face ... 93
Fig. 5.13 Evolution of along direction 2-4 along the road tunnel after De la Fuente et al.,
(2017) ... 95
Fig. 5.14 Evolution of ∞ along direction 2-4 along the road tunnel. The red dotted lines
represent the average convergence value for each zone. After De la Fuente et al., (2017) ... 96
Fig. 5. 15 Evolution of ∞ along direction 1-4 along the road tunnel. The red dotted lines
represent the average convergence value for each zone ... 96
Fig. 5.16 Topographic profile for the French part along the road tunnel with the previously
identified “homogeneous zones”. The average overburden for each “homogeneous zones” is indicated ... 97
Fig. 5.17 Evolution of β along the road tunnel after De la Fuente et al., (2017) ... 97 Fig. 5.18 Convergence evolution along direction 2-4 and fit with the law of de Sulem et al.
XXII
Chapter 6
Fig. 6.1 Plan view scheme of Fréjus road tunnel and its safety gallery ... 99 Fig. 6.2 TBM used in the excavation of the safety gallery after Vinnac (2012) ... 100 Fig. 6.3 Image of the hydraulic jacks of the TBM after Vinnac (2012) ... 101 Fig. 6.4 Schemes of the TBM geometry in function of the nominal overcutting (a) and the large
size overcutting (b) ... 101
Fig. 6.5 Geometric characteristics of a ring of the lining installed in the safety gallery ... 102 Fig. 6.6 Relative rotation of a demi-segment between two contiguous concrete rings after Vinnac
(2012) ... 103
Fig. 6.7 Backfilling technique of the annular gap (after Vinnac 2012) ... 103 Fig. 6.8 Frontal and lateral schematic views of the TBM shield with the placed jacks (after
Vinnac 2012) ... 104
Fig. 6.9 Slope of the tunnel wall can be calculated between two hydraulic jacks ... 105 Fig. 6.10 Slope of the tunnel wall between hydraulic jacks 2 and 3. The “homogeneous” zones
identified in the road tunnel are indicated in the graph. ... 106
Fig. 6.11Distribution of the strain gauges in the ring 1821, Chainage 3917 (raw data) ... 106 Fig. 6.12 Lateral friction exerted by the ground over the TBM tail shield, maximal compression
stress measured in the lining (the distance to the excavation face at which the stress has been retrieved can be found next to each point representing the stress state) and RQD values of the ground retrieved from the East or the West side of the vault during the excavation, as a function of chainage in the gallery De la Fuente et al. (2017) ... 107
Fig.6. 13 Example of the strings’ position in a ring ... 109 Fig. 6.14 Example of the RCMS monitoring raw data. Ring 2764 (chainage 5614.8) ... 109 Fig. 6.15 Characteristic cracking location in the rings (oriented in the sense of excavation
towards Italy) after Vinnac (2012) ... 110
Fig. 6.16 Example of cracking data from the survey campaign ... 110 Fig. 6.17 Cracking degree on the right side of the lining in function of chainage ... 111 Fig.6.18 Cracking degree on the left side of the lining in function of chainage ... 111
Chapter 7
Fig. 7.1 Parallelepipedic shape elements (a) and tetrahedral (b) ... 116 Fig. 7.2 Ubiquitous joint model embedded in a visco-elasto-plastic matrix ... 116 Fig. 7.3 Convergence curves in the “homogeneous zone A” along direction 2-4 (a) and along
direction 1-4 (b) ... 118
Fig. 7.4 Geometry of the model (a). Detail of the displacements around the tunnel during its
excavation for section 12 (chainage 1976) (b). R is the radius of the vault of the excavated tunnel (5.8 m) ... 119
Fig. 7.5 Geometry of the tunnel and average position of the targets considered in the
simulations ... 120
Fig. 7.6 Back analysis of convergence data of section 12 (chainage 1976) (largest convergence)
and schematic average position of the targets (right) in the section ... 120
Fig. 7.7 Back analysis of convergence data of section 29 (chainage 2322) ( smallest convergence)
and schematic average distribution of the targets (right) in the section ... 121
Fig. 7.8 Section 12 (chainage 1976) (largest convergence): Plastic area (red zones are the areas
XXIII
blue zones are the areas where matrix and joints are in plastic state at the same time) (a). Stress state in the rockbolts (rockbolts drawn in red have reached the elastic limit) ... 121
Fig. 7.9 Section 29 (chainage 2322) (smallest convergence): Plastic area (red zones are the areas
where the matrix is in plastic state, green zones are the areas where joints are in plastic state and blue zones are the areas where matrix and joints are in plastic state at the same time) (a). Stress state in the rockbolts (rockbolts drawn in red have reached the elastic limit) (b) ... 122
Fig. 7.10 Back analysis of convergence data of sections within zone A (from chainage 1905 to
chainage 2723) ... 123
Fig. 7.11 Linear correlation between α and ξ ... 126 Fig. 7.12 Medium-term (a) and long-term (b) back analysis of convergence data of section 23
within zone A (chainage 2267) ... 127
Fig. 7.13 Geometry of the model: the Fréjus road tunnel and its final lining ... 128 Fig. 7.14 Plot of the computed maximal principal stress in the vault of the road tunnel after 40
years ... 128
Fig. 7.15 Highest computed stress in the vault as a function of time ... 129
Chapter 8
Fig. 8.1 Evolution of the stress state in function of time in ring 1257 (chainage 2902) (a)
schematic representation of the position of the strain gauges within the concrete ring (b) ... 133
Fig. 8.2 Evolution of the stress state related to the time-dependent convergence of the ground as a
function of time (ring 1257 at chainage 2902) ... 133
Fig. 8.3 Scheme of the geometry of the lining and the backfilling in the safety gallery ... 134 Fig. 8.4 Geometry of the numerical model of the safety gallery ... 135 Fig. 8.5 Predicted envelope of maximal hoop stress in the safety gallery and retrieved maximal
hoop stress from sections within zone A ... 136
Fig. 8.6 Predicted envelope of minimal hoop stress in the safety gallery and retrieved minimal
hoop stress from sections within zone A ... 137
Fig. 8.7 Minimal principal stress (maximal compression) in the lining after 3 months (the
constitutive parameters that give the larger efforts are assumed in the computation) ... 138
Fig. 8.8 Highest computed compressive stress as a function of time. ... 139 Fig. 8.9 Comparison of the evolution of the maximal and the minimal stresses in the lining
obtained from a 3D model and a 2D plane-strain model ... 139
Fig. 8.10 2D plane-strain model: Minimal principal stress (maximal compression) four months
after the lining installation ... 140
Fig. 8.11 3D model: Minimal principal stress (maximal compression) four months after the lining
installation ... 140
Fig. 8.12 Annular gap filled up with a homogenous backfilling material composed of gravel
(gravel backfilling) (a), annular gap filled up with mortar in the invert and with gravel in the rest (gravel + mortar backfilling) (b), annular gap filled up with mortar in the invert and in the crown and with gravel in the rest (“sandwich” backfilling) (c) ... 141
Fig. 8.13 Position and sign convention for the efforts developed in the lining ... 142 Fig. 8.14 Configuration with only gravel backfilling: Normal load developed in the lining in
function of the position θ three months after the lining installation. Blue vertical lines indicate the points at the tunnel wall where larger convergences take place (when joints are active) ... 142
Fig. 8.15 Configuration with only gravel backfilling: Bending moments developed in the lining in
function of the position θ three months after the lining installation. Blue vertical lines indicate the points at the tunnel wall where larger convergences take place (when joints are active) ... 143
XXIV
Fig. 8.16 Configuration with mortar + gravel backfilling: Normal loads developed in the lining in
function of the position θ three months after the lining installation. Blue vertical lines indicate the points at the tunnel wall where larger convergences take place (if joints are active). Shaded areas in the graph indicate the zones where mortar was injected ... 144
Fig. 8.17 Configuration with mortar + gravel backfilling: Bending moments developed in the
lining in function of the position θ three months after the lining installation. Blue vertical lines indicate the points at the tunnel wall where larger convergences take place (if joints are active). Shaded areas in the graph indicate the zones where mortar was injected ... 144
Fig. 8.18 Configuration with sandwich backfilling: Normal loads developed in the lining in
function of the position θ three months after the lining installation. Blue vertical lines indicate the points at the tunnel wall where larger convergences take place (if joints are active). Shaded areas in the graph indicate the zones where mortar was injected ... 145
Fig. 8.19 Configuration with sandwich backfilling: Bending moments developed in the lining in
function of the position θ (sandwich backfilling) three months after the lining installation. Blue vertical lines indicate the points at the tunnel wall where larger convergences take place (if joints are active). Shaded areas in the graph indicate the zones where mortar was injected ... 145
1
GENERAL INTRODUCTION
1. Motivation and scope
Nowadays the use of Tunnel Boring Machines (TBMs) in tunnel excavation is increasing. This trend is even observed in tunnels excavated under difficult conditions such as squeezing grounds. Tunneling with TBM under squeezing ground conditions is confronted to many challenges because of the large time-dependent and usually anisotropic ground convergences that take place. This type of behavior is observed in argillite, tuf, flysch, mudstone, gneiss and schist rock masses submitted to a high stress state.
Many tools have been developed for the study of tunnels under squeezing conditions. These tools are of different nature: analytical solutions, empirical solutions and numerical models. All of them are very useful but they need to be employed at the right stage of a tunnel design and taking into consideration their applicability limits.
In the present work, the squeezing ground phenomenon is illustrated through the case study of the Fréjus road tunnel and its safety gallery excavated under the Alps between France and Italy. They exhibit an interesting configuration of two parallel tunnels with a similar size excavated with different techniques under the same geological and geotechnical conditions. The Fréjus road tunnel was carried out in the seventies by drill and blast methods while its safety gallery was executed between 2009 and 2016 with a single shield Tunnel Boring Machine (TBM). During the excavation of the Fréjus road tunnel, the final lining was installed four months after the passage of the advancing face. It allowed carrying out a monitoring campaign where time-dependent convergence measurements were continuously retrieved along the tunnel. On the contrary, during the excavation of the safety gallery, the ground was immediately covered by the segmental lining installed right after the passage of the TBM. In consequence, the ground behavior can’t be properly studied. However, monitoring data was obtained from strain gauges embedded in the segmental lining of several sections in the safety gallery.
2. Knowledge gaps
In a preliminary stage of a tunnel design, analytical and empirical tools are preferred. One of the most extended calculation methods is the ConVergence-ConFinement (CV-CF) closed form solution where the rock-support interaction analysis is simplified by means of a two-dimensional plane-strain assumption. It has been commonly and successfully employed in conventional tunnel excavation with light support systems. However, if the installed support is very stiff as in the case of tunnels excavated with TBM, the results obtained with the CV-CF method may significantly
2
differ from those obtained with numerical 3D simulations. Some improvements of the CV-CF method as the so-called implicit methods deal with the strong interaction between the stiff support and the rock mass by modifying the Longitudinal Displacement Profile (LDP) of the ground. However, when the lining is very stiff, the Ground Reaction Curve (GRC) is also significantly modified. For this reason, the domain of applicability of the different CV-CF methods needs to be clarified for the case of full face circular tunnels with a stiff support system (tunnels excavated with a TBM or tunnels excavated with conventional methods where a stiff lining is installed near the tunnel face as the so-called “heavy” method).
In an advanced stage of the tunnel design, complex numerical simulations are often developed. However, the number of parameters in a complex numerical model is very important and many of them can’t be properly evaluated. This is the case for the ground properties which generally exhibit a large variability within the same geological unit. Furthermore, the properties of the ground will be influenced by the technique of excavation and by the installed support/lining. In this context, a back-analysis of a tunnel can provide a very rich information of the global behavior of the ground and of the main mechanisms which govern the tunnel response. In the literature there exist several examples of back-analyses of tunnels carried out with the aim of studying the mechanical properties of the ground. However, the effect of the technique of excavation on the mechanical properties of the ground and consequently on the tunnel response is still poorly documented.
3. Aims of the study
Regarding the CV-CF methods, in the present study the aim is at obtaining their applicability domain when dealing with full face circular tunnels with a stiff support system. The CV-CF method is a very used tool which has been improved by different authors since it was proposed. For his reason, we aim at reviewing the existing CV-CF methods in order to clarify the way they may be applied.
In the present work, the Fréjus road tunnel and its safety gallery are in-depth back-analyzed as an extensive geotechnical monitoring has been carried out in both tunnels during their excavation. They represent an opportunity of comparing the response of the safety gallery excavated with a TBM and of the road tunnel excavated with conventional drill and blast methods. In order to account for the time-dependent and anisotropic response of the rock mass, the constitutive model proposed for the ground is visco-elasto-plastic and anisotropic. This model has been successfully applied by Tran-Manh et al. (2015a) in the simulation of the response of Saint-Martin-la-Porte access adit within the framework of Lyon-Turin railway project. In the present work the ground behavior is calibrated on convergence measurements retrieved from the Fréjus road tunnel. This behavior is extrapolated to the neighboring zones of the Fréjus safety gallery which show a similar behavior in
3
order to predict the response of the safety gallery. Throughout this case study, the question of the extrapolation of a model calibrated with a tunnel excavated in conventional methods in order to study the response of a tunnel excavated with TBM is addressed. Another objective of this work is to study the time-dependent response of a tunnel which depends on the mechanical properties of the surrounding rock mass. These properties are influenced by the excavation method and the installed support/lining. It is generally considered that when a tunnel is executed by conventional drill and blast methods, the damage induced to the surrounding rock is more significant than when the excavation is carried out with mechanized techniques. We aim at exploring this phenomenon and its consequences in terms of time-dependent of rock mass deformation and long term loading of the final support for the proposed case study.
4. Thesis structure
The present work is organized in four parts with each part divided in two chapters:
Part I is a general introduction of the state-of-the-art and englobes the first and the second chapters:
The first chapter summarizes the main issues of tunneling in squeezing ground using conventional or mechanized techniques as well as the influence of the installed support on the tunnel response. The different techniques used for data monitoring are described and their important role in the design and the control of the civil works is highlighted.
In the second chapter we summarize the main calculation tools used in the study of the ground-support/lining interaction in a tunnel. In early stages of the design of a tunnel, simplified methods such as the rock mass classification systems are employed. A review of the most commonly used rock classification systems can be found in the present work. Furthermore, the CV-CF closed form solution and its utility in a pre-design stage of a tunnel is recalled. Finally, in an advanced stage of the tunnel design, complex calculations are required. In consequence, numerical simulations are presented as an advantageous tool capable of reproducing complex interaction problems.
Part II studies the convergence-confinement methods and its limits. It englobes the third and the fourth chapters:
The third chapter discusses the applicability of the CV-CF methods to full face circular tunnels with a stiff support system excavated in rock masses. A detailed comparison of plane-strain closed form solutions and numerical results which take into account the 3D effects at the vicinity of the tunnel face is carried out.
4
In chapter four, a set of empirical formula are proposed. With this formula, the equilibrium state between the ground and the support in full face circular tunnels with a stiff support system can be accurately predicted. A large range of ground and support properties are covered.
Part III shows a general description of the Fréjus road tunnel and of its safety gallery and their monitoring data processing.
Chapter five within part III is a description of the Fréjus road tunnel and of its excavation technique. Convergence data monitored during the excavation are in-depth analyzed in this chapter. A robust fitting of the convergence data is carried out by means of the semi-empirical law of Sulem et al. (1987b) allowing the identifications of the zones of the tunnel showing a similar behavior.
Chapter six describes the main features of the Fréjus safety galley and of its excavation with a TBM. Monitoring data from an important survey campaign carried out in the gallery is presented (strain gauges embedded in the segmental lining, thrust force exerted by the TBM, etc., …). Monitoring data of the safety gallery is compared to monitoring data of the parallel road tunnel.
Part IV of this work concerns numerical modelling. Chapters seven and eight are included in this part:
In chapter seven, a visco-elasto-plastic constitutive model is proposed for the simulation of the Fréjus safety gallery. A back-analysis of the Fréjus road tunnel based on convergence measurements is carried out. The applicability limits of the constitutive model are also discussed.
The last chapter aims at predicting the response of the Fréjus safety gallery in terms of the stress state developed in the lining. Ground behavior identified from the study of the Fréjus road tunnel is extrapolated to the neighboring zones of the safety gallery in order to reproduce its response. The influence of the technique of excavation on the time-dependent parameters of the ground is taken into account.
Finally, the conclusion summarizes the main findings of this thesis and includes some suggestions for future research.
5
CHAPTER 1 TUNNELING IN SQUEEZING GROUND
7
CHAPTER 1 TUNNELING IN SQUEEZING
GROUND
1.1 Introduction
The excavation of a tunnel faces tremendous difficulties when it is executed through weak and deformable grounds typically encountered within highly tectonized zones at great depth. This phenomenon is called ‘squeezing ground’ in which large time-dependent and anisotropic deformations occur.
A squeezing ground needs specific efforts to design adapted constructive measures and can lead to large adaptations of both the excavation method and the support system leading to an increase in the cost and the delay of the project. Furthermore, the issues arising from this behavior are also observed well after the completion of the civil works with an overloading of the support system.
When executed using conventional techniques, the excavation process can be modified and adjusted during the works according to the encountered ground conditions. A deformable support can be installed to withstand the large convergences to be tackled. On the contrary, although TBM excavation presents many advantages, the adaptation and the optimization of both the excavation and the lining are difficult to achieve as the tunnel geometry and support system are largely fixed before the tunnel excavation. Therefore, the lining can be overloaded and the large convergences can lead to the TBM jamming. The immediate installation of the lining gives a lack of information concerning the ground convergences and, as a consequence, it hinders the study of the ground behavior.
In the present chapter, a general description of the squeezing ground phenomenon can be found. Furthermore, some approaches for squeezing ground identification are presented. The different techniques of excavation in squeezing grounds and related issues are then discussed. Finally, monitoring data techniques are presented and their crucial role in tunnel design is highlighted.
1.2 Definition of squeezing ground
A definition of “squeezing ground” was given by Barla (1995): “Squeezing of rock is the time dependent large deformation which occurs around the tunnel and is essentially associated with creep caused by exceeding a limiting shear stress. Deformation may terminate during construction or continue over a long time period”.
There exist many examples of tunnels excavated under squeezing conditions: Fréjus road tunnel (Panet, 1996) between France and Italy, Lötschberg base tunnel under the Swiss Alps (Richard et
CHAPTER 1 TUNNELING IN SQUEEZING GROUND
8
al. 2006), Sidi Mezghiche tunnel in Algeria or Strenger tunnel in Austria. The squeezing behavior of a tunnel can be described by the magnitude of the convergences, the extent of the yielding zone and the rate of deformation. It is influenced by the geological and geotechnical conditions, the rock mass strength, the in-situ state of stresses, the properties of the rock mass, the ground water flow and pore pressure, the technique of excavation and the support system. Squeezing conditions may vary over short distances because the rock and its properties are usually heterogeneous. It is advisable for squeezing rock conditions to excavate an exploration gallery in order to improve the understanding of geological and geomechanical conditions.
Empirically, a squeezing rock shows low resistance, high deformability and a softening behavior. It is generally encountered in ductile and altered rock complexes under high overburden. This type of behavior is encountered in claystone, tuf, flysch, mudstone, gneiss and schist massifs and is usually associated with specific mineralogy (micas, chlorite, serpentine, clayed minerals). The origin of the anisotropy usually observed may be the result of the combination of an anisotropic state of stresses and of the anisotropy in the structure of the material. If high stresses are combined with the presence of underground high-water pressures, the occurrence of squeezing behavior can be favored e.g. Terzaghi (1946), Gioda (1982), O’Rourke (1984), Jethwa (1996), Kovari (1998), Einstein (1989), Aydan (1996), Panet (1996).
From an engineering point of view, time-dependent ground behavior can have two origins and it is important to identify the differences between both phenomena: “squeezing” and “swelling”. Gioda (1982) described the swelling behavior as a time-dependent volume increase of the geotechnical medium produced by absorption of water in the zone close to the excavation. It can be found in soils or rocks with a content of clayed minerals such as smectite and in rocks with a content of anhydrite.
Furthermore, squeezing has also to be distinguish from rock-burst phenomenon. Indeed, in brittle rocks under high stress concentration, a brutal decompression phenomenon can be observed in the walls of the tunnel which is known as “rock bursting”.
1.3 Identification of squeezing behavior
The identification and quantification of squeezing conditions is of paramount importance before the execution of the works. The existing approaches are commonly of empirical or semi-empirical nature. One of the first tools for assessing the stability of a tunnel was proposed by Muir-Wood (1972) and was based on the competency factor (also called stability factor) which is the ratio between the uniaxial compression strength of the massif and the initial stress state
CHAPTER 1 TUNNELING IN SQUEEZING GROUND
9
= / (1.1)
The same parameter was later on used by Nakano (1979) to recognize the squeezing potential of some tunnels excavated in Japan in soft-rock.
The following paragraphs present some commonly used approaches.
1.3.1 Empirical approaches
This group of approaches is based on classification schemes which allow to identify potential squeezing problems in tunnels. Singh et al. (1992) studied the impact of the rock mass quality index Q (Barton et al, 1974) and the overburden H on the squeezing behavior of 39 case histories. They plotted a cut demarcation line in order to differentiate squeezing cases from non-squeezing ones, Fig. 1.1. Equation (1.2) gives the expression adopted for this division line.
! = 350 %&/' [m] (1.2)
Fig. 1.1Empirical approach for predicting squeezing conditions after Singh et al. (1992) Based on the rock mass number N1 defined as stress-free Q index (by assigning a value of 1 to
parameter SFR the problem of obtaining an accurate value of SFR is avoided)
1 The rock mass number N as defined here should not be confused the stability number also commonly noted N as used later in the thesis (see chapter 3)
CHAPTER 1 TUNNELING IN SQUEEZING GROUND
10
= (%)()*+& (1.3)
as well as on the tunnel depth ! on the tunnel span or diameter ,, Goel et al. (1995), proposed another expression
! = (275 .''),0& [m] (1.4)
In Figure 1.2, a line separates the squeezing and non-squeezing cases. Figure 1.2 also allows to predict a “rock bursting” phenomenon.
Fig. 1.2Empirical prediction of squeezing conditions after Goel et al. (1995)
The method presented by Goel et al. (1995) is more detailed than the one presented by Singh et al., (1992) as not only the squeezing potential is identified but also the degree of squeezing can be estimated: mild squeezing, moderate squeezing and high squeezing. The degree of squeezing can be represented by tunnel convergences as described by Singh and Goel (1999):
• Mild squeezing (convergence 1-3% tunnel diameter)
• Moderate squeezing (convergence 3-5% tunnel diameter)
CHAPTER 1 TUNNELING IN SQUEEZING GROUND
11
1.3.2 Semi-empirical approaches
Semi-empirical approaches aim not only at identifying the potential squeezing behavior of a ground but also at estimating the deformation around the tunnel and/or the required support pressure to withstand the radial pressure exerted by the rock.
The degree of squeezing is defined by Jethwa et al. (1984) based on the “stability factor” .
Based on the value of NC different levels of squeezing potential can be considered, Fig.1.3:
• < 0.4: highly squeezing
• 0.4< < 0.8: moderately squeezing
• 0.8< < 2.0: mildly squeezing
• 2.0< : non squeezing
If an elasto-plastic behavior is considered for the ground and Nc>2.0 the ground will show an elastic behavior during the excavation. With this method, squeezing is considered as soon as there is plasticity.
Fig. 1.3Approach for predicting squeezing conditions after Jethwa et al. (1984)
Fig. 1.3 gives 12/ (where 12 is the ultimate rock pressure on the tunnel lining defined as the radial rock pressure acting on the lining until the rate of tunnel-wall displacement becomes zero. This term is used in squeezing ground where creep deformations take place) versus the peak friction value of the rock φ3, for different values of /2 and a set of residual friction angles φ4
CHAPTER 1 TUNNELING IN SQUEEZING GROUND
12
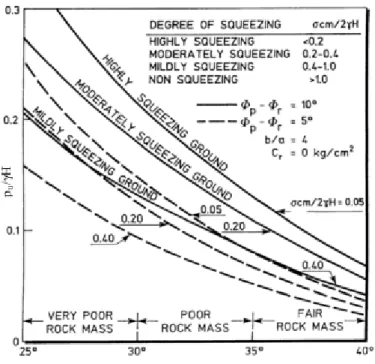
A similar approach is proposed by Aydan et al. (1993) but in this case the uniaxial compression strength of the massif is replaced by the uniaxial compression strength of the intact rock 5 ( and 5 are considered to be the same with this approach which can lead to an overestimation of the uniaxial compression resistance) and compared to the overburden pressure ɣ!, as shown in Fig. 1.4. Squeezing conditions will potentially appear if 5/ɣ!<2. The concept of this method is based on the analogy between the hoop stress - hoop strain response at the tunnel wall and the stress-strain response of rock in uniaxial compression.
Fig. 1.4Approach for predicting squeezing conditions (Aydan et al., 1993)
Aydan et al. (1996) proposed a method which allows for the prediction of five degrees of squeezing behavior based on the normalized deformation at the tunnel wall. This deformation is calculated as the ratio of the tangential deformation around the tunnel 789 (defined as the ratio of the radial displacement around the tunnel to the tunnel radius) to the limit elastic deformation 78: (78: =
5/2; where G is the elastic shear modulus):
• 789/78:≤1: non-squeezing
• 1<789/78:≤ƞ3: light-squeezing
• ƞ3<789/78:≤ƞ=: fair-squeezing
• ƞ=<789/78:≤ƞ>: heavy-squeezing
• ƞ><789/78:: very heavy-squeezing
where the levels of normalized deformation are given in function of the intact rock uniaxial strength: ƞ3= 2 50 .&?, ƞ== 3 50 .@A, ƞ> = 3 50 .'@.
CHAPTER 1 TUNNELING IN SQUEEZING GROUND
13
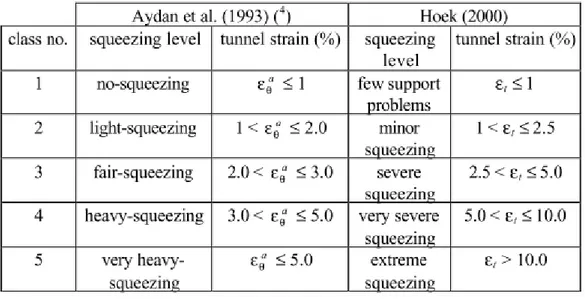
Hoek & Marinos (2000) have proposed a classification for the squeezing level based on the deformation around the tunnel 7B (ratio of the radial displacement around the tunnel to the tunnel radius). This deformation can reach 10 % when the squeezing conditions are severe:
• 7B≤1: few support problems
• 1< 7B≤2.5: minor squeezing
• 2.5< 7B≤5: severe squeezing
• 5< 7B≤10: very severe squeezing
• 7B<10: extreme squeezing
Hoek (2001) proposed a closed-form solution for the estimation of 7B based on the factors / and on 12/
7B(%) = 0.15(1 −3GFH)GGIJH0(
KLF
MHN&)/(K.OLFMH N .AP)
(1.5)
The approach of Hoek and Marinos (2000) covers a larger range of squeezing behavior in comparison to the approach of Aydan et al. (1993) as the extreme squeezing can also be identified. Both approaches are compared by Barla (2001) in Tab. 1.1. The two approaches consider different thresholds with different qualitative descriptions.
Tab. 1.1 Classification of squeezing behavior according to Hoekand Marinos (2000) compared with Aydan et al. (1993) classification ( 5 is assumed to be 1 MPa)
CHAPTER 1 TUNNELING IN SQUEEZING GROUND
14 1.4 Excavation methods in squeezing conditions
The excavation method has an important influence on the squeezing behavior of the ground. It is important to adapt the excavation procedure to the local geological and in-situ stress conditions. The cost and the excavation delay will be very influenced by the technique of excavation.
We can basically classify the excavation methods in two categories: the conventional excavation methods carried out by successive excavation steps and the mechanized methods using a TBM.
1.4.1 Conventional excavation in squeezing conditions
When employing a conventional drill and blast excavation method, an hydraulic breaker or a roadheader machine, the lining design can be easily modified during the excavation. There exist different traditional excavation methods which are more or less adapted to the squeezing ground behavior:
• the side drift method: the cross section open in one stage is reduced by means of advanced concrete sides (Fig. 1.5). This technique can be applied in poor ground conditions (Fig. 1.6a).
• the top heading and benching down excavation: the top heading is excavated in a first stage and the benching down is excavated at a later stage (Fig. 1.6b).
• the full-face excavation method: the entire face of the tunnel is drilled and blasted in one round (Fig. 1.6c). In deformable ground conditions, the systematic reinforcement of the working head and of the ground ahead by means of fiber-glass elements is usually necessary (Barla, 2016).
CHAPTER 1 TUNNELING IN SQUEEZING GROUND
15
Fig. 1.6Conventional excavation methods after Kovari (1998)
Different measures can be taken to stabilize the opening and the type of rock support which is used. It can consist on steel sets, fully grouted bolts, mesh or fiber reinforced shotcrete, etc. An active or a passive approach can be adopted when tunneling in squeezing rock conditions (Barla, 2001):
• Active approach (also called “heavy method” or “resistance principle”): the deformation of the rock is limited by means of a strong support/stabilization/lining system. However, with this technique the support can be overloaded. Pre-reinforcement and pre-treatment of the ground can be considered in order to limit the large convergences behind the working face.
• Passive approach (also called “light method” or “yielding principle”): with this technique, the deformations of the squeezing ground are absorbed by a yielding support which consists on shotcrete and sliding steel sets. After a certain controlled yielding of the support, its resistance is mobilized. An over-excavation of the tunnel is necessary to accommodate the ground deformations in order to obtain the desired section. The amount of over-excavation depends on previous auscultations and on the engineering judgment. The shotcrete lining can be divided into segments as shown in Figure 1.7. Compression longitudinal slots are introduced between the segments in order to prevent load built up in the same segmental lining which could lead to uncontrolled failure.
Furthermore, different support/lining systems can be employed within the same tunnel e.g. Dalgıç, (2002).
CHAPTER 1 TUNNELING IN SQUEEZING GROUND
16
Fig. 1.7Cross section of a tunnel with compression slots applied in squeezing rock conditions (redrawn from Schubert W. & Schubert P., 1993)
The case study of the Saint-Martin-La-Porte access adit (Fig. 1.8) done for the Lyon-Turin link project is an example of tunnel excavated in squeezing ground conditions using conventional techniques where the passive approach is applied. The un-stabilized deformations led to the development of an innovative “yield-control” support system carried out in different phases consisting on radial bolting, fiber-glass dowels, sliding steel ribs and highly deformable concrete elements. Finally, the installation of a concrete lining was carried out once the deformations were considered as stabilized.
Fig. 1.8Squeezing phenomenon in a cross section of Saint-Martin-La-Porte access adit (Lyon-Turin Base Tunnel), after Bonini & Barla (2012)
The principles of two methods which are commonly employed in conventional excavation are described here:
The New Austrian tunneling method (NATM), is a method of modern tunnel design and construction. The method takes advantage of the inherent geological strength available in the
CHAPTER 1 TUNNELING IN SQUEEZING GROUND
17
surrounding rock mass to stabilize the tunnel. It is based on monitoring the performance of underground construction during the excavation. The NATM is oftenly referred to as “design as you go” based on the convergences and the divergences in the lining and mapping of prevailing rock conditions. It is not a set of specific excavation and support techniques. The NATM has seven elements:
- The main component of tunnel support is the strength of the surrounding rock mass. - Shotcrete protection. A thin layer of shotcrete is immediately applied after the face advance. - Measurements and monitoring. The deformations of the excavation must be carefully
monitored.
- Flexible support. Active rather than passive approach is used. The tunnel is strengthened by a flexible combination of rockbolts, wire mesh and steel ribs.
- Quick closing of the invert.
- Changes in support and construction method are possible, but only if the contractual system enables them.
- RMC, ranging from very hard to very soft determines the minimum support measures and avoids economic waste that comes from needlessly strong support measures.
The ADECO method was developed in the eighties in Italy by Professor Lunardi and has the following particularities (e.g. Lunardi et al., 1993, Vydrová 2015):
- It is a method of controlled deformation. The deformation response of the medium to the action of excavation must be principal question with which a tunnel designer is concerned. It indicates the triggering and position of an arch effect (level of stability reaches by the tunnel).
- The deformation response begins ahead of the face in the core and develops backwards from it along the cavity and that it is not only convergence, but consists of extrusion, preconference and convergence.
- The deformation response of the face advance system is directly connected to the deformation response of the cavity.
- It is possible to control deformation of the advance core and as a consequence the deformation of the cavity by acting on the rigidity of the core employing measures to protect and reinforce it.
- The application of the method requires the use of rigid linings as an absolutely essential condition.
- The passage from preconfinement to confinement occurs as gradually and as uniformly as possible.