Investigation of Graphene as a Powder and in a Resin Coating
by
Nam NGUYEN
THESIS PRESENTED TO ÉCOLE DE TECHNOLOGIE SUPÉRIEURE
IN PARTIAL FULFILLMENT FOR A MASTER DEGREE
WITH THESIS IN CONSTRUCTION ENGINEERING
M.A.Sc.
MONTREAL, JULY 10
TH, 2019
ÉCOLE DE TECHNOLOGIE SUPÉRIEURE
UNIVERSITÉ DU QUÉBEC
This Creative Commons licence allows readers to download this work and share it with others as long as the author is credited. The content of this work can’t be modified in any way or used commercially.
BOARD OF EXAMINERS THIS THESIS HAS BEEN EVALUATED BY THE FOLLOWING BOARD OF EXAMINERS
Mme Claudiane Ouellet Plamondon, Thesis Supervisor
Department of Construction Engineering, École de technologie supérieure
Mr. Ali Motamedi, President of the Board of Examiners
Department of Construction Engineering, École de technologie supérieure
Mr. Éric David, Member of the jury
Department of Mechanical Engineering, École de technologie supérieure
THIS THESIS WAS PRENSENTED AND DEFENDED
IN THE PRESENCE OF A BOARD OF EXAMINERS AND PUBLIC ON JUNE 10, 2019
ACKNOWLEDGMENT
Firstly, I would like to thank my supervisor Professor Claudiane Ouellet Plamondon, Professor Éric David and Dr Phuong Tri-Nguyen for the long-term collaboration and the help with building up my academic career with their patience, their support and guidance of my master thesis. Throughout my entire Masters, I greatly enjoy my research and life in the Claudiane’s group.
A special thanks to all my colleagues and technicians: Mr. Xuan Dai Nguyen, Mrs. Khouloud Jhimi, Mrs. Nancy Milena Sacristan Celys, Mr. Anas Himmad, Mr. Victor Brial, Mr. Honoré Kuate Togue, Mr. Michael Di Mare, Mr. Michael Dubois, Mr. Nabil Mazeghrane, and Mr. Radu Romanica, for the help even during my challenging times.
I would like to thank Mrs. Thi Quynh Nga Vu, Mr. Tuan Tran Anh, Mr. Duc Hoang Minh and their family for the guide of my life in Montréal throughout my Masters study just like my family.
This project was made possible thanks to NanoXplore and especially École de technologie supérieure.
Finally, I would like to give my deepest thanks my parents and friendsfor their endless love and support. Last but not least, massive thanks to my brother Mr. Sang Nguyen and my beloved girl-friend Ms. Tra, who I shared a lot of significant time and their support was invaluable to me.
Étude du graphène sous forme de poudre et dans un revêtement de résine Nam NGUYEN
RÉSUMÉ
Le graphène est une monocouche à deux dimensions d’atomes de carbone organisée en réseau hexagonal. La feuille de route d’application du graphène montre qu’il s’agit d’une technologie potentiellement perturbatrice. NanoXplore a déjà produit plusieurs générations de graphène et le produit récent est le graphène noir 3X, un graphène de 6 à 10 couches. Dans la présente étude, en montrant l’incorporation de feuilles de graphène dans une matrice de résine vinylique, nous montrons qu’il est possible de fabriquer des revêtements conducteurs à faible teneur en graphène à haute stabilité thermique. L’analyse thermogravimetrique montre que ces nanocomposites peuvent être utilisés à une temperature inféreure a 300oC sans décomposition chimique. Les revêtements conducteurs peuvent être
obtenus en ajoutant seulement 5% de graphène. La valeur de conductivité la plus élevée est 3,7 x 10⁻² S/cm avec 20% en poids de G3X, suffisamment élevée pour divers dispositifs
électriques. De plus, l’analyse morphologique par SEM et AFM a révélé une distribution uniforme du graphène noir 3X dans la matrice polymere et l’épassseur des feuilles de graphène. Les propriétés mécaniques peuvent être augmentées 1.5 fois en comparant les 5% et 7% en poids de charge de graphène du composite. Cette augmentation est exceptionnelle et rarement mentionnée dans littérature pour ce type de revêtement.
Mots-clés: Nanocomposites, nanomatériaux, résines vinylester, graphène, morphologie,
Investigation of graphene as a powder and in a resin coating Nam NGUYEN
ABSTRACT
Graphene is two-dimension monolayers of carbon atoms organized in a hexagonal lattice. The road map of application of graphene shows that this is a potentially disruptive technology. NanoXplore already produced several generations of graphene and the recent product is the Graphene Black 3X, a 6-10 layers’ graphene.
In the present investigation, by incorporating black 3X graphene sheets into a vinyl resin matrix, we show that is possible to fabricate low graphene content conductive coatings with high thermal stability. TGA analysis shows that these nanocomposites can be used at a temperature lower than 300oC without any chemical decomposition. The conductive coatings
can be achieved with the addition of only 5 wt.% of graphene. The highest value of conductivity is found to be 3.7 x 10⁻² S/cm with 20 wt.% of G3X, sufficiently high for
various electrical devices. Furthermore, the morphological analysis by SEM and AFM revealed uniform distribution of black 3X graphene within the polymer matrix and the thickness of graphene sheets. The mechanical properties can be increased 1.5 times comparing 5 wt.% and 7 wt.& loading of the graphene of the composite. This increment is exceptional high and rarely reported in the literature for this kind of coating.
Keywords: Nanocomposites, Nanomaterial, Vinyl ester resins, Graphene, morphology, Electrical conductivity
TABLE OF CONTENTS
Page
INTRODUCTION ...1
CHAPTER 1 LITERATURE REVIEW ...5
1.1 Introduction ...5
1.2 Materials ...6
1.2.1 Plastic classification ... 6
1.2.2 Thermoset polymer and resins ... 9
1.2.3 Vinyl ester resin... 11
1.2.4 Graphene ... 13
1.3 Fabrication and characterization methods ...19
1.3.1 High shear mixer ... 19
1.3.2 Morphological studies ... 20
1.3.3 Fourier Transform Infrared (FTIR) spectroscopy ... 23
1.3.4 Thermal properties ... 24
1.3.5 Tensile property ... 25
1.3.6 Electrical properties ... 25
1.4 Review of the measured properties of polymer composites with graphene ...29
1.5 Application of vinyl ester resin and graphene in coating ...31
CHAPTER 2 MATERIALS AND METHODS ...33
2.1 Introduction ...33
2.2 Materials ...34
2.2.1 Vinyl ester resin... 34
2.2.2 Hardener ... 34
2.2.3 Graphene ... 35
2.3 Processing the preparation of vinyl ester resin/graphene composites ...37
2.4 Test methods ...38
2.4.1 Electrical properties measurements of graphene black 3X and OX ... 38
2.4.2 Scanning electron microscopy... 39
2.4.3 Atomic force microscope ... 40
2.4.4 Thermogravimetric Analysis ... 41
2.4.5 Mechanical properties ... 42
2.4.6 Broadband dielectric spectroscopy ... 43
2.4.7 Four-point probe ... 44
CHAPTER 3 RESULTS AND DISCUSSIONS...46
3.1 Introduction ...46
3.2 Results and discussions ...46
3.2.1 Electrical conductivity of 3X and OX graphene under compression ... 46
3.2.3 Thermal properties ... 54 3.2.4 Mechanical properties ... 57 3.2.5 Electrical properties ... 59 CONCLUSION ...60 RECOMMENDATIONS ...61 BIBLIOGRAPHY ...73
LIST OF TABLES
Page
Table 1.1 Summary of construction material applications
for thermoset resins ...10
Table 1.2 Compare three main of thermoset polymers ...11
Table 1.3 Mechanical properties of different grapahene derivatives ...17
Table 1.4 Literature review on electrical conductivity of different graphene derivatives ...18
Table 1.5 Literature review on thermal conductivity of different graphene derivatives produced by various methods ...19
Table 1.6 Literature review on different nanocomposites showing the tensile ...29
Table 1.7 Literature review on electrical conductivity ...30
Table 1.8 Literature review on polymer graphene nanocomposites ...30
Table 2.1 Characteristics of the vinyl ester resin ...34
Table 2.2 Physical properties of graphene black 3X ...36
Table 2.3 The graphene black 3X chemical composition values ...36
Table 2.4 The proportion of vinyl ester resin and graphene black 3X ...38
Table 2.5 Measurement of body resistivity ρ on thin samples of thickness t and spacing s ...45
Table 3.1 TGA data of prepared samples ...56
LIST OF FIGURES
Page
Figure 1.1 The main categories of polymers ...7
Figure 1.2 The proportion of global use of plastics ...8
Figure 1.3 Chemical structure composition of vinyl ester resins ...12
Figure 1.4 The structure and main properties of graphene-based materials ...14
Figure 1.5 The 3D structure of graphene layer ...14
Figure 1.6 The summary of synthesis techniques for graphene ...16
Figure 1.7 Schematic four-point probe and BDS ...27
Figure 2.1 The overview of the experimental procedure ...33
Figure 2.2 Chemical structure of MEKP ...35
Figure 2.3 The application of graphene black 3X in the industry ...36
Figure 2.4 Fabrication process of vinyl ester resin/graphene black 3X composite ...37
Figure 2.5 The composite samples based on VSR and various G3X contents ...38
Figure 2.6 The SEM model Su-8230, FE-SEM equipment in ÉTS laboratory ...40
Figure 2.7 The turbo-pumped sputter machine in ÉTS laboratory ...40
Figure 2.8 Leica RM2265 rotary microsystem in ÉTS laboratory ...41
Figure 2.9 AFM images from the Université de Montréal laboratory ...41
Figure 2.10 Diamond Thermogravimetric/Differential Thermal Analyzer device ...42
Figure 2.12 Tensile strength measurement equipment used
in this work ...43
Figure 2.13 Images showing main devices for BDS technique ...44
Figure 2.14 Four-point probe collinear probe resistivity method ...45
Figure 3.1 Electrical conductivity versus pressure of two types of graphene ...48
Figure 3.2 AFM image of graphene black 3X with 500x500 nm ...50
Figure 3.3 AFM images of VSR_20%G with 3x3μm ...51
Figure 3.4 SEM images of cross section of the composites ...53
Figure 3.5 SEM images of structure characteristics of black 3X graphene in vinyl ester matrix ...54
Figure 3.6 TGA curves of neat G3X, neat resin and VSR/G3X composites ...56
Figure 3.7 TGA thermograms of the derivative of mass loss as a function of temperature ...57
Figure 3.8 Representatives stress-strain curves of the composites with different graphene black 3X contents ...58
Figure 3.9 Electrical properties by four point probe test of VSR_G3X ...59
Figure 3.10 Modulus of VSR_G3X complex conductivity as function of frequency ...61
Figure 3.11 Modulus of VSR_G3X complex conductivity as function of frequency ...61
LIST OF ABREVIATIONS
3D Three dimensional
AC Alternating current AFM Atomic force microscopy
BDS Broadband dielectric spectroscopy Bio_GOX Bio-epoxy resin_Graphene OX CVD Chemical vapour deposition DC Direct current (DC)
DTG Derivative thermogravimetry EC Electrical conductivity
EMI Electromagnetic interference shielding (EMI) ESD Electrostatic discharge
eV Electron volt
EVA Ethylene vinyl acetate
fGO Functionalised graphene oxide
frGO Functionalised reduced graphene oxide FTIR Fourier transform infrared spectroscopy G3X Graphene black 3X
GNS Graphene nanosheets
GO Graphene oxide
GOX Graphene black OX
Gr Graphene
LDPE Low density polyethylene LLDPE Linear low density polyethylene MEK Methyl ethyl ketone
MEKP Methyl ethyl ketone peroxide
N Newton
OBRC Online bioinformatics resources collection
Pa Pascal
PA Polyamide
PC Polycarbonate
PE Polyethylene
PET Polyethylene terephthalate
PP Polypropylene
PS Polystyrene
PVA polyvinyl alcohol PVC Polyvinyl chloride
PVDF Polyvinylidene difluoride rGO Reduced graphene oxide SEM Scanning electron microscope
SERS Surface-enhanced Raman spectroscopy
TG/DTA Thermogravimetric/Differential Thermal Analysis TGA Thermogravimetric analysis
TrGO Thermally reduced graphene oxide UTS Ultimate tensile strength
XIX
UV Ultraviolet
VE Vinyl ester
VSR Vinyl ester resin
LIST OF SYMBOLS A Area of the piston surface (cm2)
F Correction factor I Current (mA) L Sample distance (cm) nm Nanometre oC Degree Celsius P Pressure (Pa)
s Distance between the probes (mm)
sp2 Hybridized atoms in sigma and pi bonding
t Film thickness (mm) V Applied voltage (mV) wt.% Weight percentage ρ Resistivity (Ωcm) R Resistance (Ω) ρs Resistivity of sample (Ωcm) σ Electrical conductivity (S/m)
INTRODUCTION
The capability to synthesize nanoparticles of diverse materials, sizes and shapes associated with the ability to assemble them efficiently into complicated structures makes a significant breakthrough in the area of nanoscience (Evanoff Jr. et Chumanov, 2005). The structural characteristics allow nanomaterials to possess a large variety of applications. However, different types of materials owning advanced physicochemical properties were thoroughly investigated to be more dimensionally compatible in the field of nanoscience and technology. The exploration of graphene and graphene-based polymer nanocomposites has consequently become essential in the field of nanoscience particularly and in the era of science and technology (Stankovich et al., 2006).
There has been an increasingly positive concern about polymer nanocomposites in the recent years thanks to their improved properties derived from the reinforcement of nanofillers (Kim, Abdala et Macosko, 2010; Potts et al., 2011). In comparison with the conventional micron scale fillers, the properties of the composites are considerably influenced by the dispersion of the nanofilleres inside the polymer matrix (Kuilla et al., 2010). Graphene is a one-atom-thick planar sheet of sp2-bonded carbon atoms and emerges as a potentially multifunctional
nanofiller owning to its range of strengths, namely exceptionally high electrical and thermal conductivities, enormous mechanical properties and affordably-priced manufacture. It is additionally seen as the “thinnest material in the universe” with a great potential for different applications (Dreyer et al., 2010; Si et Samulski, 2008).
NanoXplore is a company located in Montreal and it has expertise on graphene commercial at a low cost, large volume and highly scalable. Graphene is two-dimension monolayers of carbon atoms organized in a hexagonal lattice. The road map of application of graphene shows that this is a potentially disruptive technology. NanoXplore already produced several generations of graphene and the recent product is the Graphene Black 3X, a 6-10 layers’ graphene. The potential applications are various, including heat dissipation, EMI shielding, gas barriers, UV resistance, conductive inks and coatings, battery electrodes, smart
composites, electrostatic discharge (ESD) and anti-static. Graphene may also be used for latest innovative technologies such as production of hydrogen from water (Peng et al., 2018); enhanced surface-enhanced Raman spectroscopy (SERS) (Liu et al., 2018), storage energy (Pei et al., 2018) and fast water transport (Xie et al., 2018).
The current data sheet does not contain information about the basic conductivity of this material. NanoXplore has an important line of activity in graphene that needs more investigations on several aspects including: coating materials and methods, durability, conductivity. Regarding graphene based nanocomposites, NanoXplore has developed strict collaboration and funded to some research groups to prepare smart graphene-polymer nanocomposites: i) conducting polymer from polyethylene (PE)/graphene (Moghimian et al., 2017), ii) EVA/graphene, iii) super thermally conductive PE/graphene nanoplatelets (Hamidinejad et al., 2018), iv) super-high heat dissipation poly (vinyldene fluoride)/graphene nanoplatelets composites to improve electromagnetic shielding (Zhao et al., 2017a).
Vinyl ester resins are thermoset matrices, which are widely applied in the industry of composites (Changwoon Jang, 2012; Liao et al., 2010). It is the esterification of epoxy resin with unsaturated monocarboxylic acid that manufactures the VE resin. The environment which is suitable for the resins requires high corrosion and chemical resistance, water barrier properties, low moisture absorption, low shrinkage and good dimensional stability (Anupama Chaturvedi, 2013; Zhanhu Guo, 2006). Owing a variety of advantages, these resins have been extensively used in number of applications such as matrix material, coating, adhesive, electronic encapsulate, in the marine industry, pipelines and automotives (Guo, 2009; Thostenson et Chou, 2006; Zhang et al., 2014).
Objectives of the Master thesis
The general objective of this project is to prepare and characterize graphene/vinyl ester nanocomposite. The specific objectives are the following:
3
• Measure the conductivity of graphene powders;
• Investigate the optimal conditions for the preparation of conducting coating from vinyl ester resin by turning processing conditions (graphene content, temperature, hardness content, sample thickness, and mixing time).
• Investigate the electrical, thermal, mechanical properties of as-prepared coatings.
Thesis outline
In the “Literature review”, the mechanism, synthesis and applications on composite materials, a brief overview of thermoset resins, vinyl ester resin, graphene and characterization methods have been introduced.
In the following chapter Materials and methods, Chapter 2 explains the experimental process, materials and test methods involved in making and analyzing Vinyl ester resin/graphene black 3X composite materials.
In chapter 3 Results and discussions, the synthesized samples were characterized by scanning electron microscopy (SEM), atomic force microscopy (AFM), thermogravimetric analysis (TGA), tensile strength measurements, broadband dielectric spectroscopy (BDS) and four-point probe test.
Conclusions and recommendations are made for summary and future research.
Appendix 1 shows exploratory results on graphene black 0X and bio-epoxy resin decomposition. These results were not further analyzed because of the low conductivity.
Original contribution
The aim of the present work is to perform facile and low cost mechanical methods to prepare advanced composite materials. Graphene-based vinyl ester resin composites were successfully prepared by incorporating graphene into the matrix with improved electrical
properties, thermal stability, and mechanical strength. Furthermore, results from this thesis provide better understanding on the new graphene materials and their potential applications in the smart composite materials. The improvement of the material properties, particularly on conductivity of materials contributes to reducing the price and increases the performance of the composite materials. The latter has a direct link to the use of energy efficiency and thus sustainable development.
CHAPTER 1 LITERATURE REVIEW
1.1 Introduction
In this section, the structure and applications of materials (plastic, vinyl ester resins, graphene), characterization methods are introduced.
A composite material is composed of at least two distinct materials. It is typically composed of two phases, a non continuous phase, like a particle, which has superior properties and a continuous phase, the matrix. This review of conducting polymer/graphene nanocomposites highlighted their potential applications in the coming years for material science and construction engineering field.
The overall polymer nanocomposites properties are driven by the optimal conditions for the preparation of conducting coating and the properties of the graphene and vinyl ester resins. Graphene-based is undoubtedly considered as an exceptional material which was studied for different properties, such as thermal properties (Shahil et Balandin, 2012), mechanical properties (Al-Saleh et Sundararaj, 2011), electrical properties (Sanjinés et al., 2011), rheological properties (Potts et al., 2011), microwave adsorption (Lee, 2012; Qin et Brosseau, 2012), environmental and toxicological impacts (Singh et al., 2011), tailoring with preparation methods (van Rooyen, Karger-Kocsis et David Kock, 2015), and gas barrier properties (Kim, Abdala et Macosko, 2010). The polymer nanocomposites and graphene have been currently used to widespread applications in electronics (Bkakri et al., 2014), bio-electric sensors (Lian et al., 2015), energy technology (Abdin et al., 2013), lithium batteries (Sun et al., 2014), aerospace (Azeez et al., 2013), and various other fields of nanotechnology (Agnihotri, Chowdhury et De, 2015).
1.2 Materials
The matrix of the composite studied in this master thesis is made of plastic, more specifically a thermoset resin. In this section, the classification of plastic is explained, then the composite polymer and graphene is introduced.
1.2.1 Plastic classification
Plastic plays a crucial role in a large number of industrial fields such as the automobile, aerospace, transport, and communication. Plastic, a general term for a range of synthetic or semi-synthetic polymer, is extensively applied to almost all the industries. The plastic mainly consists of thermoplastics, thermosets and elastomers families.
The term “plastic” is derived from a Greek word “plastikos” which means the act of molding and shaping (Starr, 2002). The reason behind this term is that plastic is soft and flexible, and in the process of manufacturing, it is molded and reshaped into many different structures such as films, fibers, plates, and bottles (Robertson, 2005). In the 21st century, plastics are
widely used to replace products made of fabric, wood, metal, glass, etc. as they featured as the optimal materials which are light-weight, chemically and mechanically resilient, easy to form and can accommodate many functional additives (Rhoades, 2008).
Polymers are long chains of molecules and they can be organized into two main types: natural polymer and synthetic polymer (Kutz, 2011). Synthetic polymers are classified as either thermoplastics or cross-linked polymers (JMG Cowie, 2007) as shown in Fig. 1.1. This study will focus on thermoplastics and thermoset polymers, which are a subset of crosslinked polymers.
7
Figure 1.1 The main categories of polymers Taken from Ouellette et Rawn (2015)
a. Thermoplastics and Thermosets
Thermoplastics are a class of plastics which exhibit a common set of physical properties. Thermoplastics can be formed into stable shapes by heat or pressure (D Hull, 1996). They can also be cast in a liquid form and exhibit no degradation of properties upon resolidification. The most common thermoplastics are polyethylene (PE), polypropylene (PP), polystyrene (PS) and polyvinyl chloride (PVC).
Thermoplastics, which could be reused and cost less than other types of plastic, constitute 75% of the global plastic consumption (Biron, 2018). Having widely been applied to several industries, thermoplastics have increasingly dominated the field of materials worldwide. Polyethylene (and its derivatives HDPE, LDPE, LLDPE) and polypropylene make up more than 60% of the total thermoplastic consumption and are mainly applied to the manufacture of packaging and household products (Beckman, 2018). Constituting 15% of total plastics, PVC has been the third most widely used kind of thermoplastic for manufacturing the materials in the construction industry, for example, pipe, frame or membrane (Beckman, 2018). The final products used in the market are plastic bags, building materials, consumer
products, electronics, and furniture. Figure 1.2 represents the percentage of worldwide utilization of thermoplastics, thermosets and elastomers.
Figure 1.2 The proportion of global use of plastics Taken from OBRC (2013)
Thermosets are the polymers capable of chemically reacting to form three dimensional (3D) cross-linked structures which cannot, after curing, change their shape by the application of heat (D Hull, 1996). The most well-known thermosets are epoxy, phenolic, polyurethane, and silicone. Thermosets are mainly used in the construction engineering, furniture, logistics, adhesives, electronic devices, inks, and coatings.
b. Plastics by application
Plastics are typically categorized by application. Common plastics are widely used due to their inexpensive source and manufacturing. In particular, polyethylene and polypropylene are the most well known for their applications in consumer products (Maddah, 2016). Engineering plastics, such as those studied in this thesis, are a more specialized class of polymers whose properties surpass those of common plastics and are typically used for the manufacturing of industrial goods (Council, 2005). Specialized plastics are designed for each
9
use case and are reserved for applications where critical material properties warrant a more expensive material design and manufacturing process (Drobny, 2014).
1.2.2 Thermoset polymer and resins
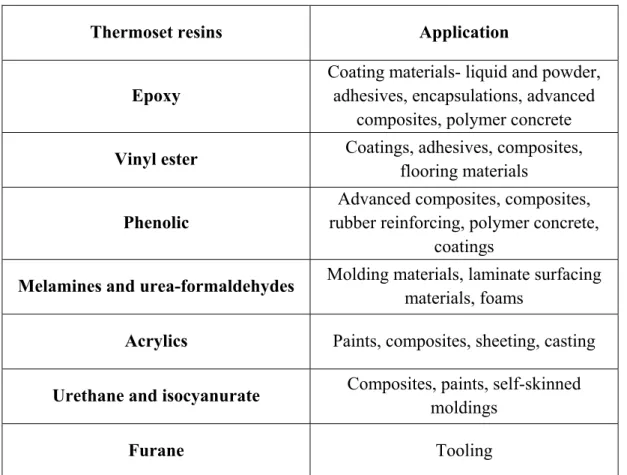
Due to the 3D cross-linked structure of thermoset polymers, the cannot be converted into the different forms by the application of heat (J-P. Pascault, 2002). Thermoset polymers are obtained by a wide range of cross-linking routes of linear pre-polymers or by the establishment of cross-linked networks from the reaction between two monomers (Saleem et al., 2016). In comparison to thermoplastic materials, thermosets are superior in strength, hardness, and thermal stability (P.E, 2006). To further enhance the quality of thermoset materials, fillers have been incorporated, including clays, carbon nanotubes, and graphene. The most well-known thermosetting polymers in construction materials are epoxies, vinyl ester resin, phenolic, melamine, and urea-formaldehydes, acrylics, urethane and furane. Table 1.1 shows that the thermoset resins are common in the coating industry.
Table 1.1 Summary of construction material applications for thermoset resins Taken from Pissis (2007)
Thermoset resins Application
Epoxy
Coating materials- liquid and powder, adhesives, encapsulations, advanced
composites, polymer concrete
Vinyl ester Coatings, adhesives, composites,
flooring materials Phenolic
Advanced composites, composites, rubber reinforcing, polymer concrete,
coatings
Melamines and urea-formaldehydes Molding materials, laminate surfacing
materials, foams
Acrylics Paints, composites, sheeting, casting
Urethane and isocyanurate Composites, paints, self-skinned
moldings
Furane Tooling
Approximately 90% of the thermosetting resins used in the structural composites are epoxy resins, polyesters, and vinyl esters (Loos, 2015). Table 1.2 gives information on the primary advantages and disadvantages of each type of resin.
11
Table 1.2 Compare three main of thermoset polymers Adapted from Loos (2015)
Thermoset polymer Advantages Disadvantages
Polyester
• Easy to handle • Cheaper resin than
epoxy and vinyl ester • High styrene emission • High shrinkage after cure Vinyl ester • High chemical resistance to the environment • Mechanical properties superior to polyester • More expensive than polyester • High content of styrene • High shrinkage after cure Epoxy • High mechanical and thermal properties • Superior resistance to humidity • Low shrinkage after cure • More expensive than vinyl ester and polyester resin • Mixture of
components is critical
1.2.3 Vinyl ester resin
Vinyl ester resins are unsaturated resins with the high performance which are made from the reaction of different epoxide resins with α-β unsaturated carboxylic acids (Gaur, 2014). The development of vinyl ester resin was to integrate the simplicity and affordable cost of polyesters into thermal and mechanical properties of epoxies. The similarity of vinyl ester resins and polyesters is the molecular structure, and the main difference is placed on location of their reactive groups, which are situated at the end of the chains (Hodgkin, 2001). Vinyl
ester resins are much more long-lasting and sturdy than polyesters because the length of the chains in the former is accessible to absorb impact loads (M.J. Mullins, 2012). The vinyl ester molecule is also characterized by fewer ester groups as shown in Fig. 1.3. These ester groups are likely to be affected by degradation via hydrolysis of water, which demonstrates that vinyl ester is more resilient to water and other chemicals than the polyester (Andreas Kandelbauer, 2013). As a result, it is extensively applied to transmission lines and chemical storages (Loos, 2015).
Figure 1.3 Chemical structure composition of vinyl ester resins Taken from Aghili (2016)
Vinyl ester (VE) based thermosetting polymers are found in a variety of applications thanks to their exceptional mechanical and corrosion resistant properties from their relatively low viscosity of the resin and capability to cure at ambient temperature(Atta, El-Saeed et Farag, 2006; Pauer, 2009; Thostenson, Ziaee et Chou, 2009). The material electrical conductivity is of great importance when it comes to the applications such as aerospace, electronics, adhesives and coatings. The use of a conductive filler, such as graphene, is required to increase the electrical conductivity of the material for those applications (Almajid et al., 2015).
13
1.2.4 Graphene
Graphene, in its original form, contains a single layer of carbon atoms arranged in a sp2
-bonded aromatic structure as shown in Fig. 1.4 and Fig. 1.5, respectively. It is found as the building block of graphite, where π-stacking of graphene sheets holds the lamellar graphite structure strongly in place with an interlayer spacing of 3.34 Å between the sheets (Hontoria-Lucas et al., 1995). To produce the single layers of graphene, graphite is exfoliated. The sequential cleavage of graphite to graphene employed the use of adhesive tape (Zhu et al., 2010). Geim and Novoselov manufactured the first single-layer graphene sheets (Perreault, Fonseca de Faria et Elimelech, 2015). Their research played an indispensable role in the understanding of the electronic properties of graphene, which was then awarded the Nobel Prize in Physics in 2010 (Geim, 2009; Novoselov, 2007).
Graphene exhibits a large number of exceptional properties which are ideal for some environment-inclined applications. One aspect of graphene which is intensively examined is its electronic properties (Castro Neto et al., 2009; Geim, 2009). Similar to any other nanoscale material, graphene has a high surface area. In theory, graphene exhibits the highest possible surface area, having the theoretical value of 2630 m2g-1, because each atom of a
single-layer graphene sheet participates in two surfaces (Sanchez et al., 2012). The high surface area of graphene allows it to be the perfect material for some processes such as adsorption or surface reactions. Graphene, additionally, is a great support to anchor chemical functionalities or nanomaterials. Graphene-based nanocomposites, therefore, have become the attractive field of research for novel materials (Compton et Nguyen, 2010).
Figure 1.4 The structure and main properties of graphene-based materials
Adapted from Changgu Lee (2008); Gómez-Navarro, Burghard and Kern, (2008); Park and Ruoff (2009); Sreeprasad and Berry (2013); Suk et al. (2010)
Figure 1.5 The 3D structure of graphene layer
However, some of these characteristics have been achieved only for the high-quality samples (such as mechanically exfoliated graphene) or graphene deposited on special substrates like
15
hexagonal boron nitride. When developing practical applications, there are three major concerns which need to be addressed: (1) the synthesis of high-quality crystals; (2) to functionalize efficiently functions to each case, and (3) to develop more exceptional applications for graphene (Kuldeep Singh, 2012).
Synthesis
There have been four distinct synthetic methods of graphene, including micro-mechanical exfoliation, chemical vapour deposition (CVD), liquid phase reduction of graphene oxide and epitaxial growth (Kuilla et al., 2010). Of these approaches, direct liquid phase exfoliation is the best to obtain low cost and high throughput material. Hummers and Offeman invented in 1958 what is now regarded as the primary method to create graphene oxide from graphene (Mohan et al., 2016). In this work key techniques were introduced for the production of graphene and its derivatives, which is shown in Fig. 1.6 (Mohan et al., 2018).
Figure 1.6 The Summary of Synthesis Techniques for Graphene
Adapted from E Malic (2013); Gadipelli and Guo (2015); Georgakilas (2014); Morris JE (2013); Subbiah Alwarappan (2013); Z (2015)
Mechanical properties
Through graphene is only one atom in thickness, it exhibits very high mechanical properties. It is considered the strongest material, with a Young’s modulus of E = 1.0 TPa and intrinsic strength of 130 GPa in its pristine, atomically perfect form (Changgu Lee, 2008). Those outstanding mechanical characteristics create the great interest in the application of graphene as a filler to strengthen the mechanical characteristics of softer materials (Potts et al., 2011). Graphene materials possess a large number of outstanding mechanical features, which are also very promising in nano-electromechanical applications. The latest research on the mechanical characteristics of graphene derivatives are shown in Table 1.3.
17
Table 1.3 Reported Mechanical Properties of Different Graphene Sources
Derivative Production
method Young’s modulus Reference
Graphene Mechanical exfoliation 1 TPa (Frank et al., 2007) Graphene Mechanical exfoliation 0.96 TPa (Faccio et al., 2009) Graphene Mechanical exfoliation 0.8 TPa (Changgu Lee, 2008) Graphene Mechanical
exfoliation 1.02 TPa (Kudin K, 2001)
Graphene Mechanical
exfoliation 1.1 TPa
(Van Lier et al., 2000)
Electrical properties
Electrons were observed to possess a high mobility in graphene, reaching 10 000 cm2 V-1 s-1
to 50 000 cm2 V-1 s-1 at room temperature (Fig. 1.4), with an intrinsic mobility limit of > 200
000 cm2 V-1 s-1 (Bolotin et al., 2008; Sreeprasad et Berry, 2013). Without scattering, these
charge carriers can be travel sub-micrometer distances and it is known as ballistic transport. Graphene is capable of maintaining current densities up to six order of magnitude higher than copper (Novoselov, 2007). Nevertheless, these electronic characteristics of graphene are only measured under certain conditions, with mechanically exfoliated graphene under vacuum (Bolotin et al., 2008). A number of reasons are attributed to the limitations of the electronic characteristics of graphene, including number of layers, the presence of defects, impurities, functional groups, the size and flatness of the sheet, and the nature of the substrate (Sreeprasad et Berry, 2013; Yang et al., 2010).
A summary of researches on the electrical characteristics of graphene materials is illustrated in Table 1.4. A range of polymer matrices from thermoplastic to thermoset, along with the different weight and volume percentage addition of graphene materials has been examined by various approaches and the results are impressive (Aguilar-Bolados et al., 2016; Mohan et al., 2015; Tang et al., 2012a).
Table 1.4 Literature review on electrical conductivity of different graphene derivatives
Derivative Production method Reduction/modifying agent Electrical conductivity (S.cm-1) Reference Gr Liquid exfoliation/Vacuum filtration
Hydrazine hydrate 1000 (Wang et al., 2010) Gr Liquid exfoliation Ammonia and
hydrazine 5.5
(Chenlu Bao 2012)
rGO Liquid exfoliation KOH 60 (Zhang et
al., 2012)
GNS Liquid exfoliation Hydroquinone (Wang et
al., 2008) fGO Liquid exfoliation Hydrazine and Pyrene
groups ~1000
(Su et al., 2009)
TrGO Liquid exfoliation Thermal reduction 80 (Worsley et
al., 2010)
(Gr: Graphene, rGO: reduced graphene oxide, GNS: graphene nanosheets, fGO: unctionalized graphene oxide, TrGO: Thermally reduced graphene oxide)
Thermal properties
Similar to the electrical conductivity, in theory graphene exhibits exceptional thermal properties. However, interfacial interactions and atomic defects can significantly reduce this property. Imperfections in the 2D lattice of graphene create sites for phonon dispersion, dramatically reducing the thermal conductivity. Table 1.5 illustrates literature data on the thermal conductivity values of different graphene materials.
19
Table 1.5 Literature review on thermal conductivity of different graphene derivatives produced by various methods
Derivative Production method Reduction/modifying agent Thermal conductivity (KW-1m-1) Reference Graphene Liquid
exfoliation Thermal reduction 1238
(Kumar et al., 2014) Single layer graphene CVD graphene - 52500 (Hong et al., 2012) Graphene - - ~ 5000 (Prasher, 2010) Pristine graphene CVD - ~ 5000 (Lee et al., 2011) Graphene Mechanical exfoliation - ~ 4840 - 5300 (Pei et Cheng, 2012)
(CVD: Chemical vapour deposition)
1.3 Fabrication and characterization methods
1.3.1 High shear mixer
This work employed a high shear mixer which is also called high shear rotor/stator mixer. The invention of high shear mixer made a breakthrough in the mixing technology, enhancing the processing and manufacturing industries globally. The targeted fields served with this machine are diverse, including food, pharmaceuticals, cosmetics, adhesives and chemicals. Almost all kinds of high shear mixers aim at accomplishing a shared set of objectives, namely homogenization, emulsification, powder wet-out and de-agglomeration. The dominance of the high shear rotor/stator mixer over the conventional mixers originates from the design of workhead, which makes the mixing process highly effective (Zhang, Xu et Li, 2012).
In the first stage, the rotor with the high-speed rotation creates a suction, which forces liquid and solid materials upwards to the workhead. The process moves on with the centrifugal force pushing the materials to the periphery of the workhead at which they are ground between the rotor blades and the stator. Following this step, an intense hydraulic shear happens when the materials are forced out of the stator and return to the mixture. Fresh materials are then pulled into the workhead, which repeats the cycle. The resulting process largely eliminates turbulent material flow and minimizes aeration (Utomo, Baker et Pacek, 2008).
There is a host of advantages a high shear mixer. For many applications, the advanced high shear mixer is manufactured with the capability of reducing mixing times up to 90 percent compared to conventional methods. The specifically-designed workhead allows each machine to perform a variety of functions simultaneously. For instance, in case of oil and water emulsions, a nearly instantaneous stable emulsion can be produced through the high shear mixer in comparison with other available mixers, which can find hard to form the emulsion by a stirrer or an agitator. In another example, thickening agents can be added quickly and form a clear agglomerate-free solution, whereas other conventional agitators require the rather slow and careful act of pouring thickening agents so that agglomerates could be prevented. The mixer can also be used for disintegrating and homogenizing large solids like any types of animal, mineral or synthetic original in a single operation (Kowalski, Cooke et Hall, 2011).
1.3.2 Morphological studies
a. Atomic force microscope (AFM)
An atomic force microscope (AFM) is used to image the micro and nanostructure of materials. AFM is a tool for observing the morphology and measuring the thickness of 3X and OX graphene sheets. In an AFM, a cantilever is attached to a sharp tip is used for scanning the sample surface. When the tip touches the sample surface, the force generated
21
between the tip and the surface make the cantilever move towards the surface. However, when the cantilever bends closer towards the surface, a controlled repulsive force is exerted on the cantilever to bend away from the surface. An AFM contains 3 crucial devices for different functions. The first instrument is a Z scanner to move the cantilever up and down. In order to move across the sample an XY scanner is employed. The position detector is also added to record the bending of the cantilever. The function of the position sensor is to track a laser beam reflected off the flat top of the cantilever. The direction of the reflected beam is changed if the cantilever is bent. The position detector records those beam changes to map the surface. An AFM records the topographic map of the sample surface by scanning the cantilever over some areas using a feedback loop to control the tip on the surface (Giessibl, 2003).
Unlike other microscopes providing a two-dimensional image of a sample, AFM provides a three-dimensional surface profile. Sample surfaces tested on AFM do not require any special treatments like metal or carbon coatings, which may cause the change or damage for the sample. Most of the AFMs can work efficiently in ambient air or even a liquid environment compared to some microscopes that require a high vacuum environment. AFM is also considered dominant as it provides atomic resolution in ultra-high vacuum and in liquid environments (Garcı́a et Pérez, 2002).
On the other hand, AFM still has some weak points that need to be fixed. The very first weakness is that AFM is the single size, which can only image a maximum height of 10-20 micrometers and a maximum scanning area of about 150 x 150 micrometers. Another limitation is the scanning speed. AFM requires a large amount of time for a typical scan, which causes the thermal drift in the image. Consequently, AFM is not the proper method for the measurement of accurate distances between topographical features. One more disadvantage is attributed to the hysteresis of the piezoelectric material and cross-talk between the x, y, z piezoelectric actuators, which can affect the AFM images, leading to the fact that the real topographical features can be flattened out. Like any other methods, the
image artifacts can be found by inappropriate tip, poor-quality environment or even by the sample itself (Meyer et Amer, 1988).
b. Scanning electron microscope (SEM)
A scanning electron microscope (SEM) is an accomplished device used for obtaining information on the surface of solid materials through the focused beams of electrons. Thanks to the high-solution and three-dimensional images provided by SEM, a great deal of data about the sample is revealed, including external morphology (texture), chemical composition, crystalline structure and orientation of materials (Joseph I. Goldstein, 2017).
An SEM is comprised of an electron gun, focusing lenses, a high vacuum chamber and a series of electron detectors. The electron gun generates a beam of high-energy electrons down the column and into a series of electromagnetic lenses to focus onto and raster across the sample. This process is conducted on a computer with the support of SEM operator to control magnification and identify the surface area to be scanned. The beam is focused onto the stage, where a solid sample is placed. Sample preparation for the sample is required before being put in the vacuum chamber. All samples require the capability of handling the low pressure inside the vacuum chamber. The acceleration rate of incident electrons, carrying significant amounts of kinetic energy, will determine the interaction between the incident electrons and the surface of the sample. When the interaction happens, energetic electrons are exposed from the surface of the sample. The scattered patterns give information in size, shape, texture and composition of the sample. Several detectors, including backscattered electrons and X-rays, are applied for attracting different types of scattered electrons. Backscatter electrons provide composition data regarding element and compound detection. The data about mineral can be found through X-rays emitted from beneath the sample surface (Reimer, 2013).
SEM is undoubtedly crucial in the fields that require the examination of solid materials. Due to the three-dimensional, topographical images and detailed information from different
23
detectors, SEM is widely applied for a range of areas, particularly on geological applications. For the most part, almost all SEMs are comparatively easy to operate. The available assistance of computer technology and associated software makes the operation much simpler for operators. The use of this technique is primarily limited by high equipment cost (Goldstein, 2017). In addition to the unit cost, SEMs must be operated in an environment where there is no interference of electricity, magnet and vibration. The requirement for maintenance is also demanding, which involves remaining a stable voltage, currents to electromagnetic coils and circulation of cool water. The preparation of samples can lead to the artifacts, making an adverse impact on the information processing. There is still no absolute way to eliminate or identify the potential artifacts (Goldstein, 2017).
1.3.3 Fourier Transform Infrared (FTIR) spectroscopy
Fourier Transform Infrared (FTIR) is a method used to measure infrared spectrum absorption. FTIR is a mathematical process to turn the data into a visual spectrum. In the infrared spectroscopy, infrared radiation passes through a sample. Some of the infrared radiation is absorbed by the sample and some of it is transmitted. The resulting spectrum shows the molecular absorption and transmission, which forms the molecular fingerprint of the sample. FTIR spectroscopy can be applied to identifying unknown materials, determine the quality or consistency of a sample and the amount of components in a mixture (Smith, 2011).
FTIR spectroscopy offers a number of advantages over other techniques. As all of the frequencies are measured at the same time and spectra are generated in a matter of seconds. The application of FTIR can substantially improve the molecular sensitivity. The noise levels have been observed far lower with the support of the detectors and the higher optical throughput. With regard to the mechanical property, as there exists only one moving part in the machine, the unit is low maintenance. These instruments also use a HeNe laser as an internal wavelength calibration standard which allows them to be self-calibrating (Smith, 2011).
1.3.4 Thermal properties
Thermogravimetric analysis (TGA) is a thermal analysis technique for measuring mass changes of a sample under the condition of raising temperature in a controlled atmosphere. From this measurement, two data sets can be obtained, which are weight loss-time and mass loss-temperature. Thermogravimetric analysis was carried out in a combined system Thermogravimetric/Differential Thermal Analysis (TG/DTA) (JD Menczel, 2009).
This instrument is the combination of a special furnace and a sensitive mass balance. DSC sensor is used to replace the scale pan. In order to limit the impact on the environment, the balance cell is thermostated. The balance beam is then attached to the TGA-DSC sensor. The sample and reference crucibles are set in the center of the furnace. Due to the support of thermal buoyancy and the purge gas flow, the horizontal design of the furnace is able to reduce the possibility of turbulence. Both sides of the furnace are protected with baffles, and the whole volume is purified by a constant flow of gas. The sample can also be purged with a reactive gas flowing through the capillary near the sample crucible. The volatile and gaseous combustion products from the sample, together with the purge gas and reactive gas remove from the furnace through the gas outlet on the left. The process finishes with the connection of analytical devices and the outlet to obtain the gas analysis (Broido, 1969).
A key strength of the TGA technique is its proven dual balance beam to provide drift-free baselines. The efficiency of the dual balance design minimizes the effects of changing purge gases and purge gas flow rates; reducing chimney and convection effects. The system is resilient to external disturbances such as temperature fluctuations and vibrations. High quality results can be obtained even for very low mass weight loss events. With the horizontal balance design of TG/DTA, the gas flow and the weight direction are perpendicular. Consequently, the purge gas flows will cause a limited amount of effect even at rapid purge rates up to 1000 mL/min. Highly condensable or oily volatiles are measured by high purge gas flow since they are purged from the DT-TGA instrument before significant condensation. The act of introducing the corrosive or special purge gases into the furnace
25
tube helps to minimize the damage to the balance assembly and electronics. Additionally, the maintenance cost and time is reduced by the light weight replaceable parts (Doyle, 1961).
1.3.5 Tensile property
The capacity to minimalize the breakage under tensile stress is one of the most pivotal measured properties of materials for structural applications. In order to quantify this property, the maximum force per unit area (MPa or psi) is measured, known as the ultimate tensile strength or tensile strength at break. The speed at which the sample is pulled apart in the test can be varied between 0.2 and 20 inches per minute and this will have an influence on the results. For the test, composite samples are either manufactured from the stock shapes or injection molded. The machine used to test the tensile strength pulls the samples from both sides and then measures the force required while simultaneously measuring the strain before breaking (Kim et al., 2006).
With this ultimate tensile strength measured, the material characteristics are identified, which allows the materials engineers to forecast whether the materials will react favorably in their designed applications (D Gay, 2007). The data obtained from the tensile test can be also utilized to determine batch quality and consistency in manufacture. However, there are some factors influencing tensile strength such as the effect of additives and impurities, temperature, geometric size and shape of samples, gauge length, orientation and morphology, and surface condition (Zhang et al., 1999).
1.3.6 Electrical properties
a. Four-point probe test
Electrical resistivity is the fundamental material characteristic, which determines the material’s opposition to the current flow. The material’s resistivity relies on some factors, including the material doping, processing, and environmental factors such as temperature
and humidity. Some characteristics, namely the series resistance, threshold voltage, and capacitance can be influenced by the material’s resistivity (Archie, 1942).
A four-point probe is a suitable equipment to quantify the resistivity of semiconductor samples. To measure the substrate resistivity, a current is passed through two outer probes and the voltage is measure through the inner probes (Smits, 1958).
The method of the four-point probe is conducted by contacting four equally spaced probes with a material of unknown resistance. There is a DC current set between the outer two probes, and a voltmeter is employed to test the voltage between the inner two probes. The calculation of the resistivity depends on several factors such as the geometry, the source current and the voltage measurement. To simplify measurements, integrated parameter analyzer accompanied by control software is applied for a variety of material resistances including very high-resistance semiconductor materials (Smits, 1958).
Even though the principle is simple, some experimental problems are still taken into consideration when using a four-point probe. The application of metal into a semiconductor generates a Schottky diode rather than an ohmic contact. The samples with very high or very low resistivity require the modification of the drive current to get the reliable reading. Samples with cut or lapped surfaces are more easily measured than those with polished surfaces (Smits, 1958).
To quantify the resistivity of thin, flat materials including semiconductors or conductive coatings, a four-point collinear probe together with a parameter analyzer has been successfully applied. A few parameter analyzers provide built-in configurable tests, which require the proper calculations. The possibilities of defects such as electronics interference, leakage current, and environmental factors like light and temperature need to be also taken into account to ensure the proper measurements (Schuetze et al., 2004).
27
The primary advantage of sheet resistance compared to other methods of measuring resistance is that it is independent of the size of the square, which allows the consistent comparison between samples. With the assistance of a four-point probe, it can be easily measured. Another significant strength of using a four-point probe is the contact and wire resistances can be eliminated from the measurement (Schuetze et al., 2004).
Figure 1.7 Schematic four-point probe and BDS (dark polygon represents the graphene black, and maroon shows the electron)
b. Broadband dielectric spectroscopy
Broad band dielectric spectroscopy (BDS) is a experimental technique for the purpose of studying the dynamics of polymeric systems. In its current form, BDS can collect data on frequency ranges from 10-3 Hz to 109 Hz, extending both limits to lower and higher values (F
Kremer, 2012).
Broadband dielectric spectroscopy (BDS) measures the interaction of electromagnetic waves with the frequency range from 10-6 Hz to 1012 Hz. The substantially wide frequency range
polarization effects and the dielectric properties of different materials in both liquid and solid form. The versatility of BDS has made it the primary technique in the multidisciplinary design, characterization and application of materials in various fields from nanotechnology to biology (F Kremer, 2012).
BDS quantifies the dielectric permittivity as a function of frequency and temperature. It can also be used to non-conducting materials. The frequency ranges from 10-6 Hz to 1012 Hz.
BDS is sensitive to dipolar species and localized charges, and it determines their strength, their kinetics and their interactions. Dielectric spectroscopy, therefore, is an influential device for measuring electrical properties of non-conducting and semiconducting materials (Kremer, 2002).
Dielectric spectroscopy is based on the interaction of an external electric field with the electric dipole moment and charges of the medium (Stannarius, Kremer et Arndt, 1995). The information on dielectric spectroscopy can be analyzed through a wide range of ways: (i) in terms of dielectric permittivity, (ii) in terms of AC conductivity, (iii) in terms of electric modulus, and (iv) in terms of complex impedance. Those four methods can be applied to identity and analyze the recorded electrical characteristics. In some circumstances, however, a certain method could be more impactful to extract data. The dielectric data, therefore, should be measured in more than one way, especially in the case of the examination of a complicated material as in a nanocomposite.
Due to the high sensitivity with decreasing domain size and wide dynamic range, dielectric spectroscopy has been beneficial in the research of polymer dynamics and in confining geometries. The dielectric characteristics of graphene (dielectric constant, dielectric permittivity, etc.) including polymer nanocomposites are remarkably impacted by the aspect ratio of the graphene and its interfacial adhesion with the polymer matrix (Petzelt et al., 2013).
29
1.4 Review of the measured properties of polymer composites with graphene
In this section, a thorough investigation of preparing graphene-based polymer composites, including melt blending, solution blending or in-situ polymerisation methods was made. The electrical, thermal and mechanical characteristics are shown to incorporate more effectively with graphene-based filler materials. A list of different graphene based composites and their ultimate tensile strength (UTS) are given in Table 1.6. Electrical conductivities, thermal conductivities of different graphene reinforced polymer composites are given in Table 1.7 and Table 1.8, respectively.
Table 1.6 Literature review on different nanocomposites showing the tensile with respective fabrication methods
Nanocomposites Filler
loading
Fabrication
method UTS (MPa) Reference
PS/Graphene 1 wt.% Solution
casting 42.5
(Fang et al., 2009)
PP/Graphene 10 wt.% Melt blending 24 (Song et al.,
2011) PVDF/Graphene 5 wt.% Solution casting 100 (Layek et al., 2010) PVA/Graphene 2 wt.% Solution casting 42 (Wang et al., 2011)
PVA/Graphene 0.7 wt.% In-Situ 85 (Liang et al.,
2009)
Table 1.7 Literature review on electrical conductivity values of different polymer graphene composites
Nanocomposites Filler loading Fabrication method Electrical conductivity (S.cm-1) Reference
Polystyrene/Graphene 5 vol.% Solution casting 1 (Wu et al.,
2013)
PET/Graphene 3 vol.% Melt blending 0.1 (Zhang et al.,
2010) Polyurethane/Graphene 0.015, 0.02, 0.025 vol.% Melt blending/Solution casting/In-Situ 0.0001 (Kim, Miura et Macosko, 2010)
Polyester/Graphene 1.5 vol.% Solution casting 1 (Tang et al.,
2012b) EVA/Graphene 15 wt.% Melt blending/Solution casting 1x 10⁻⁷ (Azizi et al., 2018)
31
Table 1.8 Literature review on polymer graphene nanocomposites showing their respective thermal conductivity
Nanocomposites Filler
loading Fabrication method
Thermal conductivity
(WK-1m-1)
Reference
Epoxy/Graphene 4 wt.% Mechanical stirring
and Ultrasonication 1.6
(Teng et al., 2011)
Polyester/Graphene 1.5
vol.% Solution casting 0.55
(Tang et al., 2012b)
Polypropylene/Graphene 2 vol.% Melt blending 0.4 (Song et al.,
2011) Epoxy/Graphene/Silver hybrid 5 wt.% High-shear mixing/Ultrasonicatio n/In-Situ 10 (Goyal et Balandin, 2012)
PVDF/Graphene 10 wt.% In-Situ 0.58 (Yu et al.,
2011)
(PVDF: Polyvinylidene difluoride)
1.5 Application of vinyl ester resin and graphene in coating
In this thesis, the physical properties and synthesis route for a novel vinyl ester resin and graphene nanocomposite material are explained. As previously state, vinyl ester resin is among the class of thermoset polymers which, despite their more complicated forming requirements and low recyclability, see use in a variety of fields. This is primarily due to their increased mechanical properties compared to thermoplastic polymer alternatives. The interest in adding graphene as a filler is twofold: to further improve the mechanical properties of the resin to appeal to existing markets, and to develop new applications through the addition of a new property to the composite, electrical conductivity.
Polymers which exhibit some degree of electrical conductivity are already common in multiple industries. They are used as coatings and additives in a variety of applications,
including integrated de-icing and security coatings for vehicle glass (Mcmaster, 1942) and antistatic coatings for textiles (Gregory et al, 1991). The proposed vinyl ester resin – graphene nanocomposite described herein offers a further alternative in the range of electrically conducive materials for coatings which offers advantages in mechanical stability compared to conventional technology. This material is applicable to many of the same fields as conventional conductive polymers, such as electrical grounding coatings for equipment and factory floors and to electromagnetic shielding applications such as for electrical devices to reduce reception and transmittance of radio interference (Williams et al, 2017).
CHAPTER 2
MATERIALS AND METHODS
2.1 Introduction
This chapter describes the experimental materials, procedures and test methods used through the thesis. Scheme in Fig. 2.1 shows a summary of the work in this master thesis. During the experimental process, the fabrication and tests were carried out on two types of thermoset resin: vinyl ester resin and bio-epoxy resin. The coating with vinyl ester resin was made with graphene 3X and the coating with bio-epoxy with graphene OX. Although graphene black OX exhibits higher electrical conductivity in pure state than graphene black 3X, a very low electrical conductivity in the bio-epoxy composites were measured due to the poor compatibility with the bio-resin matrix as shown with electron imaging. Therefore, the main focus of the thesis is on the experiments and results of vinyl ester resin/graphene black 3X composite materials. The content of bio-epoxy/graphene black OX is included in the section Appendix I as complementary measurements.
2.2 Materials
The constituents of the composites synthesized are vinyl ester resin, methyl ethyl ketone peroxide (MEKP) and graphene black 3X.
2.2.1 Vinyl ester resin
Vipel F010-TBN is a mixture of epoxy-based vinyl ester resin and bisphenol A as a high corrosion resistant additive and fire retardant (molecular weight: ∼10,000 to 15,000). The material was supplied by AOC, LLC (USA). The designation codes and characteristics of the vinyl ester resins are shown in Table 2.1.
Table 2.1 Characteristics of the vinyl ester resin
2.2.2 Hardener
As recommended by the manufacturers, the curing of the resin employed a catalyst of methyl ethyl ketone peroxide (MEKP) or Luperox DDM-9 as shown in Fig. 2.2. The use of methyl ethyl ketone (MEK) as a dissolution enables the graphene to disperse in the resin.
Designation code Vipel F010-TBN segment Melting point (oC) Boiling point Specific Gravity (g/cm3) Molecular weight Content (wt.%) F010-TBN-28 10,000 to 15,000 28 -23.8 F/-30.6 oC F/145 293 oC 1.03
35
Figure 2.2 Chemical structure of MEKP
Methyl ethyl ketone peroxide, which is also called 2-butanone peroxide, is proven to be an intensely oxidizing (caustic) organic peroxide that is used as a room temperature hardening and curing agent for fiberglass-reinforced plastics and unsaturated polyester resins (HCN, 2002; NTP, 1993).
As MEKP is used as a hardening or curing agent, the period of the reaction largely depends on the types of resins which are being cured and on the formulation of the MEKP. The average reactions consist of 1 to 2% MEKP (CI, 1999). The length of the curing time was approximately 40 – 50 minutes with formulations of commercial MEKP. The curing time is defined as the duration until the resin reaches its peak temperature around 177oC (350oF),
which is not necessarily the end of the reaction (Puckett, 1997).
2.2.3 Graphene
Graphene Black 3X (G3X) was received from NanoXplore (Canada). Through the technical data sheet of NanoXplore, Graphene Black 3X is seen as a practical powder with the typical flake size of 40 μm. Figure 2.3 presents some main applications of graphene such as heat dissipation, EMI shielding, gas barrier, UV resistance, conductive inks and coatings, battery electrodes, ESD and antistatic.
Figure 2.3 The application of graphene black 3X in the industry (Technical data sheet from NanoXplore)
Physical and chemical properties are illustrated in Table 2.2 and Table 2.3 as following the NanoXplore technical data sheet.
Table 2.2 Physical properties of graphene black 3X
Property Value
Particle size (laser diffraction) D50=38 μm
Number of layers 6-10
Bulk density 0.18g/cm3
Solubility Insoluble
Moisture (TGA) <0.7 wt.%
Peak decomposition temperature 750oC
Table 2.3 The graphene black 3X chemical composition values
Element Value
Carbon >91 at.%
Oxygen <7 at.%
Sulfur <0.5 at.%
37
2.3 Processing the preparation of vinyl ester resin/graphene composites
Vinyl ester resin/Graphene black 3X composites was prepared at different graphene concentrations by dispersing graphene in vinyl ester resin and subsequently cross-linked the resin using DDM-9. A visualization of the synthesis process is given in Figure 2.4.
Figure 2.4 Fabrication process of vinyl ester resin/graphene black 3X composite
Vinyl ester resin (VSR)/Graphene black 3X (G3X) composites with different contents: 1, 2.5, 5, 7, 10, 15, 20 wt.% were prepared as follows: a defined graphene content was mixed with 200 grams of vinyl ester resin using high shear rate mixer machine for 30 min with the speed of 5000 rpm. The mixture was then degassed for 30 min under vacuum to remove the air bubbles. Afterwards, 1.5 wt.% of the curing agents Luperox DDM-9 was gradually added into the composite and is molded between two teflon plates. The hot pressure machine is then used to harden the given mixture at 60oC under the pressure of 2 MPa for 2 h. The Table 2.4