T
T
H
H
È
È
S
S
E
E
En vue de l'obtention du
D
D
O
O
C
C
T
T
O
O
R
R
A
A
T
T
D
D
E
E
L
L
’
’
U
U
N
N
I
I
V
V
E
E
R
R
S
S
I
I
T
T
É
É
D
D
E
E
T
T
O
O
U
U
L
L
O
O
U
U
S
S
E
E
Délivré par l'Université Toulouse III - Paul Sabatier Discipline ou spécialité : Géologie – télédétection
JURY
Dr. Stanislav OPLUŠTIL - Université Charles à Prague - Président du jury Prof. John M. MILLER - Université d'Australie-Occidentale - Rapporteur
Dr. Guillaume MARTELET - BRGM - Rapporteur
Dr. Eric de KEMP – Ressources naturelles Canada - Rapporteur Prof. Jean-Luc BOUCHEZ - GET, UPS - Examinateur Dr. Bohdan KŘÍBEK - Service géologique tchèque - Examinateur
Prof. Mark W. JESSELL - GET, IRD - Directeur de thèse Dr. Josef JEŽEK - Université Charles à Prague - Directeur de thèse
Ecole doctorale : Sciences de l'Univers, de l'Environnement et de l'Espace Unité de recherche : GET
Directeur(s) de Thèse : Mark JESSELL, Josef JEŽEK
Rapporteurs : John M. MILLER, Guillaume MARTELET, Eric DE KEMP
Présentée et soutenue par Václav METELKA Le 22. Septembre 2011
Titre : Application des méthodes de géophysique et de télédétection à l’analyse du
Charles University in Prague
Faculty of Science
University of Toulouse III
Paul Sabatier
Institute of Geology and Palaeontology Geosciences Environment Toulouse
Study program: Geology-geological sciences Specialty: Geology-remote sensing
Václav Metelka
Geophysical and remote sensing methodologies applied to
the analysis of regolith and geology in Burkina Faso,
West Africa
Aplikace geofyziky a dálkového průzkumu Země ve studiu regolitu a geologické stavby
Burkiny Faso, Západní Afrika
Application des méthodes de la géophysique et de télédétection à l’analyse du régolithe et de
la géologie du Burkina Faso, Afrique de l’Ouest
Prohlášení:
Prohlašuji, že jsem závěrečnou práci zpracoval samostatně a že jsem uvedl všechny použité informační zdroje a literaturu. Tato práce ani její podstatná část nebyla předložena k získání jiného nebo stejného akademického titulu.
V Praze, 27. 6. 2011
Acknowledgements
This work was carried out as a co-tutelle between the Charles University in Prague and Université Toulouse III – Paul Sabatier. I would like to acknowledge the support of both Universities and the French Government. A substantial part of this work would not have been made possible without the aid and support of the WAXI (West African eXploration Initiative) project. During the course of my Ph.D., I have met many people, who have helped me and encouraged me.
I would like to thank Mark Jessell and Lenka Baratoux, who have taken the great risk of accepting me as a student and passed onto me some of their knowledge of modern geology. My thanks belong in the same manner to Josef Ježek, who supported me and provided critical comments to all of the manuscripts. I acknowledge John Miller, Guillaume Martelet, and Eric de Kemp, who kindly accepted to review this thesis. I also want to thank D. Chardon, B. Kříbek, C. McCuaig, K. Martínek, F. Laufek for helpful discussions during the course of the work and Seta Naba for helping in addition to his ideas during the fieldwork in Burkina Faso.
I also need to mention the people at BEAK consultants, who harbored me for several weeks and aided me during my work with neural networks. Thanks goes to Andreas Barth, Andreas Knobloch, Silke Noack, Mathias, Sabine and others. I have been always welcomed at IRD in Burkina Faso, where I have spent a good month during the course of my fieldwork. Equally important was the support from the Czech geological survey.
I have to put forward my family, my parents Václav and Jaromíra, my sisters and their families, my dear aunt Marie, and all of my relatives. They have all supported me immensely.
I am as well indebted to the mining companies SEMAFO, Volta Resources, Avocet Mining, Sanu Resources, and Orezone for providing high-resolution geophysical data, borehole cores, and outcrop maps. I acknowledge in particular M. Crevier, D. Bondé, D. Boisvert, L. Ouedraogo, P. Marquis, A. Zongo, O. Derra, C. Diallo, T. Amoah, and A. Naré for providing us support when conducting fieldwork on the permits of their companies.
I have to acknowledge all of the IRD drivers, who helped us getting around Burkina sometimes to almost unreachable locations without any problems; thank you Salifou, Boukary, and Mathieu.
Cheers to all of my friends both in Czech Republic - Ondra, Petra, Jonáš, Zdenička - I am much obliged for help with translations, Eliška, Igor, Jirka, Jára, Jaruška, DB, Veronika, Katka, and in France - Ana, Tere, Elena, Laurent, Joaquin, Stéphane - thanks for French corrections, Mark, Chris, Herman, David, Camille, Laia and many, many others.
Table of contents
Acknowledgements... I
Table of contents ... II
List of figures... V
List of tables ... IX
List of acronyms ... XI
Abstract ... XIII
Abstrakt ... XIV
Résumé ... XV
INTRODUCTION AND BACKGROUND ... 16
Introduction et contexte général ... 17
CHAPTER I ... 34
Résumé du chapitre I ... 35
A GEOPHYSICALLY CONSTRAINED LITHO-STRUCTURAL ANALYSIS OF THE
EBURNEAN GREENSTONE BELTS AND ASSOCIATED GRANITOID DOMAINS,
BURKINA FASO, WEST AFRICA ... 38
1. Introduction ... 39
2. Regional geological setting ... 40
2.1. The Baoulé-Mossi Paleoproterozoic domain ... 40
2.2. Western Burkina Faso ... 42
3. Methodology and data use ... 43
3.1. Airborne magnetometry ... 43
3.2. Airborne gamma ray spectrometry ... 45
3.3. Gravimetric data... 45
3.4. Remote sensing data ... 46
3.5 Geological outcrop data ... 47
3.6 Digital data integration ... 49
4. Structural framework ... 51
5. Lithological associations and structures: their petrophysics and expression in geophysical data . 52 5.1. Mafic and ultramafic lithologies ... 53
6.1. Lithologies and structures ...69
6.2. Strengths and weaknesses of the different datasets ...71
6.3 Implications for geological evolution of the West African Craton ...72
7. Conclusions...73
CHAPTER II... 75
Résumé du chapitre II ... 76
JUVENILE PALEOPROTEROZOIC CRUST EVOLUTION DURING THE
EBURNEAN OROGENY (~2.2–2.0 GA), BURKINA FASO, WEST AFRICA ... 80
1. Introduction...81
2. Geological Setting ...83
2.1. Regional geological framework ...83
2.2. Distribution of the greenstone belts and granitoid domains ...88
3. Main lithologies and stratigraphy ...89
3.1. The Boromo belt ...89
3.2. The Houndé belt ...91
3.3. The Banfora belt ...92
3.4. Tarkwaian-type metasediments ...92
3.5. Granitoids ...94
4. Geochemistry of volcanic belts ...96
5. Structural Evolution ... 100
5.1. Deformation phase D1 ... 100
5.2. Deposition of Tarkwaian-type sediments – Late D1... 102
5.3. Deformation phase D2 ... 103
5.4. Deformation phase D3 and post-Eburnean doleritic dykes ... 105
6. Deep Structure ... 107
6.1. Construction of the models from gravity data ... 107
6.2. Results ... 108
7. Discussion ... 111
7.1. Origin of the greenstone belts ... 111
7.2. Origin of the sedimentary and volcano-sedimentary units ... 112
7.3. Tectonic scenario and mineralization events ... 114
7.4. Geodynamic implications ... 117
8. Conclusions... 119
CHAPTER III ... 121
Résumé du chapitre III ... 122
VISIBLE AND INFRARED SPECTRAL LIBRARY OF PRECAMBRIAN
GRANITE-GREENSTONE TERRAINS IN BURKINA FASO, WEST AFRICA ... 126
1. Introduction... 127
2. Description of sampling area and sampled materials ... 128
4. Sample measurements and sample preparation ... 132
5. Library description ... 135
6. Spectra description ... 135
6.1 Mafic and intermediate rocks... 135
6.2 Granitoids ... 136
6.3 Volcano-sediments ... 139
6.4 Tarkwaian-type sediments ... 139
6.5 Taoudeni basin sediments ... 139
6.6 Soils and regolith ... 140
7. Discussion ... 142
8. Conclusions ... 144
CHAPTER IV ... 146
Résumé du chapitre IV ... 147
REGOLITH LANDFORM MAPPING USING AIRBORNE GEOPHYSICS AND
REMOTE SENSING DATA IN A NEURAL NETWORK, BURKINA FASO, WEST
AFRICA ... 150
1. Introduction ... 151
2. Study area description ... 152
3. Methodology and data use ... 155
3.1 Data preprocessing ... 155
3.2 Training-testing data selection ... 157
3.3 Variable definition ... 160
3.4 Classification ... 163
3.5 Accuracy assessment ... 164
4. Results ... 165
4.1 Neural network classification ... 165
4.2 Comparison between all classification scenarios ... 167
5. Discussion ... 170
5.1 Comparison with the existing maps ... 170
5.2 Perspectives for automated regolith landform mapping ... 171
6. Conclusions ... 172
List of figures
Figure 1 Simplified geological map of the West African Craton (modified after BRGM SIGAfrique); the Paleoproterozoic greenstones are divided into: light grey – intermediate to acid volcano-clastics and volcano-sediments, dark grey – mafic to intermediate lavas and volcanic products...19
Figure 2 A typical lateritic profile with all regolith facies preserved. (Eggleton, 2001)...21
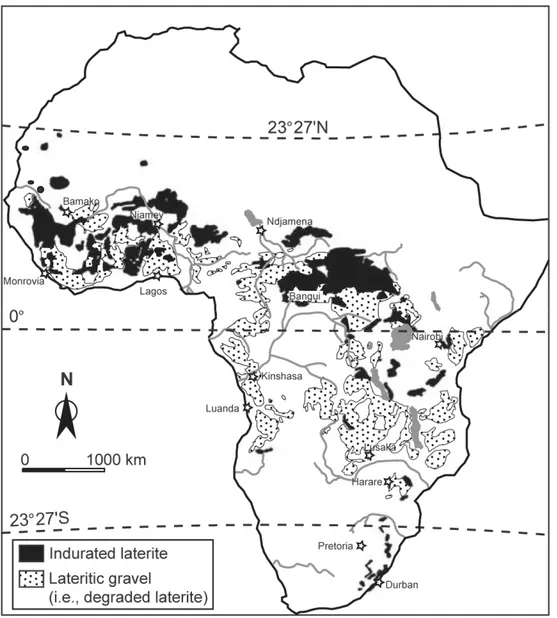
Figure 3 Distribution of laterites, bauxites, and lateritic soils in Africa, modified from Burke and Gunnell (2008). ...22
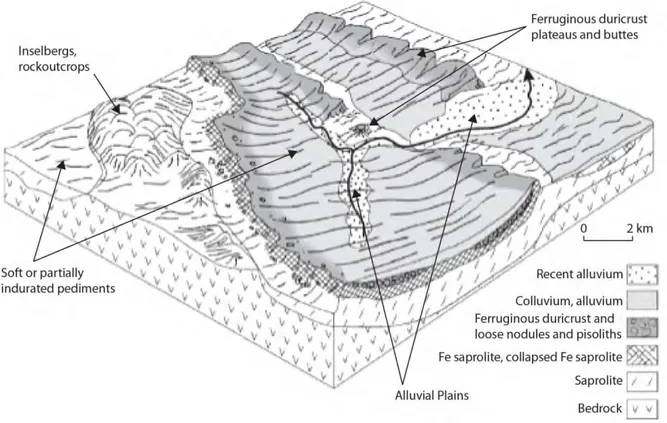
Figure 4 A block diagram with typical regolith landforms found in Western Australia and common to West Africa modified after Anand and Paine (2002). ...23 Figure 5 (A) Lateritic regolith surfaces of West Africa; (B)Variations in the spatial extent of lateritic regolith surfaces of West Africa modified after Burke and Gunnell (2008). ...24
Figure 6 Flow Chart of Integrated analysis of remote sensing and traditional field data during geological or regolith landform mapping projects; object in grey belong to traditional field-based mapping, while white object incorporate remote sensing data, modified from Schetselaar et al. (2007). ...27
Figure 7 The electromagnetic spectrum, with regions relevant to remote sensing techniques depicted; VIS-visible, NIR-near infra red, SWIR-short wave infrared, TIR-thermal infrared, C,S,L,P-Band-categories of frequency (wavelength) ranges for radar sensors. ...28
Figure I-1 Schematic maps of the study area. (a) – Simplified geological map of the Leo-Man craton (modified after BRGM SIGAfrique) with the zone of interest outlined; the Paleoproterozoic greenstones are divided into: light grey – intermediate to acid volcano-clastics and volcano-sediments, dark grey – mafic to intermediate lavas and volcanic products. (b) – Simplified geological map derived during this study (Burkina Faso), Ivory Coast area modified after Tagini (1972) and Lüdtke et al. (1998), Ghana area modified after Agyei Duodu et al. (2010); names of the greenstone belts and granitoid domains discussed in the text are displayed; and major shear zones are outlined. ...39
Figure I-2 (a) – Reduced to the pole (RTP) residual magnetic intensity (RMI) grid; (b) – first vertical derivative of the RTP corrected RMI grid overlain by interpreted structures; (c) – Gamma ray ternary grid – corrected absolute concentrations displayed as RGB underlain by the SRTM digital elevation model; (d) – Bouguer anomaly gravimetric grid with an overlay of interpreted structures...44
Figure I-3 Outcrop map of the study area. Points indicate field-observations from different source databases; polygons outcrop maps and high resolution geophysical data. Outcrop database this study – all points - lithology, detailed structural description and measurement data, selected points – petrography, susceptibility, density, geochemistry; BRGM/BUMIGEB 1 database – all points lithology, selected points – structural measurements and outcrop description, petrography, geochemistry; BRGM/BUMIGEB 2 database – four lithological classes – volcanic, granitoid, sediment, quartz dykes. ...47
Figure I-4 Data analysis scheme; PCA – principal component analysis transformation of the airborne gamma ray data; 2¾ D modeling performed on the gravimetric data (detailed description is given in the companion paper (Baratoux et al., submitted). SRTM – Shuttle Radar Topography Mission, BRGM – Bureau de recherches géologiques et minières, BUMIGEB – Bureau de Mines et Géologie du Burkina Faso, ASTER – Advanced Spaceborne Thermal Emission and Reflection Radiometer. ...49
Figure I-5 Histograms of magnetic susceptibility of selected rock groups. ...52
Figure I-6 Box and whiskers graphs of concentrations of K, eTh and, eU extracted from the airborne data based on locations of selected outcrops and regolith units. bas – basalt, gbr – gabbro, and – andesite, pyr – pyroclastic flow, vs – volcano-sediments, Tkw – Tarkwaian-type sediments, me – magmatic episode, dur – Fe-rich duricrust, spe – soft pediment. ...53
Figure I-7 Litho-structural map with the position of four key areas depicted as insets. ... 64
Figure I-8 Key localities showing details from map shown in figure I- 6. Upper map: RTPRMI (Reduced to the pole residual magnetic intensity) color overlay over first vertical derivative (grey-scale); Intermediate: ternary grid of the airborne gamma ray data or PCA grid; Lower map: geological interpretation. (a) – The western margin of the Boromo belt and the eastern margin of the Houndé belt; (b) – The eastern margin of the Boromo belt and the Koudougou-Tumu granitoid domain ; (c) – The Banfora belt; (d) – The contact zone between the western margin of the Houndé belt and the Sidéradougou GD. HI – high intensity, MI – medium intensity, LI – low intensity, BAS – basalt, GBR – gabbro, AND – andesite, VS – volcano-sediment, TKW – Tarkwaian-type sediments, DOL – doleritic dyke, SPE – soft pediment., DUR – Fe-rich duricrust, intr. – intrusion, w. lith. bnd. – with lithological boundary, subcirc. – subcircular, mag. – magnetic. ... 67
Figure II-1 Simplified geological map of the Leo-Man Craton (modified after the BRGM SIGAfrique map, Milési et al., 2004), with the study area indicated. Paleoproterozoic greenstones are divided into: light grey – intermediate to acid volcaniclastics and volcanosediments, dark grey – mafic to intermediate lavas and volcanic products. ... 82
Figure II-2 Revised geological map of the western Burkina Faso (chapter I). The names of the greenstone belts, granitoid domains (GD) and major Birimian (volcano-) sedimentary units referred to in the text are indicated. Radiometric ages are taken from the following sources: (1) Agyei Duodu et al., 2010; (2) Bossière et al., 1996; (3) Castaing et al., 2003; (4) Davis in Schwartz and Melcher, 2003; (5) Lompo, 1991; (6) Lüdtke et al., 1998; some of these ages also published in Hirdes et al., 1996; (7) Siegfried et al., 2009; (8) Thomas et al., 2009. Dating methods U-Pb (U), Pb-Pb (P), K-Ar (K), and Ar-Ar (A) were applied on zircon (z), monazite (m), t – titanite (t), and amphibole (a). The following sources were used for compilation of the geological map: (A) this work; (B) Lüdtke et al., 1998; (C) Tagini, 1972; (D) Agyei Duodu et al., 2010. BA – Banfora, BO – Boromo, BOBO – Bobo-Dioulasso, BT – Batié, DA – Dano, DE – Dédougou, DIE – Diébougou, GA – Gaoua, HO – Houndé, MA – Mana, KA – Kampti, KO – Koudougou, LE – Léo, LO – Loropéni, PE – Perkoa, PK – Ponkélé, PO – Poura, SA – Safané, SID – Sidéradougou, TU – Tumu. GFBSZ – Greenville-Ferkessedougou-Bobo-Dioulasso shear zone (SZ), OFSZ – Ouango-Fitini SZ, BPSZ – Boromo-Poura shear corridor, WBSZ – West Batié SZ. ... 87
Figure II-3 a) Simplified stratigraphic sequences for the Banfora, Houndé and Boromo belts with the names of the corresponding belts in Ivory Coast and Ghana. Katiola-Marab. – Katiola-Marabadiassa belt. TH – tholeiitic mafic units, THM – tholeiitic megacrystic basalts, TRAN – transitional mafic and intermediate volcanic sequences, CA – calc-alkaline volcanic sequences. b) Radiometric age frequency histograms for Boromo-Lawra-Bole-Nangodi (BLBN) and Houndé-Téhini-Ouango-Fitini (HTOF) greenstone belts (GB) and Koudougou-Tumu (KTGD), Diébougou (DGD) and Sidéradougou (SGD) granotoid domains. The ages shown in the histograms are plotted in figure II- 2. Only U-Pb and Pb-Pb zircon and whole rock ages are taken into account. Note that no radiometric ages exist for the Banfora belt, the Niangoloko granitoid domain and adjacent areas in northern Ivory Coast. ... 90
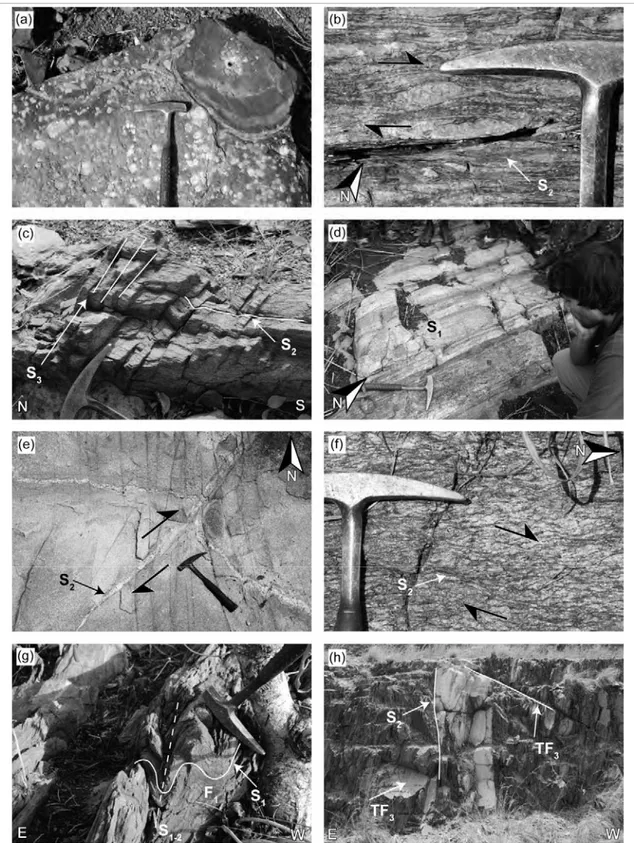
Figure II-4 Field photographs of representative structures: a) tholeiitic basalts with plagioclase megacrysts forming pillow lavas, b) megacrystic basalts deformed in the ENE-oriented dextral GFBSZ (Greenville-Ferkessedougou-Bobo Dioulasso shear zone) in the north of the Boromo belt, near Ponkélé (horizontal section), c) penetrative metamorphic foliation S2 in Tarkwaian-type metasediments affected by late steeply dipping spaced cleavage S3, d) steeply dipping NE-trending penetrative magmatic foliation S1 in syntectonic tonalite pluton, e) localized ENE-WSW dextral shear zone S2 in granodiorite, filled by
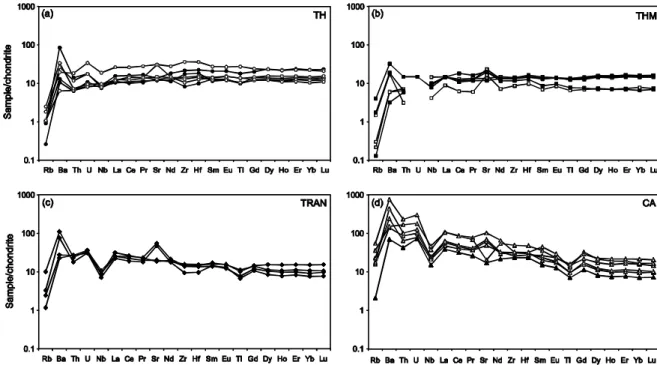
Figure II-6 Spiderplots of the four groups a) tholeiites, b) megacrystic basalts, c) transitional basalts and andesites and d) calc-alkaline basalts and andesites, normalized to chondrite (McDonough and Sun, 1995). Black symbols are used for the Boromo belt, white symbols are used for the Houndé belt. ...97
Figure II-7 Map of geographical distribution of the analysed samples within the greenstone belts. The acronyms are the same as in figure II-5. ...99
Figure II-8 Structural map showing the orientation S0 bedding and stratigraphic layering, S1 penetrative metamorphic foliation, and the S2 shear zones and high strain zones. L1/L2 lineations are also plotted. Rose diagrams show the strike distribution of dextral (DEX) and sinistral (SIN) shear zones. HO – Houndé, KO – Koumbia, DA – Dano, DI – Diébougou, GA – Gaoua, KTGD – Koudougou-Tumu granitoid domain, DGD – Diébougou granitoid domain, SGD – Sidéradougou granitoid domain, NGD – Niangoloko granitoid domain. Three cross-sections shown in figure II- 12 are indicated. ... 101
Figure II-9 Equal area lower hemisphere stereoplots of the orientation of D1-D3 structures. Rose diagrams show the distribution of the foliation strikes and brittle fractures and faults. ... 103
Figure II-10 Simplified structural map indicating major shear zones/high strain zones and axial planes of the regional scale F1 folds. BPSZ – Boromo-Poura shear corridor; GFBSZ Greenville-Ferkessedougou-Bobo-Dioulasso Shear zone; OFSZ Ouango-Fitini shear zone; WBSZ – West Batié shear zone. ... 104 Figure II-11 Densities of the lithologies used in the 2¾ D gravity modeling. Bas – basalt, gbr – gabbro, and –
andesite, pyr – pyroclastic flow, vs – volcano-sediments and Birimian sediments, Tkw – Tarkwaian-type sediments, grd – granodiorite, gra – granite. ... 107
Figure II-12 Three geological cross-sections with their corresponding gravity models. The geographic location of the profiles as well as the stations of gravity measurements, which were projected onto the geological profiles for the modeling purposes, is indicated in figure II- 8. ... 109
Figure II-13 Summary table of the tectonic evolution. Ban – Banfora belt, K-M – Katiola-Marabadiassa belt, Ho-W – Houndé belt west of the Boni shear zone, Ho-E –Houndé belt east, OF – Ouango Fitini belt, Téh – Téhini belt, Bor-W –Boromo belt west of the Batié basin, Bor-E –Boromo belt east, Law – Lawra belt. For acronyms, see also figure II- 3. Radiometric ages presented in the histograms are referenced in figure II-2. ... 111
Figure II-14 Tectonic scenario for western Burkina Faso during the Eburnean orogenesis. The surface corresponds to the present-day erosional level. ... 116
Figure III-1 Simplified geological map of the Leo-Man craton modified after BRGM SIGAfrique (Milési et al., 2004) with the zone of interest outlined; the Paleoproterozoic greenstones are divided into: light grey – intermediate to acid volcano-clastics and volcano-sediments, dark gre – mafic to intermediate lavas and volcanic products. ... 128 Figure III-2 Lithological (a) and pedological (b) map of the study area. White stars represent spectral
measurement locations. The maps are compiled from Castaing et al. (2003) and the IRD Valpedo GIS (http://www.miruram.mpl.ird.fr/valpedo/miruram/Burkina/index.html, respectively. TTG – tonalites-trondhjemites-granodiorites. ... 130
Figure III-3 Field photographs of principal lithologies with weathered and unweathered surfaces (displayed as insets), a - gabbro, b - andesite, c - volcano-sediments, d - Tarkwaian-type sediments, e - Granodiorite, f - Granite, g - Taoudeni basin sandstones, and h - common Fe-rich duricrust plateaus with cut surface (displayed as inset)... 134
Figure III-4 Relative reflectance of the main lithological types - Volcanic and volcano-sedimentary rocks. Mean reflectance of each lithological group is drawn with solid line, plus and minus one standard deviation is displayed as dashed line. Absorption features are indicated with vertical lines and horizontal brackets. ... 137 Figure III-5 Relative reflectance of the main lithological types - Granitoids and sedimentary rocks. Mean
displayed as dashed line. Absorption features are indicated as vertical lines and horizontal brackets. ... 138
Figure III-6 Relative reflectance of the main soil types (spectra are offset for clarity and sorted by increasing reflectance), A - soil formed over basalts and gabbros, B - soil formed over andesites and andesitic pyroclastites, C - soil formed over Tarkwaian-type sediments, D - soil formed over granites and TTGs, E - soil formed over sediments - sandstones, F - soil formed over volcano-sediments. ... 140 Figure III-7 Relative reflectance of Fe-rich regolith materials and vegetation (spectra are offset for clarity), A - Fe-rich duricrust cut surface, B - Fe-rich duricrust exposed surface, C - Fe-rich lag, D - dry vegetation, E - green vegetation. ... 141
Figure III-8 Relative reflectance of surface materials derived from andesites (spectra are offset for clarity), A - Relative reflectance of andesitic rock, B, F - its weathered surfaces, C - associated soil found close to outcrops and on agricultural fields - E, the effect of vegetation residues and lag material - D, G on the soil spectra. ... 142
Figure IV-1 Schematic map of the study area. Geological map of the Northeastern part of the Paleoproterozoic Baoule Mossi domain in the West African Craton (modified after BRGM SIGAfrique) with study area marked by a rectangle. The Paleoproterozoic greenstones are divided into: light grey – intermediate to acid volcano-clastics and volcano-sediments, dark grey – mafic to intermediate lavas and volcanic products. ... 152 Figure IV-2 Regolith landforms found in the area with chronological and petro-geochemical characteristics given, figure modified after Michel (1973), Grandin (1976) and Gunnel (2003). ... 153
Figure IV-3 Existing 1:500 000 scale pedo-geomorphological and morphological maps of the region, a) pedogeomorphological map (Brossard, 2006), b) geomorphological map (IGN, 2005). ... 154
Figure IV-4 An overview map with normalized slope values draped over shaded relief of the SRTM digital elevation model; the distribution of the training/testing polygons used in the classifications is given. 158
Figure IV-5 ASTER VNIR image showing the study area. Geomorphological units are marked along with examples of burn scars. Small white rectangular patches correspond to agricultural fields. ... 159
Figure IV-6 Combined image with ratio eTh/K image (upper half of the image) and ternary radiometric image K, eTh, eU as RGB (lower half of the image) draped over shaded relief of the SRTM digital elavation model; the geomorphological units are marked with arrows, elev - elevated. ... 161
Figure IV-7 Pauli decomposition of ALOS PALSAR data with the geomorphological units marked where possible. Blue areas correspond to single bounce scattering, red around the Town of Gaoua – double bounce scattering (buildings), green channel-volume scattering related to vegetation, high intensity, white color – residual ridges. ... 162
Figure IV-8 Result of the neural network classification based on 11 input layers. red – Fe-rich duricrusts of the High/Middle glacis, blue – Residual relief, yellow – Alluvium, magenta – Low glacis. ... 165
List of tables
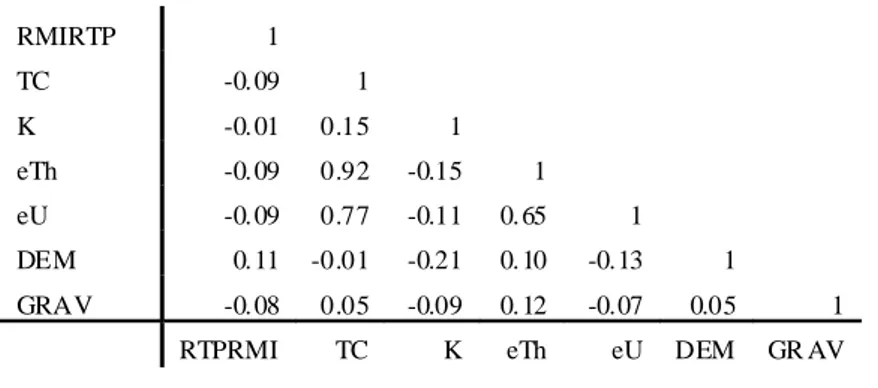
Table I-1 Outcrop information included in the collected and used databases. Outcrops in the first three databases are stored as point features. BRGM/BUMIGEB 1 – Castaing et al. (2003), * at places contains orientations as text description, BRGM/BUMIGEB 2 – Marcelin (1971), Marcelin and Serre (1971).Data from mining companies contain outcrops as outcrop polygons and points, at places supplemented with structural measurements (points).Obs. count – count of observations made, Litho. – lithological data, Struc. – structural measurements, Susc. – magnetic susceptibility, Dens. – density, Geoch. – geochemistry (only for selected locations). ...48 Table I-2 Correlation matrix between selected source layers used in the interpretation. RTPRMI – reduced to the pole residual magnetic intensity, TC – total count (airborne gamma ray data), DEM – digital elevation model, GRAV – Bouguer anomaly grid. ...50
Table I-3 Summary table of the lithologies; their mineralogical, petrophysical characteristics, and expression in the airborne geophysical data. DTM – digital terrain model, andes. – andesite, volc.-sedim. – volcano-sediment, Qtz – quartz , Pl – plagioclase, Cpx – clinopyroxene, Hbl – hornblende, Act – actinolite, Chl – chlorite, Ep – epidote, Bt – biotite, Kfs – K-feldspar, Kln – kaolinite, Czo – clinozoisite, Carb – carbonate, Hem – hematite, Gt – goethite. Folds/Faults – red line – interpreted fault/shear zone, yellow line – lithological contact, turquoise line – interpreted fold hinge. ...61
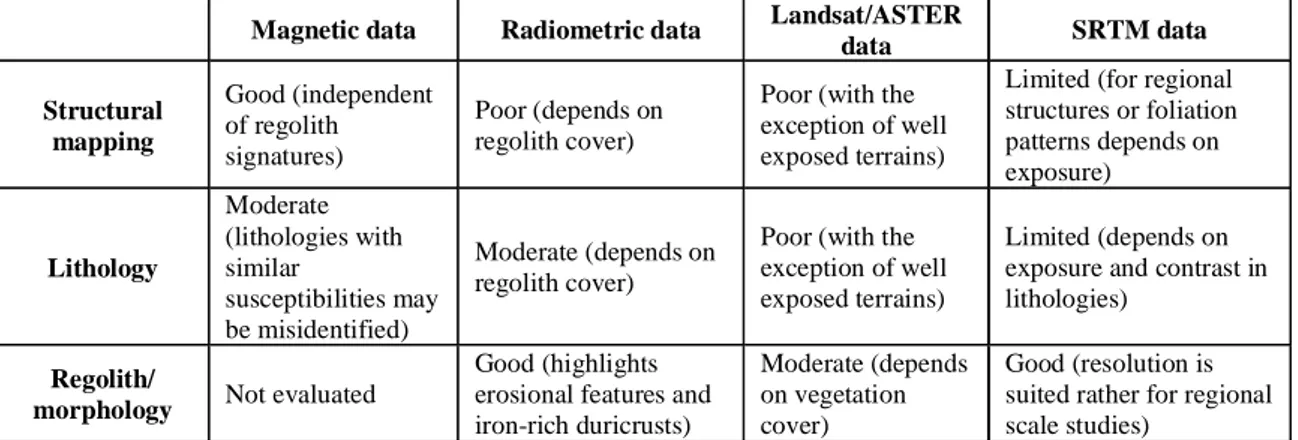
Table I-4 Strengths and weaknesses of available geophysical and remote sensing data in lithological and structural mapping. ...71
Table II-1 Representative geochemical analyses of mafic and intermediate volcanic rocks of the greenstone belts. ...98 Table II-2 Synthesis of deformation events published in literature, put into the framework of the present study. Direction indications in italics (NE-, NW- etc.A1) stand for the strike, other direction indications signify "vergent" or "oriented". Following acronyms and shortcuts were used: GB - greenstone belt, SZ - shear zone or strike slip fault, Tkw - Tarkwaian, depo. - deposition, defo. - deformation, Birim. sedim. - Birimian sediments, volc. - volcanism, plut. - plutonism, met. or metam. fab. - metamorphic fabric, cren. clv. - crenulation cleavage, iso. - isoclinal, intracont. - intracontinental, comp. - compression, ext. - extension, transpres. - transpression, transten. - transtension, sin. - sinistral, dex. - dextral, react. - reactivation, struct. - structures, juxtapos. of L & H grade metam. - juxtaposition of low and high grade metamorphic terranes. ... 106
Table III-1 Descriptions of principal lithologies and their weathered surfaces, based on petrological macroscopic,microscopic and structural observations; (Qtz - quartz , Pl - plagioclase, Cpx clinopyroxene, Hbl - hornblende, Act - actinolite, Chl - chlorite, Ep - epidote, Bt - biotite, Kfs - Kfeldspar, Kln kaolinite, Czo clinozoisite, Carb carbonate, Hem hematite, Glt glauconite, Gth goethite)... 131
Table IV-1 Utilized datasets with detailed description on original processing, spatial resolution, and spectral coverage. *Landsat – only 30 m bands used, bands 1-5, 7; **all 14 bands used and resampled to 30m, pol. – polarimetric, abs. – absolute. ... 155
Table IV-2 Training and testing pixels for the mapped classes, N. – number. ... 158
Table IV-3 Confusion matrix for neural network classification compared with the validation data using 11 source data layers including only SRTM derivatives and gamma-ray spectrometry data. ... 166
Table IV-4 Confusion matrix for Neural network classification compared with the validation dataset using 24 source data layers - first 10 PCA bands ASTER, slope, slope roughness, hypsometric integral, residual relief, curvature, height above stream, 6 ALOS PALSAR and Radarsat – 2 Pauli decomposition bands, and two ratio grids eTh/K, eU/K. ... 169 Table IV-5 Confusion matrix for maximum likelihood classification compared with the validation dataset using 24 source data layers. Layers are the same as in table IV-4. ... 169
Table IV-6 Summary of classification results according to the used layers. SRTM – derivative layers (slope, slope roughness, curvature, relative relief, hypsometric integral, height above closest stream), Gamma ray – eTh/K, eU/K,*(K, eTh, eU), Radarsat-2 – 3 Pauli decomposition channels, ALOS PALSAR – 3 Pauli decomposition channels, Landsat – 6 bands, ASTER – **first 10 PCA bands. ANN – artificial neural network classification, O. A. – overall accuracy, ML – maximum likelihood classification... 170
List of acronyms
Acronym Meaning
ACP Analyse des Composantes Principales
AFM Al, Fe, Mg diagram
ALOS PALSAR Advanced Land Observing Satellite Phased Array type L-band Synthetic Aperture Radar
ANN Artificial Neural Network
ASD Analytical Spectral Devices
ASTER Advanced Spaceborne Thermal Emission and Reflection Radiometer
ASU Arizona State University
ATCOR Atmospheric/Topographic Correction
BRGM Bureau de Recherches Géologiques et Minières BUMIGEB Bureau des Mines et de la Géologie du Burkina CA Calc-alkaline basalts and andesites
CESBIO Centre d'Etudes Spatiales de la Biosphère
CFA Crystal Field Absorption
CGIAR Consultative Group on International Agricultural Research CPCS Commission de Pédologie et Cartographie des Sols
CTA Charge Transfer Absorption
DEM Digital Elevation Model
DGD Diébougou Granitoid Domain
DLR Deutsches Zentrum für Luft- und Raumfahrt (German Aerospace Center) DPCA Directed Principal Component Analysis
DTM Digital Terrain Model
ESA European Space Agency
eTh equivalent Thorium
eU equivalent Uranium
FVD First Vertical Derivative
Ga Gigaanum, billions of years
GD Granitoid Domain
GET Géosciences Environnement Toulouse
GFBSZ Greenville-Ferkessedougou-Bobo-Dioulasso Shear Zone
GIS Geographic Information System
GPS Global Positioning System
HH, HV, VH, VV particular combination of transmit/receive wave polarization in radar polarimetry (Horizontal, Vertical)
HREE Heavy Rare Earth Elements
HSV Hue, Saturation, Value
HT High Temperature
ICP-AES Inductively Coupled Plasma Atomic Emission Spectroscopy ICRAF International Centre for Research in Agroforestry
IGN Institut Géographique National
IGRF International Geomagnetic Reference Field IRD Institut de Recherche pour le Développement ISRIC International Soil Reference and Information Centre
Acronym Meaning
KTGD Koudougou-Tumu Granitoid Domain
LANDSAT ETM+
Land remote sensing Satellite Enhanced Thematic Mapper Plus
LiDAR Light Detection and Ranging
LREE Light Rare Earth Elements
Ma Megaanum, millions of years
ME1-4 Magmatic Episode
ML Maximum likelihood
MP/MT Medium Pressure/Medium Temperature
NASVD Noise-Adjusted Singular Value Decomposition
NGD Niangoloko Granitoid Domain
NIR Near Infrared
OFSZ Ouango-Fitini shear zone
ORSTOM Office de la Recherche Scientifique et Technique d'Outre-Mer
PCA Principal Component Analysis
REE Rare Earth Elements
RGB Red, Green, Blue
RMI Residual magnetic intensity
RTP Reduction To the Pole
SFF Spectral Feature Fitting
SGD Sidéradougou Granitoid Domain
SIG Système d'information géographique
SOAR Sciences and Operational Application Research SPOT Système Pour l'Observation de la Terre
SRTM Shuttle Radar Topography Mission
SWIR Short Wave Infrared
SYSMIN System for Mineral Products
TAS Total Alkali Silica diagram
TES Temperature/Emissivity Separation algorithm
TH Tholeiites
THM Megacrystic basalts
TIR Thermal Infrared
TRAN Transitional basalts and andesites TTG Tonalite-Trondhjemite-Granodiorite
USGS United States Geological Survey
VIS Visible
Abstract
The oldest parts of continents, so-called cratons, are the focus of worldwide research not only because they represent primary constraints for our understanding of the early evolution of the Earth, but also because of their significant mineral potential. This work contributes to the understanding of the geological and geomorphological evolution of the West African Craton, by an integrated analysis of airborne geophysical and satellite remote sensing data constrained by field structural, lithological, geophysical, and geomorphological observations acquired around Houndé, Boromo and Banfora greenstone belts and associated granitoid domains in western Burkina Faso.
The results of this integration suggest that the granitoid domains of western Burkina Faso are formed by numerous small- to medium-sized plutons, and the magnetic data provided a better definition of the actual pluton shapes. Airborne gamma ray spectrometry data aided in the mapping process in areas with less regolith cover. Three deformation events (D1-D3) can be distinguished in western Burkina Faso. A megacrystic tholeiitic basalt unit allowed us to establish stratigraphic correlations between the two belts and propose a crustal scale anticline (D1). The D1 penetrative structures, resulting from an E-W to WNW-oriented compression are generally overprinted by the D2 transcurrent shear zones, which is well visible in the magnetic data. Previously unreported and already known S2 shear zones represent prospective areas for gold exploration. The regional-scale system geometry was controlled by coaxial shortening of stiffer volcanic units and coeval magma input. The last D3 N-S compression is either late-Eburnean or perhaps even Pan-African.
The mineralogical composition of rocks and derived regolith surfaces may be assessed by visible and infrared spectroscopy. A new spectral library has been acquired consisting of in situ and laboratory 0.35 µm to 2.5 µm spectra of rocks and derived regolith materials. The reflectance spectra of rocks show the influence of typical arid to semi-arid weathering. Fe-OH and Mg-OH absorption features are observable in the mafic and intermediate volcanic rocks as well as in the granodiorites and tonalites. Al-OH absorptions are typical for volcano-sedimentary and sedimentary rocks, and regolith materials. Ferric and ferrous iron absorptions were observed in most of the sampled materials. The spectra of soils partially reflect the mineral composition of the weathered rock surfaces.
Airborne gamma ray spectrometry data, ASTER, Landsat, and polarimetric radar data, along with morphometric parameters derived from the SRTM digital elevation model, were used to characterize four different regolith landform units in the Gaoua area. An artificial neural network classification was applied to the dataset and compared with a maximum likelihood classifier. The best results were obtained with a combination of gamma-ray spectrometry data and derivatives of the digital elevation model. The classification contributed to an increase in the accuracy of the distribution of the classified units and to an actualization of their respective shapes. The approach demonstrates the potential of neural networks for the combined analysis of airborne geophysical and remote sensing data in regolith landform mapping.
Abstrakt
Nejstarší části kontinentů, takzvané kratony, jsou v současnosti centrem zájmu celosvětového výzkumu nejen proto, že jejich znalost je nezbytná pro porozumění raného vývoje Země, ale také vzhledem k jejich značnému významu v oblasti těžby nerostných surovin. Výsledky této práce přispívají k pochopení geologického a geomorfologického vývoje Západoafrického kratonu. K jejich získání bylo použito integrované analýzy leteckých geofyzikálních dat, satelitních dat dálkového průzkumu Země a dat získaných během terénních měření v západní části Burkiny Faso, v oblastech zelenokamenových pásů Houndé, Boromo, Banfora a přidružených granitoidních domén.
Výsledky tohoto komplexního přístupu ukazují, že granitoidní území západní Burkiny Faso tvoří větší množství malých až středně velkých plutonů. Pomocí magnetometrických dat byly zpřesněny zejména tvary těchto intruzivních těles. V oblasti západní Burkiny Faso můžeme definovat tři deformační fáze (D1-D3). Stratigrafická korelace provedená mezi zmíněnými zelenokamenovými pásy na základě výskytu jednotky megakrystických bazaltů nasvědčuje dřívějšímu propojení obou pásů. Penetrativní struktury D1 vzniklé v režimu vz. až zsz. orientované komprese jsou obvykle přetištěny transkurentními střižnými zónami D2, což je dobře viditelné i v magnetických datech. Nově objevené i stávající střižné zóny S2 představují perspektivní oblasti pro průzkum ložisek zlata. Regionální strukturní stavba vznikala během koaxiální komprese kompetentních vulkanických hornin současně s vmísťováním granitoidních těles. Poslední deformační fáze D3 je zřejmě pozdně Eburnská nebo náleží až k Panafrické orogenezi.
Mineralogické složení horninových a regolitových povrchů lze studovat, metodami dálkového průzkumu Země pomocí viditelné a infračervené spektroskopie. Spektra hornin a z nich odvozených regolitových materiálů naměřených v terénu a laboratoři v rozsahu 0,35–2,5 µm tvoří základ nové spektrální knihovny. Horninová spektra ukazují vliv typického semi-aridního zvětrávání. Fe-OH a Mg-OH absorpční pásy byly pozorovány u mafických a intermediárních vulkanických hornin, granodioritů a tonalitů. Al-OH absorpční pásy jsou typické nejen pro vulkano-sedimentární a sedimentární horniny, ale také pro regolitové povrchy. Absorpční pásy související s obsahem železa byly nalezeny téměř ve všech měřených materiálech. Spektra půd částečně odpovídají minerálnímu složení zvětralých hornin.
Résumé
Les parties les plus anciennes des continents, les cratons, sont au centre des recherches mondiales non seulement parce qu'ils représentent des contraintes primaires pour notre compréhension de l'évolution primitive de la Terre, mais aussi en raison de leur potentiel minier important. Ce travail contribue à la compréhension de l'évolution géologique et géomorphologique du craton ouest africain, par une analyse intégrée de géophysique aéroportée, des données de télédétection, et des observations acquises autour des ceintures de Houndé, Boromo et Banfora et des domaines des granitoïdes associés dans l'ouest du Burkina Faso.
Les résultats de cette intégration suggèrent que les domaines de granitoïdes sont formés par de nombreux plutons, d’une taille petite et moyenne. Ainsi, les données magnétiques ont fourni une meilleure définition des formes réelles de ces plutons. Trois événements de déformation (D1-D3) peuvent être distingués dans l'ouest du Burkina Faso. L’unité de basalte tholéiitique à mégacristaux de plagioclase nous a permis d'établir des corrélations stratigraphiques entre les deux ceintures. Les structures D1 pénétratives, résultant d'une compression orientée EO à ONO-ESE sont généralement recoupées par les zones de cisaillement D2. Ces zones de cisaillement D2 représentent des zones de prospective pour l'exploration aurifère. La géométrie régionale du système est gouvernée par un raccourcissement coaxial des unités volcaniques rigides et par un rajout progressif des magmas granitiques. La dernière compression (D3), est tardi-éburnéene ou peut-être même panafricaine.
La composition minéralogique des roches et de leurs surfaces d’altération peut être étudiée à l’aide de spectroscopie visible et infrarouge. Une nouvelle bibliothèque spectrale a été acquise, composée des mesures in-situ et en laboratoire (0,35–2,5 µm) des roches et des matériaux régolithiques. Les spectres de réflectance des roches montrent l'influence d’altérations typiques des zones semi-arides. Les absorptions caractéristiques de Fe-OH et Mg-OH sont observables dans les roches mafiques et volcaniques intermédiaires ainsi que dans les granodiorites et tonalites. Les absorptions Al-OH sont typiques pour les roches volcano-sédimentaires et sédimentaires, et les matériaux de régolithe. Les absorptions de fer ferrique et ferreux ont été observées dans la plupart des matériaux échantillonnés. Les spectres des sols reflètent partiellement la composition minérale de la surface des roches altérées.
Les données de spectrométrie gamma aérienne, ASTER, Landsat et de radar polarimétrique, ainsi que les paramètres morphométriques dérivés du modèle numérique de terrain SRTM, ont été utilisés pour caractériser les unités de régolithe dans la zone de Gaoua. Une méthode de classification par réseaux de neurones a été appliquée à l'ensemble des données, et ensuite comparée à un classificateur par maximum de vraisemblance. Les meilleurs résultats ont été obtenus avec une combinaison de spectrométrie gamma et des dérivés du modèle numérique de terrain. L'approche démontre le potentiel des réseaux de neurones pour l'analyse combinée de géophysique aéroportée et de données de télédétection dans la cartographie de régolithe.
Introduction and background
Introduction et contexte général
Les parties les plus anciennes des continents, les cratons, sont au centre de recherches mondiales non seulement parce qu'ils représentent des contraintes primaires pour notre compréhension de l'évolution primitive de la Terre, mais aussi en raison de leur potentiel minier important. Sans sous-estimer l'importance des études précédentes, le bouclier ouest-africain reste sous-étudié par rapport à ses équivalents géologiques en Australie et au Canada. Ce craton particulier représente un point tournant dans l'histoire de la terre : un changement des mécanismes de formation de la croûte continentale juvénile. La croûte continentale stable située dans la zone tropicale a permis le développement de processus d’altération superficielle prolongés, dans l'ensemble des lithologies, et a ainsi abouti à un épais manteau de régolithe qui couvre la plupart de la surface du craton Leo-Man, la partie sud du craton ouest-africain. La couverture du régolithe est un obstacle à des études géologiques et géochimiques d'exploration, mais présente également un grand intérêt pour la recherche tectono-géomorphologique de l'évolution de l'Afrique occidentale. La cartographie traditionnelle de la géologie et du régolithe basée sur les observations de terrain est un procès long qui fait face à des difficultés d’extension des observations locales à l’échelle régionale ainsi que d’une couverture des données insuffisante.
Les interprétations des données magnétiques, gravimétriques, de spectrométrie gamma et de télédétection satellitaire, contraintes par les observations de terrain, ont prouvé leur efficacité pour déchiffrer la hiérarchie des cadres litho-structuraux régionaux des terrains précambriens, pourtant presque aucune étude de telle nature n’existe pas en Afrique de l’Ouest. De façon similaire, l’intégration des données géophysiques et satellitaires a été appliquée pour la cartographie du régolithe en Australie. Cependant, très peu d’études utilisant l’approche semi-automatique ont été effectuées en Afrique de l’Ouest pour des fins d’évaluation de distribution et de caractérisation du régolithe et l’approche pleinement automatique n’a jamais été utilisé jusqu’à ce jour. Enfin, à ce jour, très peu d’attention a été accordée à une analyse intégrée des différents types de données avec un accent sur la géologie et le régolite.
La détection des assemblages lithologiques et des corps géologiques, la définition du cadre structural et l’identification des unités et du relief du régolithe seront réalisés à travers une approche d’intégration des données multiples à l’échelle régionale, en exploitant la vue synoptique des données aéroportées et satellitaires. Les observations de terrain, et les mesures de terrain et de laboratoire serviront de contraintes et de données de validation. Le modèle géodynamique, conçu par une approche intégrée, abordera avec une meilleure précision la géométrie 3D du système ainsi que la chronologie relative de certaines structures à grande échelle.
Avec une disponibilité croissante de nouvelles sources de données qui sont actuellement libérées et qui seront publiées dans les prochaines décennies, des approches similaires à celles proposées dans cette thèse pourront être utilisés dans d'autres régions d'Afrique occidentale et au-delà.
Introduction and background
Introduction and background
Problem statement
The oldest parts of continents, so-called cratons, are the focus of worldwide research not only because they represent primary constraints for our understanding of the early evolution of the Earth, but also because of their significant mineral potential. Without underestimating the importance of previous studies, the West African shield remains an under-researched craton compared to its geological equivalents in Australia and Canada. This particular craton formed at a turning point in the Earth’s history, when the mechanisms of new continental crust formation were changing. The stable continental crust situated in the tropical zone allowed for prolonged weathering of all of the lithologies and resulted in a thick regolith mantle, which covers most of the surface of the Leo-Man Shield, the southern part of the West African Craton. The regolith cover hinders geological studies and geochemical exploration; however, knowing the distribution of different regolith landform units is of great interest for tectono-geomorphic research of the evolution of West Africa. Mapping the geology and regolith over vast areas with traditional field based methods is a lengthy process facing difficulties of extending local observations to regional scale features and insufficient data coverage.
Interpretations of magnetic, gravimetric, gamma ray spectrometry and satellite remote sensing data constrained by field observations proved to be efficient in deciphering the regional litho-structural hierarchies of Precambrian terrains, yet almost no similar studies exist in West Africa. Similarly integrating geophysical and remote sensing data has frequently been applied in regolith landform mapping in Australia; however to date only several studies have been reported from West Africa using a semi-automated approaches in assessing the distribution and characteristics of regolith landform units while no fully automatic approach has been attempted. Finally, to date very little attention has been paid to comprehensive types of studies analyzing different types of data with a focus on both the bedrock geology and the regolith.
Through an integrated approach, the detection of lithological assemblages, geological bodies, definition of the structural framework and identification of regolith landform units will be achieved at regional scales, exploiting the synoptic view of airborne and satellite data. Field mapping, field measurements, and laboratory measurements will serve during the interpretation as constraints
Introduction and background
Overview of the geology of West Africa and Burkina Faso
The greenstone belts of western Burkina Faso represent a typical granite-greenstone terrain of the Paleoproterozoic Baoulé-Mossi domain in the southern part of the West African Craton (figure 1) (Bessoles, 1977; Abouchami et al., 1990; Boher et al., 1992; Taylor et al., 1992; Béziat et al., 2000; Debat et al., 2003). The NNE-SSW to N-S arcuate belts stretch for more than 400 km and are host to multiple gold and base metal deposits (Milési et al., 1992; Béziat et al., 2008). They belong to a polycyclic orogen that formed around the Kénéma-Man Archean nucleus during the Eburnean orogeny (2200–2000 Ma) (Bonhomme, 1962; Liégeois et al., 1991; Milési et al., 1992; Ledru et al., 1994; Egal et al., 2002). Many studies describe the polyphase litho-structural setting and propose in essence two distinct geotectonic models for the evolution of the Paleoproterozoic basement in West Africa. A traditional plate tectonic model of crustal buildup by thrust and fold belts similar to the modern orogens has been proposed by Boher et al. (1992), Feybesse and Milési (1994), Ledru et
al., (1994), Hirdes et al., (1996), Debat et al., (2003), Feybesse et al., (2006), Tshibubudze et al.,
Figure 1 Simplified geological map of the West African Craton (modified after BRGM SIGAfrique); the Paleoproterozoic greenstones are divided into: light grey – intermediate to acid volcano-clastics and volcano-sediments, dark grey – mafic to intermediate lavas and volcanic products.
Introduction and background
(2009), Hein, (2010). Pons et al. (1995) or Vidal et al. (2009) on the other hand favor the dome and basin structures caused by gravitational processes referred to as “vertical tectonics”.
The Baoulé-Mossi domain (figure 1) forms the eastern and northern part of the Leo-Man Craton (Bessoles, 1977). Typical Archean-like greenstone-granitoid assemblages (de Wit and Ashwall, 2006) that principally consist of volcanic, volcano-sedimentary, and sedimentary sequences, which are separated by extensive tonalite-trondhjemite-granodiorite and granitoid provinces, characterize the Paleoproterozoic domain. The volcanic and volcano-sedimentary rocks belong to the Birimian Supergroup, which probably formed in the context of volcanic arcs and oceanic plateaus (Abouchami et al., 1990; Leube et al., 1990; Boher et al., 1992; Taylor et al., 1992; Pouclet et al., 1996; Béziat et al., 2000). Radiometric dating of the volcanic units (Davis et al., 1994; Loh and Hirdes, 1996; Lüdtke et al., 1998; Lüdtke et al., 1999) places the main peak of the Birimian volcanism at around 2190–2160 Ma, while detrital zircons from the sedimentary basins yield ages as young as 2130 Ma (Lüdtke et al., 1999) or 2107 Ma (Doumbia et al. 1998). The Birimian volcanic and volcano-sedimentary units are unconformably overlain at several places across the craton by detrital shallow water sedimentary rocks, which are known as the Tarkwaian sediments (Whitelaw, 1929; Sestini, 1973; Leube et al., 1990; Oberthuer et al., 1998; Feybesse et al., 2006). The whole complex of volcanic, volcano-sedimentary, and sedimentary units was intruded by several generations of granitoids. The granitic plutons were emplaced during several magmatic pulses from 2180 to 1980 Ma (Leube et al., 1990; Pons et al., 1995; Hirdes et al., 1996; Doumbia et al., 1998; Castaing et al., 2003; Gasquet et al., 2003; Naba et al., 2004; Siegfried et al., 2009; Thomas et al., 2009; Agyei Duodu et al., 2010). The general geochemistry of the granitoids evolves from Na-rich calc-alkaline to K-rich alkaline (Boher et al., 1992) while their shape depends on tectonic regime during their emplacement, ranging from undeformed circular plutons to elongate and complex interlocked bodies (Pons et al., 1991; Pons et al., 1992; Pons et al., 1995).
The Eburnean orogeny is generally divided into two major deformation phases. The first phase, which caused major crustal thickening (Boher et al., 1992; Milési et al., 1992; Allibone et al., 2002; Feybesse et al., 2006; Vidal et al., 2009), operated approximately during 2130–2100 Ma. The second phase that lasted up to 1980 Ma was responsible for the formation of regional scale transcurrent shear zones and faults, which transect all lithologies. Gold mineralization in West Africa
Introduction and background
Neoproterozoic sediments of the large Taoudeni, Lullemeden, and Volta basins. Dyke swarms crosscut the entire Proterozoic domain in several directions and belong to at least six different generations (Jessell et al., 2010).
Lateritic weathering and geomorphology of West Africa and Burkina Faso
The regolith in West Africa represents an important economic resource (Wright et al., 1985), a constraint on the regions tectono-geomorphic evolution (Michel, 1973; Grandin, 1976; Leprun, 1979; Boeglin, 1990; Tardy, 1997; Beauvais, 1999; Chardon et al., 2006), and a hindrance to geochemical exploration techniques (Craig, 2001; Taylor and Eggleton, 2001). The term regolith stands for all of the weathered and unconsolidated material from basement rock to earth surface including interbedded fresh rocks (Taylor and Eggleton, 2001). A simplified regolith terminology of a typical laterite weathering profile may be found in figure 2. The laterite profile consists of several regolith facies, from the bottom to the top – bedrock, saprock, saprolite, plasmic zone, mottled zone or ferruginous saprolite, lateritic residuum (lateritic duricrust, lateritic gravel). The facies correspond to the intensity of weathering processes and due to mechanical erosion or differences in parent rock materials, not allIntroduction and background
of the facies have to be always present. Tardy (1997) estimates that nearly one third of the area of all continents is covered by regolith resulting from lateritic weathering. The distribution of lateritic
materials in Africa is depicted in figure 3.
From a geomorphological point of view, the occurrence of different regolith facies is tied with several types of regolith landforms belonging to the erosional, depositional, or residual regime. The
Figure 3 Distribution of laterites, bauxites, and lateritic soils in Africa, modified from Burke and
Introduction and background
ferruginous or aluminous duricrusts, which are ordered in a stepped manner and correspond to a chronological sequence in which they were formed (Michel, 1973; Grandin, 1976; Tardy, 1997). Seven planation surface classes (figure 3A) have been established according to correlations between relative height, geochemistry, and petrology tying the oldest surface with the Gondwanian era and the youngest in age reaching the Quaternary period (Gunnell, 2003; Beauvais et al., 2008; Burke and Gunnell, 2008). The formation mechanism of the duricrusts includes a combination of processes where in situ formation (Leprun, 1979) down slope mechanical displacement and subsequent
recementation acted together (Beauvais, 1999). The lateritization processes are also connected with residual bauxite and manganese deposits, and secondary enrichment of iron ore deposits (Wright et al., 1985; Tardy, 1997; Lavaud et al., 2004).
The lateritic surfaces of southwestern Burkina Faso were thoroughly studied by Boeglin and Mazaltarim (1989) and Boeglin (1990). According to Boeglin (1990), only three of the planation surfaces are present in the south of Burkina Faso. Recently Beauvais et al. (2008) reported dating of the surfaces from northern Burkina Faso. Relics of the highest bauxitic African surface (Eocene, 59– 45 Ma) are found at the top of the eroded sequences above 500 m. The Intermediate surface (Oligocene, 34–29 Ma) has not been observed and either has been completely eroded or did not exist in the region. The other ferruginous surfaces belong to the so-called high glacis (Late Oligocene-Early
Figure 4 A block diagram with typical regolith landforms found in Western Australia and common to
Introduction and background
Miocene, 24–18 Ma) and middle glacis (Middle to Late Miocene, 12–7 Ma). These surfaces are not easily separable and according to Boeglin (1990), it can be concluded that there has been probably one continuous inclined or undulating surface rather than two distinct levels. The area of southwestern Burkina Faso provides contrasting geological basement of alternating greenstone belt lithologies and granitic bodies. There seems to be at least some linkage between the chemical composition of the iron rich duricrusts and the underlying basement rocks (Boeglin, 1990). Blot et al. (1973) also evaluated
correlations between basement geochemistry and regolith geochemistry; where again at local scale moderate to significant relationship exists. Tardy (1997) however states, that the petrological and
Figure 5 (A) Lateritic regolith surfaces of West Africa; (B)Variations in the spatial extent of lateritic
Introduction and background
resources. Geological mapping is an interpretative and subjective process, and because of that, it is crucial to include as much data describing the geological situation as possible to eliminate errors in the interpreted model. In a complex landscape environment or while surveying large areas, data collection is hindered by lack of outcrops caused by vegetation or regolith cover and the inability to cover all of the area using field observations due to time or financial constraints. To overcome some of these problems, magnetic, gravimetric, gamma-ray spectrometry, and satellite remote sensing data constrained by detailed field observations collected at key areas were previously utilized (e.g. Jaques et al., 1997; Schetselaar et al., 2000; Betts et al., 2003; Peschler et al., 2004; Direen et al., 2005; Martelet et al., 2006; Peschler et al., 2006; de Souza Filho et al., 2007; Schetselaar et al., 2007; Schetselaar et al., 2008; Teruiya et al., 2008; Aitken and Betts, 2009a; Stewart and Betts, 2010). The field observations used in the process of geological mapping include lithological observations, petrographic, metamorphic, and geochemical analyses, while incorporating also detailed structural measurements. The effective application of some methods alone (e.g. multispectral satellite data or gamma ray spectrometry data) without an integrated approach may be difficult especially in deeply weathered terrains due to the complex regolith-parent rock relationships (Wilford et al., 1997; Taylor and Eggleton, 2001).
Airborne magnetic data allow us to map magnetic anomalies (Boyce and Morris, 2002). Constrained by field structural and geological observations, these data serve as a tool for deriving both lithological information and structural frameworks from which kinematic relationships can be interpreted (Betts et al., 2003; Direen et al., 2005; Betts et al., 2007; Aitken and Betts, 2009a, b). The traditionally performed reduction to pole, which significantly simplifies the interpretations of magnetic data, becomes unstable close to the equator because of the low magnetic inclination (MacLeod et al., 1993; Li, 2008). Moreover, N-S oriented anomalies cannot be portrayed accurately at low latitudes (Beard, 2000; Reeves, 2005). Different methods have been suggested for performing the reduction close to the equator (MacLeod et al., 1993; Li, 2008). Filters, which are routinely used in estimating steep gradients from potential field data (Blakely and Simpson, 1986; Miller and Singh, 1994; Verduzco et al., 2004; Pilkington and Keating, 2009), may be applied to magnetic datasets reduced to the pole. These grids, including the first vertical derivative, horizontal derivatives, and tilt derivative (Milligan and Gunn, 1997; Pilkington and Keating, 2009) aid in the determination of structural and lithological boundaries down to first hundreds of meters. Near the equator or in areas with significant remanent magnetization analytical signal and the total horizontal derivative of the tilt derivative are particularly useful when making interpretations, as these are not affected by the orientation of the Earth’s magnetic field (Verduzco et al., 2004; Li, 2006).
The gamma ray spectrometry data acquired over the surface of the Earth reflect the concentrations and distribution of the radioactive elements in both rocks and the derived regolith material. Gamma ray spectrometry is therefore suited for deriving detailed lithological information but serves equally well as a tool for efficient regolith mapping (Jaques et al., 1997; Wilford et al., 1997;
Introduction and background
Martelet et al., 2006). Unlike the magnetic data, it reveals the chemical properties of approximately the first 30 cm layer of the Earth’s crust (Minty, 1997). Different techniques are proposed in the analysis of airborne gamma ray spectrometry data ranging from the ratios of the gamma ray spectrometry channels (Dickson and Scott, 1997; Wilford et al., 1997), color composites, and color space transformations (Jaques et al., 1997) to integrations with optical and near-infrared datasets (Anderson and Nash, 1997; Schetselaar et al., 2000). Usually the data are analyzed as single band grids e.g. eTh/K, eU/K, and eU/eTh or as ternary grids of K, eTh, and eU as RGB (Red, Green, Blue) or HSV (Hue, Saturation, Value).
The deep regional-scale structures and lithological boundaries are usually well defined in
gravimetric data. Gravity anomalies are caused by contrasting densities of the crustal rocks. The
analyses of gravity data may be subject to similar edge detecting techniques as used for the magnetic data (Blakely and Simpson, 1986). Gravity data often serve as input to 2-D and 3-D geophysical modeling for the interpretation of the geometry of lithological bodies at depth (Attoh, 1982; Peschler et al., 2004; Direen et al., 2005; Stewart et al., 2009).
The recognition of the value of multispectral and hyperspectral remote sensing data in lithological and structural mapping dates back to the launch of the first Landsat system (Drury, 1993). However, successful applications are usually constrained to well exposed terrains or terrains where regolith may be linked directly with the underlying geology (e.g. Zumsprekel and Prinz, 2000; Rowan et al., 2004; Rowan et al., 2005). In deeply weathered areas, where the relationships between allochtonous and autochthonous regolith material are not well understood, remote sensing data are instead used for mapping the distribution of the weathered material and so called regolith landform units (Lau et al., 2003).
Digital elevation models may be used for the determination of geomorphological parameters
of the earth’s surface, which are to some extent controlled by the underlying geology. Typically, the digital elevation models stem from remote sensing systems (e.g. SPOT, ASTER, and SRTM). High precision and resolution DEMs acquired by LiDAR (Light Detection and Ranging) are one of the recent research highlights in geological and geomorphological mapping (Grebby et al., 2010; Grebby et al., 2011; Mulder et al., 2011)
Introduction and background
In a GIS environment, layers containing different information may be readily overlain and analyzed as an integrated dataset (Bonham-Carter, 1994; Jaques et al., 1997). These may include digital images, maps, or point layers with field observations. Schetselaar et al. (2007) uses the term “Remote predictive mapping” for an integrated methodology where conventional mapping techniques are coupled with remote sensing data. The word predictive refers to the fact that the produced interpretations are best estimates of the geologic truth. The approach consists from several steps portrayed in figure 4. Similar methodologies, where different sources of data are re-compiled and analyzed in an integrated manner, or parts of the approach proposed by Schetselaar et al. (2007) were described by many others including (Jaques et al., 1997; Schetselaar et al., 2000; Direen et al., 2005; Figure 6Flow Chart of Integrated analysis of remote sensing and traditional field data during geological
or regolith landform mapping projects; object in grey belong to traditional field-based mapping, while white object incorporate remote sensing data, modified from Schetselaar et al. (2007).
Raw Remotely Sensed Data
Gridded & Georeferenced Data
Enhanced and Derivative Data Visual Interpretation Training Supervised Classification Unsupervised Classification Predictive Maps (bedrock & regolith
landform unts, structures) Existing Field Data &
Geological/Regolith Maps
Field Work Planning
New Field Data Validation &
Compilation
New or Updated Geological/Regolith
Introduction and background
Betts et al., 2007; Teruiya et al., 2008; Aitken and Betts, 2009a, b). Although the authors integrate different sources of data, the main idea remains similar. The interpretation may be either automatic or visual. Usually before the analysis itself commences different techniques described in the paragraphs above are used to enhance the data. In addition, to evaluate the relationships between the available source layers, the correlations between the source layers may be assessed. For correlated layers PCA (Principal Component Analysis) serves as a tool in determining uncorrelated factors (components) that can be obtained from the original dataset (Drury, 1993). These layers may be more informative than the original dataset and thus be of greater use during the subsequent interpretations. A detailed description of the used data and methodology applied to geological mapping and utilized in the thesis may be found in Appendices 1 and 2.
Approaches to regolith landform mapping
The term regolith stands for all of the weathered and unconsolidated material from basement rock to earth surface including interbedded fresh rocks (Taylor and Eggleton, 2001). Knowing the distribution of regolith units and understanding the processes, which led to their formation, is important for any kind of successful geological mapping, geochemical or geophysical survey, and mineral exploration. Traditional field-based regolith landform mapping can be a lengthy process, which can be further complicated by difficult access to remote and often large survey areas. At most