Blue Carbon Storage Capacity of Temperate Eelgrass (
Zostera
marina) Meadows
Maria Emilia Röhr1,2 , Marianne Holmer2 , Julia K. Baum3 , Mats Björk4 , Katharyn Boyer5, Diana Chin6, Lia Chalifour3 , Stephanie Cimon7 , Mathieu Cusson7 , Martin Dahl4 , Diana Deyanova4,8, J. Emmet Duffy9, Johan S. Eklöf4, Julie K. Geyer10 , John N. Griffin11, Martin Gullström7 , Clara M. Hereu12 , Masakazu Hori13 , Kevin A. Hovel14 ,
A. Randall Hughes15 , Pablo Jorgensen16 , Stephanie Kiriakopolos17,18, Per-Olav Moksnes19 , Masahiro Nakaoka20 , Mary I. O’Connor21 , Bradley Peterson6, Katrin Reiss22, Pamela L. Reynolds23 , Francesca Rossi24 , Jennifer Ruesink25 , Rui Santos26 , John J. Stachowicz27 , Fiona Tomas18,28, Kun-Seop Lee29, Richard K. F. Unsworth11 , and Christoffer Boström1
1
Faculty of Science and Engineering, Environmental and Marine Biology, Åbo Akademi University, Åbo, Finland,
2Department of Biology, University of Southern Denmark, Odense M, Denmark,3Department of Biology, University of
Victoria, British Columbia, Canada,4Department of Ecology, Environment and Plant Sciences, Stockholm University,
Stockholm, Sweden,5Estuary and Ocean Science Center, San Francisco State University, Tiburon, CA, USA,6School of
Marine and Atmospheric Sciences, Stony Brook University, Southampton, NY, USA,7Département des sciences
fondamentales and Québec-Océan, Université du Québec à Chicoutimi, Québec, Canada,8Institute for Biodiversity and
Ecosystem Research, Bulgarian Academy of Sciences, Sofia, Bulgaria,9Tennenbaum Marine Observatories Network,
Smithsonian Institution, Edgewater, MD, USA,10Institute of Marine Sciences, University of North Carolina at Chapel Hill,
Morehead City, NC, USA,11College of Science, Singleton Park, Swansea University, Swansea, UK,12Facultad de Ciencias
Marinas, Universidad Autónoma de Baja California, Ensenada, Mexico,13Fisheries Research and Education Agency,
National Research Institute of Fisheries and Environment of Inland Sea, Hatsukaichi, Japan,14Department of Biology and
Coastal and Marine Institute, San Diego State University, San Diego, CA, USA,15Department of Marine and
Environmental Science, Northeastern University, Nahant, MA, USA,16Geomare, Ensenada, Mexico,17Estuary and Ocean
Science Center and Department of Biology, San Francisco State University, Tiburon, CA, USA,18Department of Fisheries
and Wildlife, Oregon State University, Corvallis, OR, USA,19Department of Marine Sciences, University of Gothenburg,
Goteborg, Sweden,20Akkeshi Marine Station, Field Science Center for Northern Biosphere, Hokkaido University,
Hokkaido, Japan,21Department of Zoology and Biodiversity Research Centre, University of British Columbia, Vancouver,
British Columbia, Canada,22Faculty for Biosciences and Aquaculture, Nord University, Bodø, Norway,23Data Science
Initiative, University of California, Davis, CA, USA,24CNRS, Centre for marine Biodiversity, Exploitation and Conservation
(MARBEC), University of Montpellier, France,25Department of Biology, University of Washington, Seattle, WA, USA,
26
ALGAE-Marine Ecology Research Group, CCMar-Center of Marine Sciences, University of Algarve, Faro, Portugal,
27Department of Evolution and Ecology, University of California, Davis, CA, USA,28IMEDEA, UIB-CSIC, Esporles, Spain,
29
Department of Biological Sciences, Pusan National University, Pusan, South Korea
Abstract
Despite the importance of coastal ecosystems for the global carbon budgets, knowledge of their carbon storage capacity and the factors driving variability in storage capacity is still limited. Here we provide an estimate on the magnitude and variability of carbon stocks within a widely distributed marine foundation species throughout its distribution area in temperate Northern Hemisphere. We sampled 54 eelgrass (Zostera marina) meadows, spread across eight ocean margins and 36° of latitude, to determine abiotic and biotic factors influencing organic carbon (Corg) stocks in Zostera marina sediments. The Corg stocks (integrated over 25-cm depth) showed a large variability and ranged from 318 to 26,523 g C/m2with an average of 2,721 g C/m2. The projected Corgstocks obtained by extrapolating over the top 1 m of sediment ranged between 23.1 and 351.7 Mg C/ha, which is in line with estimates for other seagrasses and other blue carbon ecosystems. Most of the variation in Corgstocks was explained byfive environmental variables (sediment mud content, dry density and degree of sorting, and salinity and water depth), while plant attributes such as biomass and shoot density were less important to Corgstocks. Carbon isotopic signatures indicated that at most sites<50% of the sediment carbon is derived from seagrass, which is lower than reported previously for seagrass meadows. The high spatial carbon storage variability urges caution in extrapolating carbon storage capacity between geographical areas as well as within and between seagrass species.RESEARCH ARTICLE
10.1029/2018GB005941
Key Points:
• The Z. marina Corgstocks varied widely within and across studied regions; majority of this variation was explained byfive sediment and environmental variables • The Z. marina Corgstocks were
comparable to other seagrass species and other blue carbon habitats such as salt marshes and mangrove forests • Carbon isotopic signatures indicated that at most sites, only less than half of the sediment carbon is derived from seagrass, though variation was significant Supporting Information: • Supporting Information S1 Correspondence to: M. E. Röhr, mrohr@abo.fi Citation:
Röhr, M. E., Holmer, M., Baum, J. K., Björk, M., Boyer, K., Chin, D., et al. (2018). Blue carbon storage capacity of temperate eelgrass (Zostera marina) meadows. Global Biogeochemical Cycles, 32, 1457–1475. https://doi.org/10.1029/ 2018GB005941
Received 2 APR 2018 Accepted 14 SEP 2018
Accepted article online 19 SEP 2018 Published online 8 OCT 2018 Corrected 21 JAN 2019
This article was corrected on 21 JAN 2019. See the end of the full text for details.
©2018. American Geophysical Union. All Rights Reserved.
1. Introduction
The oceans contain the largest carbon pool on Earth and have absorbed about one third of anthropogenic CO2emissions through physical, chemical, and biological processes (Intergovernmental Panel on Climate Change, 2014; Sabine et al., 2004). Coastal vegetated ecosystems play a fundamental role in carbon storage, and the term blue carbon has been created to describe the carbon stored by marine ecosystems, seagrasses, salt marshes, and mangroves, in particular (Herr et al., 2012). Altogether, these ecosystems cover only 0.2% of the oceanfloor but hold a sediment carbon storage equal to over half of the global green carbon storage (carbon stored in terrestrial ecosystems and their soils) and up to 33% of the total oceanic CO2uptake
(Duarte, 2017; Duarte et al., 2005; Hemminga & Duarte, 2000; McLeod et al., 2011; Nellemann et al., 2009). Furthermore, some marine ecosystems can store carbon up to millennial time scales, while the carbon stored by terrestrial systems is usually sequestered up to decades (Mateo et al., 1997; Mazarrasa et al., 2017a; Samper-Villarreal et al., 2018). However, the longevity of carbon storage varies considerably among species and habitats within both marine and terrestrial systems, most likely due to species-specific traits such as length of the growing season, chemical composition of the plant tissues and plant growth rate, and environ-mental characteristics like temperature, disturbance, and sediment oxygenation (Mateo et al., 2006; Mazarrasa et al., 2018; Russel et al., 2013).
Within marine and estuarine ecosystems, seagrass sediment carbon storage is believed to average at 83,000 Mg/km2, thus equivalent to a total global blue carbon storage of 19.9 × 10⁹Mg (Fourqurean et al., 2012; Macreadie et al., 2013). Despite the limited areal extent of seagrass meadows, their contribution to car-bon accumulation per unit area is up to 3 orders of magnitude higher than that of terrestrial soils, primarily due to the high capacity of seagrasses to trap particles by reducing waterflow, wave energy, and sediment resuspension (Agawin & Duarte, 2002; Bos et al., 2007; Fonseca & Cahalan, 1992; Gacia et al., 2002; Gacia & Duarte, 2001; Hendriks et al., 2008; Kennedy & Björk, 2009; Koch et al., 2006). High carbon accumulation rates are also promoted by slow decomposition of organic material in the often hypoxic seagrass sediments, high proportion of refractory organic compounds, and high C:N:P ratios. Together, these characteristics make sea-grass material less labile and biodegradable and thus more easily stored than tissues of most other marine angiosperms and algae (Enriquez et al., 1993; Fourqurean & Schrlau, 2003; Holmer et al., 2009; Kennedy et al., 2010; Kristensen & Holmer, 2001; Pedersen et al., 2011; Vichkovitten & Holmer, 2004).
Seagrass habitats are highly productive ecosystems and most act as net sinks of carbon (Duarte & Cebrián, 1996; Duarte et al., 2010). Generally, seagrass species with high rates of production also support high sedi-ment organic carbon stocks (the amount of carbon stored in the sedisedi-ment down to a predefined depth, here-after Corgstocks; Duarte et al., 2010; Hemminga & Duarte, 2000; Lavery et al., 2013; Rozaimi et al., 2016). In
addition, larger seagrass species tend to have higher production rates, higher carbon burial rates, and higher sediment Corgstocks due to a taller plant canopy, which enhances particle trapping and growth of larger,
more persistent belowground tissues (Duarte & Chiscano, 1999; Lavery et al., 2013). An extreme example of this is Posidonia oceanica, an endemic Mediterranean seagrass species capable of high levels of carbon sequestration in their extensive belowground rhizome mats, far exceeding the carbon sink capacity of other seagrasses, as well as other blue carbon sources (Duarte et al., 2005; Duarte, Kennedy, et al., 2013; Fourqurean et al., 2012; Kennedy & Björk, 2009; Lavery et al., 2013; Serrano et al., 2014, 2015). Furthermore, carbon stored in the mats formed by P. oceanica date back up to 12,500 years, while Corgstocks of other seagrass species,
such as Zostera marina and Cymodocea nodosa, have typically formed within shorter time scales of up to sev-eral centuries of age (Alberto et al., 2001; Arnaud-Haond et al., 2012; Mateo et al., 1997; Reusch et al., 1999). In addition to particulate organic carbon (hereafter POC) and seagrass biomass, the seagrass sediment Corg can be augmented by other carbon sources including phytoplankton, terrestrial plant detritus, macroalgae, epiphytes, and benthic microalgae (Bouillon & Boschker, 2006; Fry et al., 1977; Fry & Sherr, 1984; Holmer et al., 2004; Kennedy et al., 2010, 2004; Moncreiff & Sullivan, 2001; Ricart et al., 2017; Röhr et al., 2016). These additional sources vary considerably in input and decomposition rates over time, thus influencing the lability and magnitude of Corgstocks in seagrass sediments (Kennedy et al., 2010, 2004). In general,
benthic microalgae, epiphytes, and phytoplankton are more labile sources of Corg, while the decay of macro-phyte and terrestrial Corgis usually slower (Bouillon & Boschker, 2006; Mateo et al., 2006; Vichkovitten &
Holmer, 2004). Recent studies have also emphasized how environmental conditions affect seagrass Corg
example, sediment density and grain size can influence the availability of oxygen in the sediment and there-fore the rate of bacterial decomposition. Moreover, water temperature (Bouillon & Connolly, 2009; Clausen et al., 2014; Moore & Short, 2006), salinity (Watanabe & Kuwae, 2015), water depth (Serrano et al., 2014; Samper-Villarreal et al., 2016), dissolved inorganic carbon concentration (Beer et al., 2014), and light availabil-ity (Eriander, 2017; Serrano et al., 2014) all affect the balance of net communavailabil-ity production and respiration, with high temperature and fraction of inorganic carbon content leading to elevated rates of carbon minera-lization, while increased salinity and water depth usually lead to lower production rates, hence, influencing the formation of sediment Corgstocks.
Although the contribution of seagrasses to global oceanic carbon storage has been quantitatively acknowl-edged, most estimates come from just a few sites and seagrass species (Dahl et al., 2016; Greiner et al., 2013; Gullström et al., 2018; Macreadie et al., 2013; Miyajima et al., 2015; Serrano et al., 2014, 2015; Röhr et al., 2016). Importantly, the anomalously high belowground accumulation of carbon in P. oceanica meadows might lead to overestimation of the global seagrass Corgstock if values for this species are applied as broad proxies for
other seagrass species. Furthermore, interactions between seagrass species identity and bed characteristics (e.g., shoot density, shoot size, and belowground structure) with local environmental drivers (e.g., sediment characteristics, allochthonous inputs, and temperature) may confound global extrapolation of the total mag-nitude of seagrass Corg stocks in the absence of standardized, broad-scale sampling, which incorporate
these covariates.
The foundation species eelgrass (Z. marina L.) is a relatively fast-growing seagrass species forming dense meadows in both intertidal and subtidal areas across the temperate Northern Hemisphere (Moore & Short, 2006). Z. marina is among the most widespread seagrass species, covering a large geographic range (Boström et al., 2014; Moore & Short, 2006; Spalding et al., 2003), thus potentially contributing significantly to the global seagrass blue carbon stock. Z. marina is well known for its structural and functional role as a key species in many marine ecosystems (e.g., Boström et al., 2014; Spalding et al., 2003), but despite its large distribution area, information on local, regional, and global blue carbon stocks in Z. marina meadows is lim-ited and generated from a handful of studies focusing on relatively small regional areas (Dahl et al., 2016; Greiner et al., 2013, 2016; Miyajima et al., 2015; Röhr et al., 2016).
Here we quantified the magnitude of Z. marina sediment carbon storage across its full geographic range. To do so, we coordinated a standardized sampling program spanning 36° of latitude and eight different ocean margins and seas. Specifically, we compared the organic carbon stored in the sediment among eelgrass mea-dows, identified the main carbon sources contributing to the sediment carbon stock, and explored the envir-onmental variables driving the observed patterns. Finally, we compared the global carbon storage capacity of Z. marina to that of terrestrial and coastal ecosystems. Specifically, we addressed the following questions: 1. What is the magnitude and variation of Z. marina sediment Corgstocks?
2. What are the abiotic and biotic environmental factors explaining the variation in Z. marina Corgstocks
among regions?
3. What are the main carbon sources in Z. marina sediments, and do they vary systematically across and within regions?
4. How do Northern Hemisphere Z. marina meadows rank globally in terms of magnitude of Corgstocks and
carbon storage capacity compared to other coastal and terrestrial carbon sink ecosystems?
2. Materials and Methods
2.1. Study Area
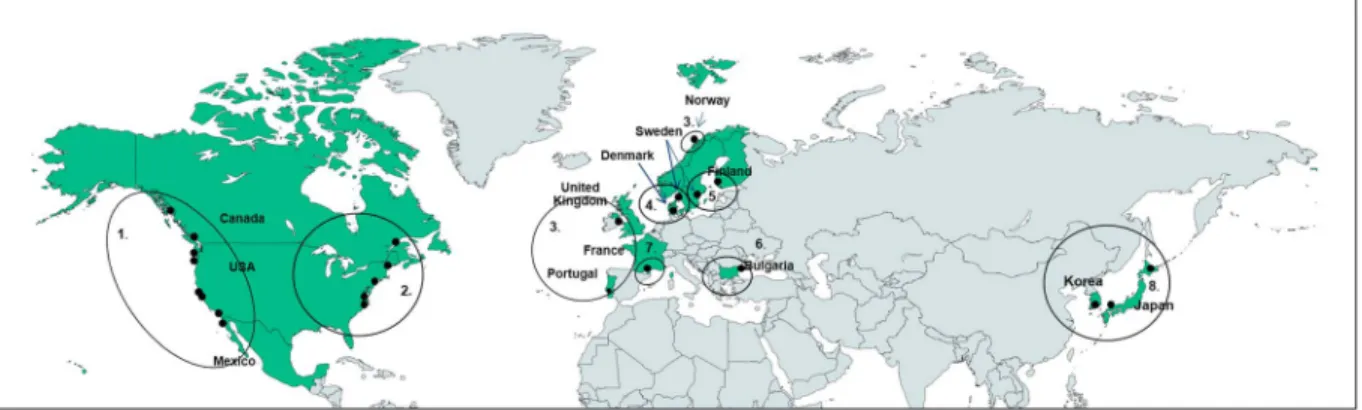
Plant and sediment samples were collected from 54 sites located in 13 countries (Bulgaria, Canada, Denmark, Finland, France, Japan, Korea, Mexico, Norway, Portugal, Sweden, United Kingdom, and United States) across eight ocean margins and seas (Eastern and Western Atlantic, Eastern and Western Pacific, Baltic Sea, Black Sea, Mediterranean Sea, and Kattegat-Skagerrak) during summer (June to September) 2015 (Figure 1). Water depth at the sites ranged from 0.5 to 3 m covering subtidal, shallow subtidal, and intertidal zones, where the mean annual water temperature ranged from 7 to 20 °C and salinity ranged from 6.5 to 38.8. The light periods at the sampling time ranged from 12 to 24 hr (Table S1 in the supporting information). The samples were collected within the Zostera Experimental Network, ZEN (www.zenscience.org), a
collaboration between scientists addressing the structure and functioning of eelgrass ecosystems (see, e.g., Duffy et al., 2015).
2.2. Field Sampling
At each site, meadows in which Z. marina was the dominant seagrass species were chosen for sampling, when monospecific meadows were not abundant. Although Z. marina was the dominant seagrass species, 15 sites had mixed meadows that included other species such as Ruppia spp., Potamogeton spp., Halodule spp., Zostera noltii, and Zostera japonica, although only Z. marina was collected for sampling of the plant variables. Z. marina aboveground and belowground biomass samples were collected with a corer (length 20 cm and diameter 25 cm) from three randomly chosen plots separated by 15 m within the interior (5–10 m from the meadow edge) of the Z. marina bed. Shoot density was quantified within a 0.25-m2 frame. Sediment carbon was sampled using a 50-cm-long acrylic corer (diameter 5 cm, n = 3). Three 25-cm sediment samples were randomly collected from a single meadow within the sampling site. The corer was manually forced to the depth of at least 25 cm, capped at both ends underwater and trans-ported to the laboratory for further analysis. Due to limited resources, no samples were collected from adjacent bare (unvegetated) sediments. Finally, samples (approximately 10 g of wet material) of plants and algae (drift algae, other angiosperms, and epiphytes) considered to be the most likely alternative car-bon sources were collected from each site for stable isotope analysis. The number of potential carcar-bon sources within sites varied between 2 and 6.
2.3. Plant Variables
In a local laboratory at each site, aboveground and belowground parts of Z. marina were separated and rinsed with freshwater, then leaves and rhizomes were cleaned of epiphytes, detritus, and fauna using a scal-pel. All plant material was dried for 48 hr at 60 °C. The belowground biomass was separated into living and dead rhizomes, and each fraction was dried separately. All samples were analyzed for stable isotopes of car-bon and nitrogen (13C and15N), organic carbon (OC), and particulate organic nitrogen (PON) content to determine their relative contribution to the sediment Corgstock. A pooled sample of two young leaves from
10 randomly selected shoots were used for the analysis of aboveground tissue, while samples of both living and dead rhizomes were used for analysis of belowground tissue. All samples, including additional carbon sources, were analyzed with Thermo Scientific, delta V advantage, isotope ratio mass spectrometer (with Vienna Peedee belemnite as reference material) connected to elemental analyzer. Site-specific values for measured plant variables are given in Table S2. Due to lack of in situ sampling of phytoplankton at the sites, δ13C values from the literature were used in the stable isotope analysis (Conway-Cranos et al., 2015; Goering
et al., 1990; Jorgensen et al., 2007; Kang et al., 2015; Kajihara et al., 2010; Miyajima et al., 2015; Pernet et al., 2012; Röhr et al., 2016; Tagliabue & Bopp, 2008; Tiselius & Fransson, 2015). Theδ13C values for plankton selected from the literature for each site and used in the analysis are given in Table S3.
Figure 1. The study sites in the Northern Hemisphere (with sampled countries in green). Black dots indicate the sampling sites, except for in Bulgaria, Denmark, Finland, and Sweden, in which one dot indicates multiple (n = 2–10) sites. Ocean margins and seas are labeled by numbers: 1 = Eastern Pacific; 2 = Western Atlantic; 3 = Eastern Atlantic; 4 = Kattegat-Skagerrak; 5 = Baltic Sea; 6 = Black Sea; 7 = Mediterranean Sea; 8 = Western Pacific. For site names see Table S1.
2.4. Sediment and Environmental Variables
In the laboratory, sediment cores were sliced intofive sections of 5 cm down to 25 cm. All visible plant mate-rial and fauna were removed, and the sediment was homogenized. A 20-ml subsample taken from the 0- to 5-cm section was used for grain size analysis, using a Malvern Mastersizer 3000 particle size analyzer to deter-mine the sediment mud content (%). Sediment mud content was calculated as the size fraction (%) of clay and silt (0–63 μm) present. Degree of sorting, calculated from the different sediment grain size fractions, was used as a proxy for degree of exposure of the site (see Folk & Ward, 1957). A 5-ml subsample was then taken from each sediment section and weighed before and after drying at 105 °C for 6 hr for determination of basic sediment characteristics (sediment water content, dry bulk density, and porosity). These characteristics were then used in calculations of sediment Corgstocks. The dried subsamples from each layer were
homoge-nized in a mortar and divided into two subsamples, from which one was used for analysis of sediment organic content (loss on ignition, 4 hr in 520 °C), and the other for analysis ofδ13C,δ15N, PON, and organic carbon (OC), as described above for the plant material. Prior to analysis, the 0- to 5-cm sediment layers were acidified to remove carbonate material that could cause possible bias in estimations of the sediment Corgstocks. The
average sampling depth was calculated for each site, and values for mean annual water temperature and sali-nity were obtained from the ZEN database for the different study regions (Table S1).
2.5. Sediment CorgSources
The sediment surfaceδ13C values were used in the analysis of contribution of different carbon sources to the sediment surface (0–5 cm) Corgpool. The sediment surface section was used for the analysis as this was the
section in which other potential carbon sources were most likely to accumulate. To estimate the contribution of the potential carbon sources to the sediment surface Corgstock, the R function mixSIR.unknownGroups was used (Ward et al., 2011). This method is recommended when the number of sources exceeds the number of tracers +1, and the grouping of sources may be necessary to reduce bias in the posterior estimates. The func-tion indicates the optimal number of groups and identifies groups by evaluating the likelihood of different source groupings, while simultaneously estimating the proportional contribution of each source group to the sediment surface Corgpool. The number of groups and source membership per site was based on the
fre-quency of posterior cooccurrence, in order to identify the most parsimonious model formulation. However, for some sites other groupings with only slightly lower posterior probabilities were selected to prioritize bio-logical or ecobio-logical similarities between sources. To characterize theδ13C of Z. marina (n = 3), theδ13C of Z. marina leaves, living, and dead rhizomes were averaged within each site prior to the analysis, since they were drawn from the same Z. marina shoots, and because all the Z. marina sources had statistically similar isotopic signatures. The number of samples of other abundant Corgsources within the meadow (e.g., epiphytes,
phy-toplankton, and drift algae) varied between 1 and 4. When n = 1, we assumed an standard deviation = 0.5 to reflect similar variability of the isotopic signatures as for the replicated sources of Corgin this study. Assuming
isotopic variability for samples with no replicates is statistically desirable, since the posterior draws depend on the variance estimates and the extent to which the isotope mixing model precludes the contribution of sources included in the model. If the isotope signatures of source have no variances, very few of the random draws representing proportional contributions will be resampled, because most draws will have very low like-lihoods (Ward et al., 2011). An advantage of Bayesian mixing models such as mixSIR.unknownGroups is that it explicitly deal with variability among mixture and source isotopic signatures, accounting for error propaga-tion in their estimates of source contribupropaga-tions to a mixture (Phillips et al., 2014). By default mixSIR. unknownGroups incorporate a term for variation in consumer tracer values due to the sampling process (process error). We also included a residual error term, since sediment sourcing mixtures integrate large quan-tities of source particles, and it is realistic to assume that each mixture data point deviate from the mean of the population due to causes of mixture variability not accounted by process error. We ran 100,000 posterior draws for each model. Results are reported as percentage contribution from each source to the sediment sur-face carbon pool.
2.6. CorgStock Calculations
Carbon density (mg C/cm3) was calculated by multiplying OC (mg/g DW) measured at each sediment layer with the corresponding sediment dry density (g/cm3). The Corgstock was calculated by depth integration of carbon density (0–25 cm) using calculations described in detail in Lavery et al. (2013) and given as Corg
stock (g C/m2). The projected Corgstock for data from this study was estimated by multiplying the Corgstock
by four to estimate the Corgstocks to 100-cm depth and given as projected Corgstock (t C/ha). It should be noted that the Mediterranean value was derived from a single site. The projected Corgstock in Z. marina
sedi-ments at the different ocean margins and seas was estimated by extrapolating to 100-cm depth to compare with previously reported Corgstocks of other seagrass species, other blue carbon habitats (e.g., saltmarshes
and mangroves), and terrestrial ecosystems. The 25-cm depth has been previously shown to allow extrapola-tion to the top 100 cm (e.g., Fourqurean et al., 2012; Lavery et al., 2013), although it is unlikely that the sedi-ment Corgstock would stay stable throughout the 100-cm sediment profile and often either decreases or
increases with depth. While we recognize that these estimations represent extrapolation from a limited set of regions and require some untested assumptions (namely, uncertainty in the stability of the depth profiles of sediment Corgstocks), they are required to directly compare the carbon storage capacity of Z. marina with
other known blue and green carbon stocks, as most of the values used for comparison in this study were measured from the top 1-m section.
2.7. Predictors of Among-Site Variation in Carbon Stocks
To explain the among-site variation in carbon stocks, we statistically assessed the relative importance of environmental variables (latitude, water depth, salinity, and water temperature), sediment variables (sedi-ment density, sedi(sedi-ment mud content, degree of sedi(sedi-ment sorting, and15N content of sediment) and charac-teristics of seagrass meadows (15N content of Z. marina eelgrass leaves, PON content of Z. marina leaves, Z. marina shoot density, aboveground Z. marina biomass, belowground Z. marina biomass, root: shoot ratio, and Z. marina contribution to the sediment surface Corgpool). We used partial least squares (PLS) regression in SIMCA 13.0.3 software (UMETRICS, Malmö, Sweden) to model projections to latent structures (Wold et al., 2001) on untransformed data. PLS is a developed generalization of multiple linear regression, where latent structures (i.e., variables with the best predictive power) are constructed based on linear associations between a set of predictor variables (x) and the response variable (y). PLS regression modeling was used since this technique can handle multicollinearity and large numbers of predictor variables (Carrascal et al., 2009). This regression technique is applicable in analyses of various types of ecological data (e.g., Asplund et al., 2011; Carrascal et al., 2009; Staveley et al., 2017) and has recently been used to address the influence of dif-ferent types of predictors on carbon stocks (Dahl et al., 2016; Gullström et al., 2018). We also used principal component analysis (PCA) to visualize general relationships between ocean margins or seas and environmen-tal predictors (i.e., thefive predictors having a major contribution to the PLS model) and the Corgstock (g C/
m2). Prior to the PCA, data were transformed using Log(x + 1). A significance level of 95% (p < 0.05) was used in the analysis.
3. Results
3.1. Magnitude of Sediment Carbon Stocks
Carbon density (mg C/cm3) in the upper 25 cm of the sediment showed marked differences between the ocean margins and seas with site-specific averages ranging from 1.7 ± 0.5 mg C/cm3, in the Baltic Sea area to 37.9 ± 8.5 mg C/cm3, in the Mediterranean Sea (Table 1). The average carbon density for all sites was 11.4 ± 4.3 mg C/cm3 (Table 1). The average depth-integrated (0–25 cm) Corg stock for all sites was
2,721 ± 989 g C/m2, but the range of variation between sites (318 ± 10 to 26,523 ± 667 g C/m2) and regions (578 ± 43 to 8,793 ± 2,248 g C/m2) was substantial (Table 1 and Figures 2a and 3). The average Corgstocks in
the regions per unit area were lowest in the Baltic and Black Seas and highest in the Kattegat-Skagerrak and Mediterranean ocean margins, although sites within regions varied considerably (Table 1 and Figure 3). In addition, Kattegat-Skagerrak and Mediterranean Sea had twofold to eightfold higher average Corgstocks
(4,862 ± 741 and 8,793 ± 2,248 g C/m2, respectively) than the rest of the studied regions. The average Corg
stocks for the Atlantic and Pacific Ocean margins were moderate compared to Corgstocks at the
Kattegat-Skagerrak and Mediterranean regions and varied only modestly within each ocean margin (Table 1 and Figure 3). Furthermore, the average Corg stocks were almost equal in Eastern and Western Atlantic (1,384 ± 241 and 1,349 ± 194 g C/m2, respectively), while average Corg stocks in Eastern and Western
Pacific Ocean margins were slightly higher (1,736 ± 210 and 2,343 ± 122 g C/m2, respectively). The average projected Corgstocks of the Z. marina sediments obtained by extrapolating to 100-cm depth ranged between
23.1 (Baltic Sea) and 351.7 Mg C/ha (Mediterranean Sea; Table 1). The average projected Corgstock for all the
studied regions was 108.9 Mg C/ha (Table 1).
3.2. Environmental Factors Driving Among-Site and Regional Variation in Sediment CorgStocks
Overall, we found that the sediment organic content was considerably higher in the Kattegat-Skagerrak and Mediterranean Sea than in the other study regions (Table 2 and Figure 4a). In contrast, sediment mud content varied widely across and within the ocean margins and was nearly 1 order of magnitude lower in the Baltic Sea and in the Black Sea than the other regions (Table 2 and Figures 2b and 4b). Both sediment organic and mud content were positively related to the sediment Corgstocks (g C/m2) (p< 0.0001, R2= 0.58, R2= 0.53, respectively), indicating the importance of sediment grain size distribution for the size of sediment Corg
stocks. Sediment mud content was also negatively related with the percent contribution of Z. marina to the sediment surface Corgpool (p = 0.0287, R2= 0.09). Degree of sorting at the individual sites indicated that our study areas encompassed both sheltered and exposed sites, with no consistent pattern in exposure across the geographical range (Table 2).
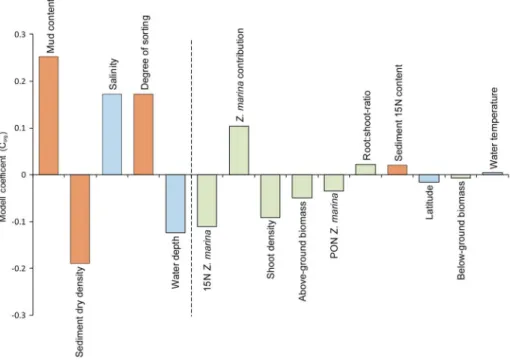
The cross-validated variance (Q2 statistics; estimates of the level of predictability of the model) of the PLS model was 51%, which is clearly higher than the 5% significance level. The cumulative fraction of the 15 envir-onmental predictor variables combined (R2y cumulative) displayed a high degree of determination and explained 62.5% of the variation in the sediment Corgstocks (g C/m2) across the study sites. Specifically, five predictors, sediment mud content, sediment density, salinity, degree of sediment sorting, and water depth, had variable influence on the projection values above 1, thereby being the major drivers (contributing more than average on the model performance) of the variation in the sedimentary Corgstocks (Figure 5). Sediment
mud content, salinity, and degree of sediment sorting were all positively related to sedimentary Corgstocks, while sediment density and water depth had negative relationships, respectively (Figure 5). The remaining predictors had less than average influence on the model performance (Figure 5).
The PCA indicated a similar pattern across the different ocean margins, supporting the PLS results offive key environmental indicators, except for Baltic Sea, which showed clear within-regional site similarity (Figure 6). The PCA model explained a large part of the variation (eigenvalues of PC1 and PC2 were 78.2% and 10.7%, respectively). PC1 and PC2 were both associated with the total variation of six variables, that is, sediment dry density, mud content (%), water depth, salinity, degree of sorting, and Corgstock. For PC2, the variation
was explained in a ranking order by Corgstock, mud content (%), salinity, water depth, sediment dry density, and degree of sorting.
3.3. Relative Contribution of Different Sources to Sediment Organic Carbon inZ. marina Beds Z. marina was the main carbon source (contribution ranging between 60% and 94%) to the sediment surface Corgpool at eight sites, whereas it contributed only 3%–47% at the remaining 46 sites (Figure 2c). The average Table 1
Summary of Carbon Storage by Region
Ocean margin/sea n Zostera marina area (km2) Corgdensity (mg C/cm3) SedOC (% DW) Corgstock (g C/m2) OC in biomass (g C/m2) Total Corg (Mt)
Projected Corgstock (Mg C/ha) Baltic Sea 13 90 1.7 ± 0.5 0.3 ± 0.0 578 ± 43 79 ± 8 0.05 23.1 Black Sea 2 765 2.1 ± 1.1 3.5 ± 1.2 725 ± 159 63 ± 22 0.6 29.0 Eastern Atlantic 3 — 9.2 ± 5.4 0.7 ± 0.5 1384 ± 241 129 ± 35 — 55.4 Western Atlantic 5 374 4.5 ± 0.8 0.3 ± 0.0 1349 ± 194 100 ± 15 0.5 54.0 Eastern Pacific 8 1,500 5.6 ± 1.3 0.4 ± 0.1 1736 ± 210 107 ± 14 2.8 69.4 Western Pacific 3 — 11.2 ± 1.2 1.1 ± 0.1 2343 ± 122 86 ± 9 — 93.7 Kattegatt-Skagerrak 19 757 19.3 ± 3.9 2.5 ± 0.6 4862 ± 741 80 ± 7 3.7 194.5 Mediterranean Sea 1 — 37.9 ± 8.5 2.3 ± 0.0 8793 ± 2248 62 ± 8 — 351.7 Z. marina average 54 — 11.4 ± 4.3 1.4 ± 0.4 2721 ± 989 88 ± 5 — 108.9 Note. Ocean margin/sea, number of sites included (n), Z. marina distribution area (km2), sediment organic carbon density (Corgdensity, mg C/cm3), sediment organic carbon content (SedOC, % DW), average organic carbon stocks in the upper 25 cm of the sediment (Corgstock; g C/m2), OC in living Z. marina biomass (g C/m2), total organic carbon stocks in the region (total Corg; Mt), average projected organic carbon stocks extrapolated to 100-cm sediment depth (projected Corgstock; Mg C/ha) across the study regions. Mean ± SE (n = 1–19) is given. The areal estimates of the Z. marina coverage at the different regions were obtained from Green and Short (2003), Luisetti et al. (2013), and Boström et al. (2014). SE = standard error.
Z. marina contribution to the sediment surface Corgpool was highest in the Black Sea (56%) and lowest (15%)
in the Western Pacific region. The average Z. marina contribution to the sediment surface Corgpool at the
other regions ranged between 20% and 46% (Figure 4c). Other macrophyte species (Ruppia spp., Potamogeton spp., Halodule spp., and Z. japonica) contributed 12–40% at the 15 sites in which they were abundant. Phytoplankton contribution ranged between 6% and 97% and was the major (57–97%) source at 12 sites (Figure S1). Contribution of macroalgae (12 sites) (Laminaria spp., Fucus spp., Chara spp., and Dictyota spp.) was 12–49% and 10–59% for drifting algae (26 sites), respectively. Epiphyte carbon contributed 12–20% at the four sites in which it was abundant. Terrestrial sources contributed 14–32% to the Corgpool at five sites. The δ13C of the surface sediment at the sites showed no consistent patterns
across the ocean margins (Table 2 and Figure 4d). The averageδ13C of Z. marina leaves and rhizomes in the ocean margins showed higher variation than sediment surface samples, being heavily depleted in13C the Black Sea, while theδ13C at the other regions were more homogenous (Table 2 and Figure 4e). The averageδ15N of Z. marina leaves was quite homogenous for the different ocean margins and seas being
Figure 2. (a) Corgstocks (g C/m2± SE) in the top 25 cm of sediment at all sites. Note that value at site TH corresponds to right y axis. (b) Sediment mud content (% ± SE) and (c) the relative contribution of Z. marina tissues to theδ13C of the sediment surface layer (0–5 cm) at the sites. Box plots represents first and third quartiles and are shown with medians (horizontal line), means (+). The whiskers represent the 2.5–97.5th percentiles. Z. marina contribution was calculated from a pooledδ13C value of aboveground and belowground tissue. Sites are ordered according to the magnitude of Corg stocks (from lowest to highest). In Figure 2a, the sites are colored according to the study region: Black = Black Sea; brown = Baltic Sea; dark blue = Kattegat-Skagerrak; turquoise = Eastern Pacific; light blue = Western Atlantic; red = eastern Atlantic; yellow = Western Pacific; purple = Mediterranean Sea. For site names, see Table S1.
highest in Black Sea, Eastern and Western Pacific and lowest at Baltic Sea, Kattegat-Skagerrak, Eastern and Western Atlantic, and the Mediterranean Sea (Table 2).
4. Discussion
4.1. Geographic and Species-Specific Comparisons of Carbon Stocks Our geographically widespread sampling of 54 sites in eight ocean mar-gins and seas spanning three continents and 36° of latitude shows that the Corgstock at the temperate Z. marina beds is notable and appears to be on the same order of magnitude as beds dominated by many other species whose role in carbon dynamics are broadly appreciated (Figure 7). Z. marina meadows in the temperate Northern Hemisphere exhibit substantial regional and local variation in carbon storage (e.g., over eightfold differences between the Corgstocks in the Mediterranean Sea
and Kattegat-Skagerrak compared to the Baltic Sea). These differences are at large explained by sediment characteristics, salinity, and depth. In the brackish waters of the Northern parts of the Baltic Sea, Z. marina grows in relatively exposed locations (Boström et al., 2014). The exposed habitats do not promote extensive carbon sequestration due to hydrodynamic effects that export the organic matter produced in the meadows to further adjacent locations. In addition, water depth is likely to have larger indirect effects on carbon storage affecting other variables such as hydrodynamics, sediment resuspension, and erosion, which was not accounted for in this study. In contrast, the meadows in, for example, the Kattegat-Skagerrak region usually grow in sheltered depositional environments with relatively high production rates and accumulation of autochthonous organic and inorganic particles. This variation in Z. marina Corgstocks among sites and regions makes it clear that pre-vious global scale extrapolations of carbon storage in seagrass beds based on limited sampling must be regarded as tentative and are likely in need of refining.
4.2. Comparing Magnitude of Carbon Stocks inZ. marina Versus Other Seagrasses
The average total Z. marina Corgstock in the upper 25 cm of the sediment ranged from 5.8 to 87.9 Mg C/ha (average 27.2 Mg C/ha) and was lowest in the Baltic Sea and highest in Kattegat-Skagerrak region and at one site in the Mediterranean. In addition, the highest carbon storage among all sites (265.2 ± 0.67 Mg C/ha) in this study was found at a single site TH (Thurøbund) in the Kattegat-Skagerrak, indicating a potential carbon hot spot in the area. In addition, 9 out of 10 of sites exhibiting the highest Corgstocks were found in the
Kattegat-Skagerrak region, further supporting the role of this region as potential carbon hot spot, largely explained by the high organic matter content sediments found in the highly productive and sheltered sea-grass meadows in the region. Comparing the amount of carbon in living Z. marina tissue with that in the upper 25 cm of the sediment, the aboveground and belowground Z. marina biomass contributed only 3.1% of the total carbon stock, on average. Thus, the sediment carbon content is much more important that the standing biomass of Z. marina for the carbon stock and pool. This means that even though the areal extent of Z. marina meadows along Eastern Pacific Ocean margin is twice that in Kattegat-Skagerrak (1,500 versus 757 km2, respectively), the meadows in Kattegat-Skagerrak contains 35% more carbon in total (2.76 and 3.74 × 10⁹Mg, respectively). Thisfinding is supported by earlier studies in which seagrass carbon has been shown to be a minor contributor to the seagrass Corg pool compared to the sediment Corg stock (e.g., Fourqurean et al., 2012; Macreadie et al., 2013).
We projected the greatest average carbon storage in a region by extrapolating to 100-cm depth (351 Mg C/ ha), at the Mediterranean region, although this value was derived from a single site (FR), while the mean pro-jected carbon storage across the study sites was 108.9 Mg C/ha (Figure 7). The average propro-jected Z. marina Corgstock from this study was over twofold higher than that reported for Australian seagrass sediments
(50.5 Mg C/ha; Lavery et al., 2013; Figure 7). Moreover, the average projected Z. marina Corgstock for all the studied regions was higher than the average for East and Southeast Asian seagrasses (72.4 Mg C/ha; Miyajima et al., 2015) and even higher than the global average estimated (70 Mg C/ha) by Kennedy and Björk (2009). In contrast, the average projected Corg stock from this study was ~23% lower than that Figure 3. Seagrass (Z. marina) sediment organic carbon stocks (Corgg C/m2)
across the ocean margins and seas in the top 25 cm of the sediment. Box plots representsfirst and third quartiles and are shown with medians (hori-zontal line), means (+). Whiskers represent the 2.5–97.5th percentiles. Number of sites per ocean margin/sea is given above the whiskers.
estimated for tropical seagrass meadows (142.2 Mg C/ha; Alongi, 2014). In addition, the global median value widely cited in literature (139.7 Mg C/ha; Fourqurean et al., 2012) was nearly threefold higher than the median pro-jected Corgstock from this study (48.6 Mg C/ha; Figure 7). Fourqurean et al.
(2012) accounted for regional variation in seagrass Corgstocks, but we sug-gest that global estimates of seagrass carbon storage will also require understanding the species composition of the meadows, in addition to acknowledging the species-specific variation and the environmental factors affecting this variation. Indeed, results from this study suggest that a com-bination of specific environmental variables can greatly increase the carbon storage potential of Z. marina meadows. This can be applied to conserva-tion and restoraconserva-tion efforts, which focus on sites with the greatest potential contribution to offset carbon. Similar carbon hot spots exist for beds domi-nated by other species, such as P. oceanica, where average Corgstocks were
over sixteenfold higher at 2-m depth than at the 32-m depth (470 and 7,550 Mg C/ha, respectively; Serrano et al., 2014).
4.1. Environmental and Biological Factors Driving theZ. marina Carbon Stocks
Given the considerable variation among sites, and the influence of this var-iation on global estimates outlined above, better estimations for seagrass Corgstocks require an understanding of the causes of this variation. PLS
analysis revealed thatfive environmental variables explained over 62% of the variation in the Z. marina sediment carbon stocks across study sites (Figure 5). Three of these were sediment variables (mud content, sediment density, and degree of sediment sorting), and two were environmental vari-ables (water depth and salinity; Figure 5; but see Figure S2 for region-specific PLS). These findings are in line with results from earlier studies (Dahl et al., 2016; Macreadie et al., 2013; Miyajima et al., 2015; Röhr et al., 2016; Serrano et al., 2016), which have indicated that sediment characteris-tics, specifically the sediment grain size distribution and sediment density, appear to be the most important predictors for the carbon sink capacity of seagrass meadows. Thus, these variables could be used as relatively reli-able proxies for estimating Z. marina sediment carbon stocks, especially in regions where funding for research is limited (Röhr et al., 2016; Serrano et al., 2016).
The differences in sediment density and mud content are mainly driven by the exposure of the sampled meadow. Consequently, local and regional dif-ferences in exposure also influence the dynamics of accumulation of inor-ganic and orinor-ganic particles into the meadows (Hendriks et al., 2008). In this study, we used degree of sorting as a proxy for exposure (physical expo-sure through movement of water masses), which was derived from the results of sediment grain size analysis (Folk & Ward, 1957; Mazarrasa et al., 2017b). According to PLS analysis, degree of sorting was approximately of the same relative importance as salinity and was mainly driven by exposed Z. marina meadows of the Baltic Sea (Figure S2). Consequently, high expo-sure leads to the export of carbon to other adjacent locations and ecosys-tems. The importance of carbon export and connectivity among ecosystems has been partly overlooked in blue carbon studies, but recent evidence suggests that carbon exported away from blue carbon ecosys-tems may contribute significantly to organic carbon stocks in other loca-tions and ecosystems, thereby potentially biasing estimates of global carbon budgets (Barron et al., 2014; Barron & Duarte, 2015; Duarte &
Table 2 Summ ary of Poten tial Environment al Drivers for Carbon Storage by Reg ion Ocean margi n/ sea n Shoot densi ty (shoo ts m 2 ) AB (gD W m 2 ) BB (gD W m 2 ) R:S δ 13 C Z. marin a leaves δ 13 C Z. marina rhiz omes δ 13 C sedi men t surface 15 N Z. marina leav es Sed OM (% DW) Mud cont ent (%) Dry dens. (g/cm 3 )D S (φ ) BS 13 3 9 7 ± 6 3 1 1 8 ± 17 1 0 2 ± 19 1.3 ± 0.5 11.8 ± 0.9 1 1.4 ± 0.7 18 .9 ± 0 .8 6.7 ± 0.4 1.1 ± 0.1 5 .9 ± 0.8 1.3 ± 0.1 1.3 ± 0.1 BLS 2 7 36 ± 4 59 1 2 0 ± 56 72 ± 3 2 0.5 ± 0.1 17.8 ± 0.7 1 5.5 ± 0.7 16 .6 ± 5 .6 10.0 ± 1.1 0.7 ± 0.1 3 .6 ± 0.6 1.3 ± 0.1 1.6 ± 0.3 EA 3 7 74 ± 2 75 78 ± 1 0 2 64 ± 1 3 4 1.6 ± 0.4 10.2 ± 1.5 9.9 ± 1.2 19 .1 ± 0 .5 6.7 ± 0.7 2.3 ± 0.4 24 .0 ± 9.2 1.2 ± 0.2 1.3 ± 0.4 WA 5 3 81 ± 2 02 1 8 3 ± 46 1 8 0 ± 41 1.1 ± 0.1 9.2 ± 0.8 1 0.1 ± 0.6 18 .1 ± 0 .6 7.2 ± 0.8 1.2 ± 0.2 21 .4 ± 3.2 1.5 ± 0.1 1.7 ± 0.2 EP 8 5 49 ± 3 16 2 3 2 ± 61 1 1 1 ± 47 0.6 ± 0.2 10.5 ± 0.4 1 0.6 ± 0.4 20 .2 ± 0 .9 9.9 ± 1.1 3.8 ± 1.9 21 .3 ± 2.8 1.4 ± 0.1 1.4 ± 0.2 WP 3 2 87 ± 8 0 1 94 ± 5 3 5 6 ± 16 0.4 ± 0.2 9.9 ± 0.7 1 0.4 ± 0.6 18 .9 ± 0 .7 9.2 ± 1.5 4.1 ± 1.1 72 .5 ± 4.4 1.0 ± 0.0 2.1 ± 0.1 K-S 19 3 1 9 ± 3 5 1 2 9 ± 15 1 2 5 ± 26 1.2 ± 0.3 9.4 ± 0.5 1 0.4 ± 0.5 17 .6 ± 0 .9 6.1 ± 0.7 7.2 ± 1.2 32 .9 ± 3.3 0.9 ± 0.1 1.6 ± 0.1 MED 1 2 23 ± 5 5 7 3 ± 14 1 4 4 ± 40 2.4 ± 1.0 5.1 ± 0.4 7.4 ± 0.9 17 .5 ± 0 .8 5.1 ± 0.4 7.0 ± 2.2 76 .3 ± 0.7 1.3 ± 0.2 2.1 ± 0.0 Z. m arina average 54 4 1 9 ± 5 7 1 4 6 ± 13 1 2 7 ± 17 1.8 ± 0.6 10.5 ± 3.5 1 0.8 ± 0.3 18 .3 ± 0 .4 7.1 ± 0.4 3.00 ± 0.6 24 .9 ± 3.0 1.00 ± 0.1 1.5 ± 0.1 Note .The ocean ma rgin/se a, nu mber of site s inclu ded (n ), sho ot densi ty (shoo ts m 2 ), seagra ss abo vegro und and belowground bioma ss (AB and BB, g DW/m 2 ), root: shoot ra tio (R:S), δ 13 Co f Z. marina leav es, δ 13 Co f Z. marina rhiz omes, δ 13 C o f sedime nt surface, 15 N con tent of Z. marina leav es, sedi ment or ganic matter cont ent (SedOM, % DW) ,sedi men t m u d cont ent (%), sedime nt dry densi ty (dry dens., g/c m 3 ), and degree of sorting (DS, φ ) a t the ocean margi ns and sea s. ±SE (n =1 –19 ) is given. EA = Eastern Atlantic; WA = Western Atlant ic; EP = Easter n Paci fi c; WP = Western Paci fi c; BS = B a ltic Sea; K-S = Kattega t-Skager rak; BLS = Black Sea ; MED = Med iterranean Sea .
Krause-Jensen, 2017; Hyndes et al., 2014). Earlier studies support this hypothesis; for example, Duarte and Cebrián (1996) showed that ~25% of the net primary production in seagrass meadows is being exported. Similarly, they estimated that ~30% and 19% of net primary production is being exported from mangroves and salt marsh ecosystems. Moreover, recent studies have highlighted that macroalgae, which have not previously been recognized as contributing to carbon storage, might make significant contributions to blue carbon stocks as a carbon donors to adjacent blue carbon habitats (Hill et al., 2015; Krause-Jensen & Duarte, 2016; Trevathan-Tackett et al., 2015). This exchange of organic matter across ecosystem boundaries has inevitable consequences for the availability of the organic matter and burial, mineralization, and consumption of organic carbon by microbial communities and higher trophic levels (Barron et al., 2014; Barron & Duarte, 2015; Duarte & Krause-Jensen, 2017; Hyndes et al., 2014). Carbon export is also highly important for the implementation of blue carbon offset credits due to the risk of duplicating carbon sequestration estimates, both at source and sink ecosystems (Hejnowicz et al., 2015). A recent study, encompassing both intertidal and subtidal and tropical and temperate seagrass ecosystems showed that presence of seagrass resulted in an average difference in surface elevation rate of 31 mm/year, compared to adjacent unvegetated sediments (Potouroglou et al., 2017). Furthermore, although not mea-sured in this study, the structure of seagrass meadows can also be a potentially important predictor for the magnitude and source of seagrass Corgstocks. Gullström et al. (2018) showed that in tropical East Africa, land-scape configuration, along with sediment characteristics and seagrass biomass, was the most important pre-dictor variables for seagrass sediment Corgstocks. Similarly, Ricart et al. (2017) showed that continuous P. Figure 4. The (a) organic content (organic matter, OM %), (b) mud content (%), (c) Z. marina contribution to the upper 5 cm of the sediment surface Corgpool (%), (d)δ13C of sediment surface samples, and (e)δ13C of Z. marina leaves across the ocean margins and sea box plots representsfirst and third quartiles and are shown with medians (horizontal line), means (+). Whiskers represent the 2.5th to 97.5th percentiles. Boxes are not shown for sites in which n≤ 3.
oceanica meadows may store up to three times more Corg, per area, than seagrasses growing in small
patches, and it is likely that similar trends can be found also in other seagrass species. This variation was explained by elevated rates of remineralization and resuspension, caused by reduced plant canopy in small, patchy meadows. In addition, in patchy meadows, seston, and other allochthonous inputs were the major sources of accumulating Corg, while in continuous meadows with higher Corgstocks, the major Corg
source was of autochthonous origin. Various studies have reported higher Corg accumulation rates for Figure 5. Partial least square regression model coefficient plot showing the relative importance of different predictor vari-ables. Predictor variables are ranked in order of importance (from the left to the right), in which thefive variables left of the dashed line have variable influence on the projection values above 1 (and hence an above average influence on Corg stocks). Brown bars represent sediment characteristics, green bars represent seagrass-associated variables, and blue bars are environmental variables. PON = particulate organic nitrogen.
Figure 6. Principal component analysis showing how the eight regions are related to the most influential predictor vari-ables (see Figure 5) and in terms of Corgstock data (i.e., the response variable). The horizontal axis (PC1) accounts for 78.2% of the total variance, while the vertical axis (PC2) accounts for 10.7% of the total variance.
seagrass sediments than predicted from plant production alone, indicating that allochthonous sources must be important contributors to the seagrass sediment Corgstocks (Bouillon & Boschker, 2006; Kennedy et al.,
2010). Kennedy et al. (2010) compiled data from 123 seagrass meadows and showed that on average, ~50% of Corgin seagrass sediments was of autochthonous origin. In our study, Z. marina derived detritus was the
major contributor (60–94%) to the sediment surface Corgpool at only 8 out of 54 sites contributing on
average 30.5 ± 3.1% to the sediment surface Corgpool across the study regions. Although results from the PLS analysis revealed that Z. marina contribution to the sediment surface Corg pool explained only
relatively small fraction of the variation in Corgstocks, we note that a sizable fraction of the Corgat many sites was derived from seagrass, although the proportion of this fraction varied considerably among sites (Figure 2c). Furthermore, even though Z. marina contribution was not among the most important predictors, the presence of Z. marina meadows still enhances the production of epiphytes, microalgae, and macroalgae, traps allochthonous organic particles, and reduces sediment resuspension and waterflow, thus resulting in high sequestration contributing to the formation of sediment Corgstocks (see Figure S14
for phytoplankton contribution to the sediment surface Corgpool). In addition, due to limited resources,
we could not date our sediment cores and interpret the results from stable isotope mixing model in context of the information given by dating the core. The analysis of source contribution to the sediment Corg pool was run only for the surface layer, which gives us a proxy of the potential contribution of
different carbon sources in the most recent times, but does not really hold information about the past. The δ13
C value typically gets closer toδ13C of seagrass in the deeper layers especially in the high Corgstock Figure 7. The total Corgstock (Mg C/ha) in top 100 cm of soil in terrestrial and blue carbon ecosystems (boreal forest, man-groves, salt marshes, tropical forest, and temperate forest), other seagrass species (Posidonia sinuosa, Posidonia australis, Halophila ovalis, Zostera mullerii, Halodule uninervis, Amphibolis antarctica, Cymodocea rotundata/Halodule uninervis, Posidonia oceanica, Australian seagrass meadows; average, East and Southeast Asia; average, world seagrasses; median) and Corgprojected for Z. marina at the different ocean margins and seas in the study area (Baltic Sea, Black Sea, Eastern and Western Atlantic, Eastern and Western Pacific, Kattegat-Skagerrak, and Mediterranean Sea). Number of sites per ocean margin/sea is given next to the bars. 1 = this study; 2 = Lavery et al. (2013); 3 = Miyajima et al. (2015); 4 = Fourqurean et al. (2012); 5 = Serrano et al. (2014); 6 = Duarte, Losada, et al. (2013; derived from Siikamäki et al., 2012; Pendleton et al., 2012); 7 = Kennedy and Björk (2009; derived from Duarte & Cebrián, 1996; Duarte & Chiscano, 1999; Janzen, 2004; Duarte et al., 2005).
sites (Fourqurean & Schrlau, 2003), but in the absence of information on the age and stability of the sediment studied and analysis of the full sedimentδ13C profile, we cannot make solid conclusions about the contribu-tions of the different carbon sources to the meadow in long term.
4.2. Consequences of Seagrass Loss for Global Blue Carbon Stocks
To date, vast areas of blue carbon ecosystems have been lost due to changes in land use and human-induced eutrophication. Mcleod et al. (2011) reported that 0.7–7% of the blue carbon ecosystems are lost annually. In the past 130 years, ~29% of the global seagrass area has been lost, and in many regions, these rates are accel-erating (Bertelli et al., 2017; Furman et al., 2015; Marba et al., 2015; Orth et al., 2006; Waycott et al., 2009). In contrast, salt marsh loss rates have remained relatively stable and loss rates for mangrove forests have slowed from 1.04%/year in the 1980s to 0.66%/year in 2000 (Waycott et al., 2009). The consequences of loss of blue carbon ecosystems to the oceanic carbonflux are still in need to be quantified, as there is likely to be substan-tial variation between different regions and habitats. Furthermore, the fate and magnitude of inorganic car-bon stocks stored in seagrass sediments have largely been overlooked by previous studies, although its contribution to sediment carbon pool in some regions have been shown to exceed that of organic carbon stocks by several factors (Mazarrasa et al., 2015). Using the annual loss rates for seagrass ecosystems, Pendleton et al. (2012) calculated a conservative estimate of 50- to 330 × 109-Mg CO2emissions from
sea-grass habitats annually, equivalent to approximately 33% of the total blue carbon emissions and economic damages. Furthermore, Macreadie et al. (2013) showed that disturbed P. australis meadows had up to 72% lower sediment Corg stocks compared to the sediments in adjacent undisturbed seagrass meadows.
Similarly, Marba et al. (2015) showed that in sites experiencing a permanent seagrass vegetation loss, also 90 years’ worth of carbon accumulation was lost through erosion of the sediments. The extensive loss of sedi-ment Corgstock in the disturbed seagrass meadows was most likely being caused by microbial priming, an
activation of previously dormant bacteria under the altered environmental conditions causing a release of ancient carbon stored in the sediments (e.g., Trevathan-Tackett et al., 2018).
Our results reveal that the magnitude of Z. marina Corgstocks is comparable not only to other seagrass
spe-cies but also to other blue carbon habitats such as salt marshes and mangrove forests. The circumpolar dis-tribution of Z. marina meadows suggests that the overall value of the total carbon stored in the world’s Z. marina ecosystems is high. Thisfinding is corroborated by the fact that the global areal extent of Z. marina could potentially be much more extensive than currently mapped (Gattuso et al., 2006). Z. marina meadows of the Northern Hemisphere have suffered from similar losses as seagrass meadows at other regions, for example, as a consequence of wasting disease caused by pathogenic strain of Labyrinthula (Short et al., 1987). The Danish Z. marina meadows in our suggested carbon hot spot, Kattegat-Skagerrak, were reduced by 80–90% in the beginning of 1930s (Rasmussen, 1977). Z. marina had recolonized many coastal areas by the 1970s, but new losses have occurred in the area since the 1980s, mainly due to eutrophication, and the Z. marina distribution in Denmark today is only around 20–25% of the historic distribution (Frederiksen et al., 2004). Similar losses have occurred along the Swedish Skagerrak coast, where over 60% of the Z. marina has vanished since the 1980s (equivalent to 125 km2) and the losses continue today (Baden et al., 2003). Despite improvements in the nutrient status and water quality in these regions, the restoration success of seagrasses has until now remained poor. Moksnes et al. (2018) has suggested that local regime shifts result in increased sediment resuspension and accumulation of drifting algae, and by these negative feedback mechanisms preventing the successful recovery and restoration of the meadows in the region. Similar trend has been observed in other parts of the world where a recent study by van Katwijk et al. (2015) shows a suc-cess rate of only 37% for seagrass restoration projects globally.
Although the loss rates are accelerating, neither seagrasses nor any of the other blue carbon ecosystems were until recently included in carbon trading programs such as REDD (Reduced emissions from deforestation and degradation) and REDD+ (Mcleod et al., 2011; Pendleton et al., 2012). However, some promising initiative to involve Blue Carbon ecosystems in the carbon trading programs have been made, such as the Andalusian Law of Climate Change and Verified Carbon Standard, which now include an option for Wetlands Restoration and Conservation. In addition, economic incentives such as PES (Payment for Ecosystem services) could serve asfinancial initiations for protection of coastal carbon (Hejnowicz et al., 2015; Locatelli et al., 2014; Murray et al., 2011). However, the cost of these losses in terms of carbon storage cannot be accurately assessed without knowing the Corgstock of the same areas in the absence of seagrass. Although seagrass
presence can increase the Corgin sediments (Dahl et al., 2016; Marba et al., 2015; Miyajima et al., 2015; Ricart
et al., 2015; Rozaimi et al., 2016; Samper-Villarreal et al., 2018), in some systems vegetated and unvegetated sediments have similar organic matter content (Richardson et al., 2008). The comparison can be difficult to accurately assess, however, because simply sampling bare patches outside of seagrass beds may not provide adequate reference sites due to environmental or sedimentary characteristics that differ from those in the beds, and the proximity of seagrasses may also alter other adjacent ecosystems. While we recognize this de fi-ciency and note that we cannot calculate exactly how much carbon the presence of seagrasses adds to the system, these data suggest that the proportion is likely to be substantial, although varying considerably among sites and regions.
Unfortunately, the current lack of acknowledgement and protection of seagrass meadows and the ecosys-tems services they provide, both in terms of carbon sequestration and other services, such as nursery habitat, nutrient accumulation, and sediment stabilization (e.g., Cole & Moksnes, 2016; Hejnowicz et al., 2015; Luisetti et al., 2013; Maxwell et al., 2016; Nordlund et al., 2016; Unsworth & Cullen-Unsworth, 2013), suggest that the global decline of seagrass meadows will most likely continue. The poor restoration success of seagrass meadows globally urges to protect the meadows, which still persist. We emphasize that there is an urgent need to reverse the current trend of losses of blue carbon ecosystems by conserving and involving blue carbon habitats as part of climate change mitigation programs and global carbon budgeting. Both in a global and regional contexts, there are still many unknowns in blue carbon research that must be defined. The most important gaps include determination of the total areal extent of global blue carbon storage zones, examina-tion of the fate of both inorganic and organic carbon exported from existing and disturbed blue carbon eco-systems, seascape connectivity between blue carbon ecoeco-systems, andfinally identification of the possible thresholds limiting ecosystem shifts (Maxwell et al., 2016; Van der Heide et al., 2011). By answering these questions, we could potentially create incentives to contribute to more relevant policy making and legislation and identify areas in which restoration and conservation could benefit both the management of atmospheric CO2 emissions and the protection of biodiversity and other ecosystem services that these valuable
ecosystems sustain.
References
Agawin, N. S. R., & Duarte, C. M. (2002). Evidence of direct particle trapping by a tropical seagrass meadow. Estuaries, 25(6), 1205–1209. https://doi.org/10.1007/BF02692217
Alberto, F., Mata, L., & Santos, R. (2001). Genetic homogeneity in the seagrass Cymodocea nodosa at its northern Atlantic limit revealed through RAPD. Marine Ecology Progress Series, 221, 299–301. https://doi.org/10.3354/meps221299
Alongi, D. M. (2014). Carbon cycling and storage in mangrove forests. Annual Review of Marine Science, 6(1), 195–219. https://doi.org/ 10.1146/annurev-marine-010213-135020
Arnaud- Haond, S., Duarte, C. M., Diaz-Almela, E., Marba, N., Sintes, T., & Serrão, E. A. (2012). Implications of extreme life span in clonal organisms: Millenary clones in meadows of the threatened seagrass Posidonia oceanica. PlosOne, 7(2), e30454. https://doi.org/10.1371/ journal.pone.0030454
Asplund, M. E., Rehnstam-Holm, A.-S., Atnur, V., Raghunath, P., Saravanan, V., Härnström, K., et al. (2011). Water column dynamics of Vibrio in relation to phytoplankton community composition and environmental conditions in a tropical coastal area. Environmental Microbiology, 13(10), 2738–2751. https://doi.org/10.1111/j.1462-2920.2011.02545.x
Baden, S., Gullström, M., Lundén, B., Pihl, L., & Rosenberg, R. (2003). Vanishing seagrass (Zostera marina, L.) in Swedish coastal waters. Ambio, 32(5), 374–377. https://doi.org/10.1579/0044-7447-32.5.374
Barron, C., Apostolaki, E. T., & Duarte, C. M. (2014). Dissolved organic carbonfluxes by seagrass meadows and macroalgal beds. Frontiers in Marine Science, 1(42). https://doi.org/10.3389/fmars.2014.00042
Barron, C., & Duarte, C. M. (2015). Dissolved organic carbon pools and export from the coastal ocean. Global Biogeochemical Cycles, 29, 1725–1738. https://doi.org/10.1002/2014GB005056
Beer, S., Björk, M., & Beardall, J. (2014). Photosynthesis in the marine environment, (1st ed.p. 224). United States: John Wiley.
Bertelli, C. M., Robinson, M. T., Mendzil, A. F., Pratt, L. R., & Unsworth, R. K. F. (2017). Finding some seagrass optimism in Wales, the case of Zostera noltii. Marine Pollution Bulletin, 134, 216–222. https://doi.org/10.1016/j.marpolbul.2017.08.018
Bos, A. R., Bouma, T. J., de Kort, G. L. J., & van Katwijk, M. M. (2007). Ecosystem engineering by annual intertidal seagrass beds: Sediment accretion and modification. Estuarine, Coastal and Shelf Science, 74(1–2), 344–348. https://doi.org/10.1016/j. ecss.2007.04.006
Boström, C., Baden, S., Bockelmann, A., Dromph, K., Frederiksen, S., & Gustafsson, C. (2014). Distribution, structure and function of Nordic eelgrass (Zostera marina) ecosystems: Implications for coastal management and conservation. Aquatic Conservation: Marine and Freshwater Ecosystems, 24(3), 410–434. https://doi.org/10.1002/aqc.2424
Bouillon, S., & Boschker, H. T. S. (2006). Bacterial carbon sources in coastal sediments: A cross-system analysis based on stable isotope data of biomarkers. Biogeosciences, 3(2), 175–185. https://doi.org/10.5194/bg-3-175-2006
Bouillon, S., & Connolly, R. (2009). Carbon exchange among tropical coastal ecosystems. In Nagelkerken: Ecological connectivity among tro-pical coastal ecosystems, (pp. 45–70). London: Springer Verlag.
Carrascal, L. M., Galva’n, I., & Gordo, O. (2009). Partial least squares regression as an alternative to current regression methods used in ecology. Oikos, 118, 681–690.
Acknowledgments
This work is part of the coordinated experimental network, Zostera Experimental Network (ZEN, www. zenscience.org) a collaborative network of scientists studying the structure and functioning eelgrass ecosystem, that provided an unique opportunity to explore globally the Corgstocks in eelgrass meadows with homogenic sampling methodology and protocol. This work is also part of a double degree program between Åbo Akademi University (ÅAU) and the University of Southern Denmark (SDU). The study was funded by the Maj and Tor Nessling Foundation (project 201600125: Baltic Sea blue carbon: environmental gradi-ents influencing the carbon sink capa-city of seagrass meadows), the Åbo Akademi University Foundation Sr, the University of Southern Denmark, and U. S. National Science Foundation grants OCE-1336206, OCE-1336741, and OCE-1336905. We acknowledge Archipelago Centre Korpoström and the University of Southern Denmark for excellent working facilities. We also acknowledge all thefield and laboratory assistants enabling gathering of this global data set. Data is provided at Zenodo repository under doi:10.5281/ zenodo.1412380.