Are Gasoline Demand Elasticities Different across Cities?
Texte intégral
Figure
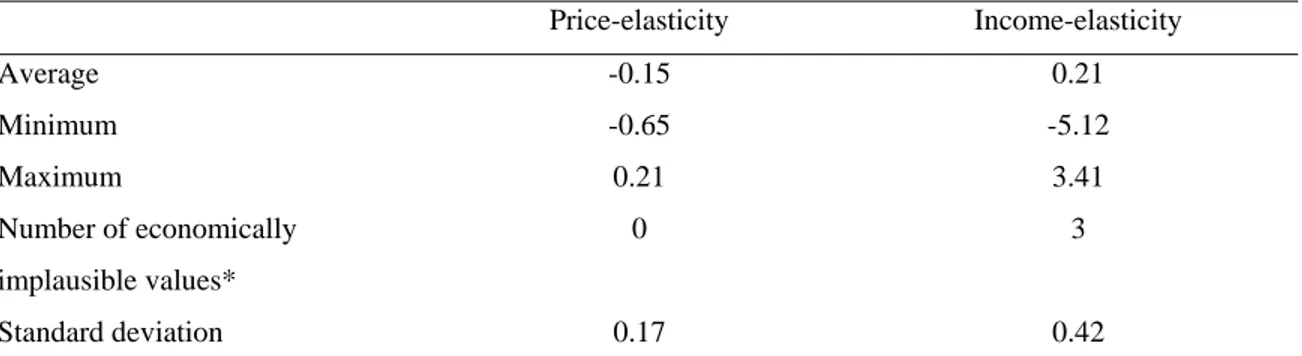
![Table 1. Descriptive statistics by market groups (mean and [min./max.])](https://thumb-eu.123doks.com/thumbv2/123doknet/7640141.236494/12.918.98.683.368.1046/table-descriptive-statistics-market-groups-mean-min-max.webp)

Documents relatifs
In this work we have obtained demand equations for housing characteristics grouped into three categories: quantity (floor area), quality (recorded through
As was stated above testing stationarity of price proportions is an inferentially effective way to test for cointegration between log prices and when these series are stationary
Our empirical analysis, based on the spot prices of WTI crude oil, gasoline, and Henry Hub natural gas, provides evidence of short-run asymmetry in the oil-gasoline price
The analysis of data gathered online from 40 digital platforms operating instant delivery services is summarized in this section (the related table is presented
s’engagent également dans une contribution à l'amélioration de dispositifs de formation à partir de la résolution - partielle - de problèmes récurrents d’accès au
% in the seventies. The European Cornmunity countrie, provide 75 % of imports and recieve 39 % of French t:xports, which is strong prima-facia evidence of the
In chapter 5, new MuFETs structures GCGSDG and JLGAA MOSFETs have been proposed to investigate their subthreshold behavior for nanoscale CMOS digital and ana- log applications.
Figure 13 shows the variation of HC concentration at spark plug according to spark advance on the set point 1000 rpm-IMEP 180 kPa- WOT end injection timing of 32 CAD BTDC.. We
