The Allocation of Resources to Cooperative and Noncooperative R&D
21
0
0
Texte intégral
(2) CIRANO Le CIRANO est un organisme sans but lucratif constitué en vertu de la Loi des compagnies du Québec. Le financement de son infrastructure et de ses activités de recherche provient des cotisations de ses organisations-membres, d’une subvention d’infrastructure du ministère de la Recherche, de la Science et de la Technologie, de même que des subventions et mandats obtenus par ses équipes de recherche. CIRANO is a private non-profit organization incorporated under the Québec Companies Act. Its infrastructure and research activities are funded through fees paid by member organizations, an infrastructure grant from the Ministère de la Recherche, de la Science et de la Technologie, and grants and research mandates obtained by its research teams. Les organisations-partenaires / The Partner Organizations PARTENAIRE MAJEUR . Ministère du développement économique et régional [MDER] PARTENAIRES . Alcan inc. . Axa Canada . Banque du Canada . Banque Laurentienne du Canada . Banque Nationale du Canada . Banque Royale du Canada . Bell Canada . BMO Groupe Financier . Bombardier . Bourse de Montréal . Caisse de dépôt et placement du Québec . Développement des ressources humaines Canada [DRHC] . Fédération des caisses Desjardins du Québec . GazMétro . Hydro-Québec . Industrie Canada . Ministère des Finances [MF] . Pratt & Whitney Canada Inc. . Raymond Chabot Grant Thornton . Ville de Montréal . École Polytechnique de Montréal . HEC Montréal . Université Concordia . Université de Montréal . Université du Québec à Montréal . Université Laval . Université McGill ASSOCIE A : . Institut de Finance Mathématique de Montréal (IFM2) . Laboratoires universitaires Bell Canada . Réseau de calcul et de modélisation mathématique [RCM2] . Réseau de centres d’excellence MITACS (Les mathématiques des technologies de l’information et des systèmes complexes) Les cahiers de la série scientifique (CS) visent à rendre accessibles des résultats de recherche effectuée au CIRANO afin de susciter échanges et commentaires. Ces cahiers sont écrits dans le style des publications scientifiques. Les idées et les opinions émises sont sous l’unique responsabilité des auteurs et ne représentent pas nécessairement les positions du CIRANO ou de ses partenaires. This paper presents research carried out at CIRANO and aims at encouraging discussion and comment. The observations and viewpoints expressed are the sole responsibility of the authors. They do not necessarily represent positions of CIRANO or its partners.. ISSN 1198-8177.
(3) The Allocation of Resources to Cooperative and Noncooperative R&D Gamal Atallah* Résumé / Abstract La littérature sur la R&D préconcurentielle a toujours considéré la coopération et la non-coopération comme des substituts. Dans ce papier, on adopte une approche plus réaliste, où la R&D coopérative et non-coopérative sont effectuées en parallèle. Dans la première étape, les firmes investissent dans les deux types de R&D. Dans la deuxième étape, elles se concurrencent en quantités. Il est démontré que le partage d’information entre les firmes contribue à la R&D non-coopérative, en plus de contribuer à la R&D coopérative. Chaque type de R&D renforce l’autre, impliquant une complémentarité entre les deux. L’investissement en R&D coopérative peut être supérieur ou inférieur à l’investissement en R&D non-coopérative. Dans un duopole de Cournot, la part de la R&D coopérative se situe entre 20% et 80% de la R&D totale, et cette part augmente avec les externalités de recherche et le partage d’information. Il est optimal de subventionner la moitié des coûts de la R&D coopérative, alors que la subvention à la R&D non-coopérative est inchangée par rapport au modèle standard. Les consommateurs préfèrent des niveaux intermédiaires d’externalités de recherche et de partage d’information, alors que les firmes préfèrent des niveaux plus élevés d’externalités, ce qui implique des niveaux très faibles de partage d’information. Mots clés : R&D, coopération en R&D, innovation, subventions à la recherche, politique de R&D, externalités de recherche, partage d’information.. The precompetitive R&D literature has viewed cooperative and noncooperative R&D as substitutes. In this paper a more realistic approach is taken, where both cooperative and noncooperative R&D are performed in parallel. In the first stage firms determine the optimal investments in both types of R&D, and in the second stage they compete in output. It is found that information sharing between cooperating firms contributes not only to cooperative R&D, but also to noncooperative R&D. The two types of R&D reinforce each other. The level of cooperative R&D may be higher or lower than noncooperative R&D. In a Cournot duopoly, the share of cooperative R&D lies between 20% and 80% of total R&D, and this share increases with spillovers and information sharing. It is always optimal to subsidize half the costs of cooperative R&D, while the subsidy to noncooperative R&D is unchanged form the standard model. Consumers prefer intermediate levels of spillovers and information sharing, while firms prefer higher levels of spillovers, which entail lower levels of information sharing. Keywords: R&D, cooperative R&D, innovation, R&D subsidies, R&D policy, spillovers, information sharing. Codes JEL : L13, O31. * University of Ottawa and CIRANO, University of Ottawa, P.O. Box 450, STN. A. Ottawa, Ontario, KlN 6N5, Canada. Email: gatallah@uottawa.ca..
(4) 1. Introduction The theoretical literature on precompetitive R&D has dealt extensively with the benefits and disadvantages of R&D cooperation versus R&D competition. Moreover, the use of alternative policy tools to R&D cooperation, such as R&D subsidies, has been evaluated. Seminal papers in this literature include Katz (1986), d’Aspremont and Jacquemin (1988), and Kamien et al. (1992). However, this treatment of R&D cooperation versus competition is at odds with how firms perform cooperative and competitive R&D on the one hand, and with how governments actually support R&D on the other hand. First, firms don’t typically choose between R&D cooperation and R&D competition. Rather, large firms are engaged in a large number of R&D projects, some cooperatively with other firms or institutions, some competitively on their own. There is a need to take this simultaneity of R&D cooperation and competition into account. Second, there is no need to consider R&D subsidies and R&D cooperation as alternative tools to alleviate market failures in innovation: both tools can be used simultaneously. On the one hand, noncooperative R&D can be subsidized even as the firm is engaged in other cooperative R&D projects. On the other hand, cooperative R&D itself may benefit from subsidization. The importance of doing R&D internally in order to be able to benefit from external R&D is well understood, and is underlined by the absorptive capacities approach (Cohen and Levinthal, 1989). However, a similar requirement exists for cooperative R&D: the firm must have a skilled (scientists, engineers) labour force that will participate in cooperative R&D projects in parallel to doing noncooperative R&D. Another motivation for the model is to explain differences between industries and between countries regarding the extent of R&D cooperation. Research alliances are more prevalent in some industries (biotechnology, pharmaceuticals) and in some countries (Japan, U.S.) than in others. The question remains of what determines the share of cooperative R&D in an industry or in an economy. To examine these issues, I set up a model of nontournament process R&D where firms engage simultaneously in noncooperative and cooperative R&D. In the first stage firms determine the optimal investments in both types of R&D. In the second stage they compete in output. It is found that information sharing between cooperating firms contributes not only to cooperative R&D, but also to noncooperative R&D. Moreover, the two types of R&D reinforce each other, in that the level of each type of R&D is higher than if firms had to choose between the two. It is shown that the level of cooperative R&D may be higher or lower than noncooperative R&D. More specifically, in.
(5) a Cournot duopoly, the share of cooperative R&D lies between 20% and 80% of total R&D, and this share increases with spillovers and information sharing. The models also evaluates the subsidization of cooperative and noncooperative R&D. It is shown that R&D subsidies are not a substitute for R&D cooperation. In particular, it is always optimal for the government to subsidize half the costs of cooperative R&D, while the optimal subsidy to noncooperative R&D is not affected by the presence of cooperative R&D. Finally, the values of spillovers allowing the attainment of different objectives are considered. It is shown that consumers prefer intermediate levels of spillovers and information sharing (these values maximize effective cost reduction), while firms prefer higher levels of spillovers; these high spillovers entail very low levels of information sharing. The social planner prefers values of spillovers and information sharing which are intermediate between those preferred by firms and consumers. The optimal values of spillovers and information sharing in the general model share some features with the standard models where only one type of R&D is performed: they share the level of spillovers with the noncooperative R&D model, while they share the property of maximal diffusion (that is, information sharing is set to its maximum, given spillovers) with the cooperative R&D model. Finally, the issue of underinvestment/overinvestment in R&D is considered. It is shown that cooperative R&D, or allowing firms to perform different types of R&D, is not necessarily a solution to reduce the gap between the observed and the socially optimal levels of R&D. This is because the socially optimal level of R&D itself “shifts” with the presence of cooperative R&D, mainly because of information sharing (and even without information sharing, cooperative R&D reduces the gap only with high spillovers). Insofar as this paper deals with the allocation of resources between different types of R&D, it is related to the literature on the choice between internal and external R&D. Internal R&D has the advantage of better control of information and better appropriability of research results (Arrow, 1962) and provides better career opportunities for scientists and engineers (Scherer, 1991). On the other hand, external R&D (either in the form of outsourcing or cooperation) allows the firm to benefit from a larger pool of expertise, to share R&D costs and risks, and to impose new technological standards upon the industry/market. Audretsch et al. (1996) argue that capital intensive firms are more likely to use external R&D, because of the difficulty other firms will have in copying their product, due to its standardization. On the other hand, firms with a high labour capital ratio will undertake more R&D internally, because human capital is firm specific. Their main empirical 2.
(6) finding is that capital intensity and the specificity of human capital play their expected roles only in low-tech industries. One result of their paper is that firms engage in both types of R&D, which corroborates our thesis that there is a need to model the interaction between noncooperative (internal) and cooperative (external) R&D. This complementarity is most striking in high-tech industries, where factors contributing to increasing internal R&D also increase external R&D. Hertog and Thurik (1993) study the determinants of internal and external R&D; they find that the share of external R&D in total R&D decreases with firm size, market concentration, and capital intensity. Nonetheless, a major distinction between the classification of R&D as internal/external and cooperative/noncooperative should be kept in mind: internal R&D directly contributes to the absorptive capacity of the firm, helping it absorb and assimilate external R&D. This may not always hold for noncooperative R&D, especially if noncooperative and cooperative R&D investments are made simultaneously, as it is assumed in the current paper. The paper is also related to the literature on R&D subsidization. Hinloopen (2001) and Petrakis and Poyago-Theotoky (2002) compare the subsidization of noncooperative R&D with allowing cooperative R&D, and find that R&D subsidies to noncooperative R&D are preferred to allowing R&D cooperation. However, this comparison is based on the view that a choice must be made between the two policies. The current paper shows that there is no substitution (but also no complementarity) between noncooperative R&D subsidization and R&D cooperation: the two policies are independent. Moreover, the paper considers the subsidization of cooperative R&D, which is briefly considered by Hinloopen (2001). This model sheds light on issues which have been somewhat hidden by the artificial separation in the literature between cooperative and noncooperative R&D. The effects of spillovers, information sharing, R&D subsidization and R&D cooperation can be fully understood only when the two types of R&D are modeled simultaneously. The next section presents the model. Comparative statics are taken up in section 3. The results are analyzed from the point of view of the impact of information sharing, R&D levels and shares, R&D subsidization, and the optimal levels of spillovers and information sharing. Section 4 concludes.. 3.
(7) 2. The model There are two identical firms producing a homogeneous good using a constant returns to scale technology and competing in Cournot. Firms face the inverse linear demand p=A-y1-y2, where yi is firm i’s output. Firms can invest simultaneously in two types of R&D. The first type is noncooperative R&D (NRD), where each firm chooses a level of R&D expenditure to maximize its own profits, taking the R&D expenditures of the other firm as given. The second type is cooperative R&D (CRD), where each firm chooses a level of R&D expenditure to maximize the joint profits of both firms, and may decide to share information with the other firm. R&D is characterized by imperfect appropriability. There is a spillover $0[0,1] through which knowledge leaks on all types of R&D. In addition, firms may engage in voluntary information sharing "0[0,1-$] on CRD. Hence R&D cooperation here takes the form of R&D coordination augmented with the possibility of information sharing. Both spillovers and information sharing are exogenous to the model.1 The game has two stages. In the first stage firms invest in cooperative and noncooperative R&D, simultaneously. In the second stage they produce output and compete in Cournot. While it would probably be more realistic to assume that firms invest first in their own (noncooperative) R&D, and next engage in research alliances, this sequential decision making would greatly complicate the model analytically, with little gain in fundamental insights. Letting xci denote the CRD output of firm i, and xni denote NRD, the marginal cost of firm i is. R is the initial marginal cost before cost reduction. The firm benefits fully from its own cooperative and noncooperative R&D, benefits through spillovers from the NRD of the other firm, and through spillovers and information sharing from the CRD of the other firm. The cost of obtaining an R&D output of x is (x2; this cost applies for both types of R&D. Let y/(y1,y2) and x/(xn1,xc1,xn2,xc2). The profit of firm i is given by. 1. On the endogenization of information sharing see Atallah (2003).. 4.
(8) In the second stage each firm chooses its output to maximize its profits:. This yields a solution for output as a function of R&D, y(x) given by. In the first stage firms choose R&D expenditures to solve the following problems:. This yields the following levels of R&D expenditures:. The second order conditions imply that $2-4$+4-9(<0 and 5("2+$2)-8("+$)+10"$+5-9(<0. The strictly positive levels of both types of R&D vindicate the model: irrespective of the levels of spillovers and information sharing, firms want to invest in both cooperative and noncooperative R&D. The question is not, then, whether to cooperate or not, but rather how much to invest in each type of R&D.. 3. Analysis The comparative statics of cooperative and noncooperative R&D are now well understood, therefore this paper focuses solely on new results arising from the interaction between the two. This section analyses the effect of information sharing on NRD, the interaction between cooperative and. 5.
(9) noncooperative R&D, the share of CRD in total R&D, the impact of R&D subsidies, and the effects of spillovers and information sharing on effective cost reduction, profits and welfare.. 3.1 Information sharing Consider first how information sharing, which is due to R&D cooperation, can have an effect on NRD. Proposition 1. Noncooperative R&D increases with information sharing: Mxn/M">0. Proof. . Information sharing is known to increase CRD. However, its effect on noncooperative has not been explored. Proposition 1 shows that NRD responds positively to an increase in information sharing. Even though the direct effect of information sharing is to increase CRD, this reduces firms’ cost, making cost reduction more valuable and hence increases NRD investments. However, it should be mentioned that the impact of information sharing on NRD is positive but very small: information sharing increases CRD much more than it increases NRD. The other comparative statics of spillovers and information sharing on R&D are well known and therefore omitted: Mxn/M$<0, Mxc/M$>0, and Mxc/M">0.. 3.2 R&D levels and shares It is useful to compare the levels of R&D obtained when both types of R&D coexist with those obtained when firms choose between cooperation and noncooperation. Denote the model used in the literature, where only one type of R&D is allowed, as the “standard” model. Let xnsi and xcsi denote noncooperative and cooperative R&D, respectively, in that standard model.. Proposition 2. Cooperative and noncooperative R&D reinforce each other: the investment in each is higher than if firms had to choose between R&D cooperation and R&D competition: xn>xns and xc>xcs. 6.
(10) Proof. It is straightforward to show that when only NRD is allowed, R&D investment is given by. The numerators of xni and xnsi are the same, and the denominator of xni is smaller, implying that xn>xns. A similar argument is used to compare xc and xcs, where xcs is given by . We see the complementarity between the two types of R&D. Each type of R&D, by lowering the firms’ cost, make the other type of R&D more attractive, increasing its level. This result is consistent with empirical evidence suggesting that there exist complementarities between different innovative activities (Arora and Gambardella, 1990; Cockburn and Henderson, 1998). The standard model underestimates the investment in both cooperative and noncooperative R&D. However, this does not mean that performing simultaneously CRD and NRD solves the underinvestment problem.2 Because the optimal level of R&D itself is higher when the two types of R&D coexist, it remains true that firms generally underinvest compared to the social optimum. This suggests that CRD should not be viewed as a solution to underinvestment in innovation, because the firm must continue to invest in NRD, where underinvestment is particularly strong. In practice the largest portion of R&D investments made by a firm goes to own NRD projects, with CRD constituting only a small portion of the firm’s R&D portfolio. The following proposition analyses the allocation of resources to each type of R&D.. Proposition 3. In a Cournot duopoly where each firm has one cooperative and one noncooperative R&D project, the share of cooperative R&D expenditures S0[0.2,0.8] (this means that xn <> xc). Moreover, this share increases with spillovers and information sharing: MS/M$>0 and MS/M">0.. 2. The issue of underinvestment and overinvestment in R&D will be discussed in more detail in section 3.4.. 7.
(11) Proof. The share of CRD is given by. It is straightforward to verify that S increases with " and $. It reaches its minimum (0.2) when "=$=0 and its maximum (0.8) when "=0 and $=1. . We see that firms’ investments in CRD may be higher or lower than investments in NRD, depending on spillovers and information sharing. For any level of spillovers and information sharing, investment in each type of R&D represents at least 20% of total R&D. This result shows the importance of modeling jointly cooperative and noncooperative R&D. The share of CRD increases with spillovers because spillovers increase CRD while they decrease NRD. Moreover, this share increases with information sharing because the direct effect of information sharing on CRD is more important than its indirect effect on NRD. While the share of CRD expenditures lies in the interval [0.2,0.8], it is easy to verify that the share of CRD output lies in the interval [1/3,2/3]. In practice, the scope for CRD may be limited to certain types of technology, or by the difficulty of finding suitable partners. Also, insofar as CRD projects are “marginal” projects which constitute additions to a large existing R&D stock, it is normal to find that empirically CRD represents a smaller fraction of total R&D. The model points out that the sources of this asymmetry are not to be found in spillovers, information sharing or R&D coordination.. 3.3 R&D subsidization The next issue we tackle is R&D subsidization. R&D subsidies and R&D cooperation are often viewed as substitutable policy tools. The general wisdom is that governments may either give firms subsidies to correct for underinvestment, or allow R&D cooperation to induce the internalization of externalities and encourage information sharing. However, the model developed here suggests a different relationship between the two policy tools. This relationship is not one of complementarity, in that R&D subsidies and R&D cooperation both increase the marginal value of innovation, and hence one should reinforce the other. Rather, the model suggests that R&D subsidies 8.
(12) and R&D cooperation are independent, in two ways. First, the optimal subsidy to NRD is independent of the level of CRD (and whether it is performed at all). Second, it is optimal to subsidize CRD, and this subsidy is independent of the level of NRD, spillovers, and information sharing. Hence, while R&D cooperation and R&D subsidies can be analyzed separately, the government need not choose between the two policies, rather both should be pursued in parallel. Moreover, not only NRD, but also CRD, may need to be subsidized. Given that there is potential underinvestment in both types of R&D, subsidization of both would bring their levels closer to the first best. Let t0[0,1] and tc0[0,1] be the levels of the noncooperative and cooperative subsidies, respectively. These represent the shares of R&D outlays that are reimbursed to firms by the government. The profits of firm i are now. The profit-maximizing level of output is unchanged from above. Maximizing profits w.r.t. both types of R&D given that level of output yields the following levels of R&D:. Note that both types of R&D increase with both types of subsidies. A subsidy to NRD increases NRD, which increases the value of cost reduction and increases CRD. Similarly, a subsidy to CRD increases CRD, which increases the value of cost reduction and increases NRD. Define total welfare W as the sum of consumer surplus CS and firms’ profits, minus the cost of the subsidy. The problem of the government is. As usual in this type of model, the welfare expression is quite complex, and finding the general solution for the optimal subsidies proved difficult. However, the maximization problem can be easily (and analytically) solved when the model is parametrized. Therefore, before taking the first-order conditions w.r.t. t and tc, numerical values have been assigned to the parameters A, R, ", (, and $. 9.
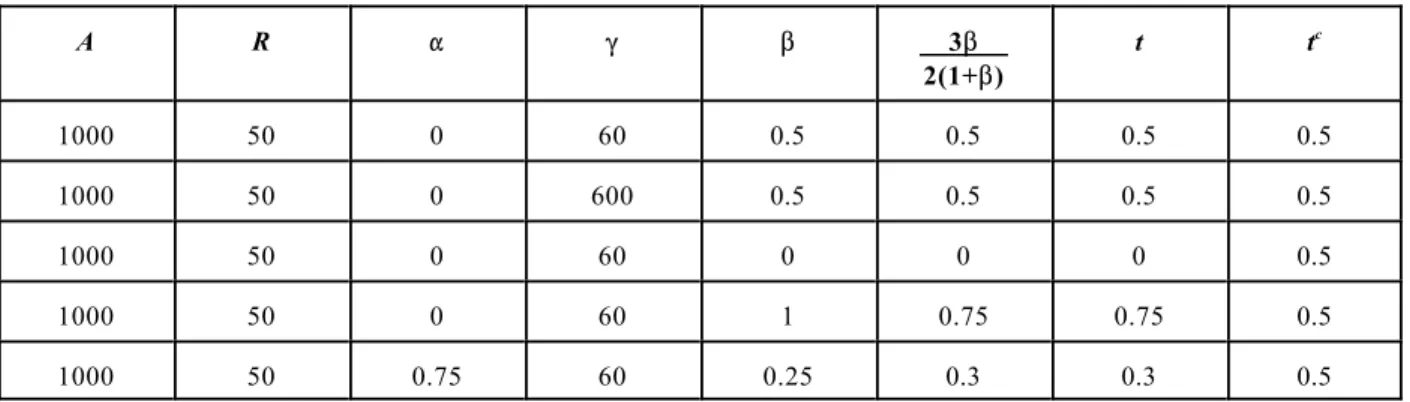
(13) Table 1 illustrates the results for some some parameter values. It is clear that the results do not depend at all on the first four parameters, and depend (for t only) directly and in an obvious fashion on $. Hence there is no loss of generality from this parametrization of the model. Table 1 - Optimal cooperative and noncooperative R&D subsidies A. R. ". (. $. 3$ 2(1+$). t. tc. 1000. 50. 0. 60. 0.5. 0.5. 0.5. 0.5. 1000. 50. 0. 600. 0.5. 0.5. 0.5. 0.5. 1000. 50. 0. 60. 0. 0. 0. 0.5. 1000. 50. 0. 60. 1. 0.75. 0.75. 0.5. 1000. 50. 0.75. 60. 0.25. 0.3. 0.3. 0.5. Consider first the subsidy to cooperative R&D. It is optimal to subsidize 50% of the costs of cooperative research, independently of NRD, " or $. As for the subsidization of NRD, the table shows that the optimal subsidy is t=3$/2(1+$). First, note that t increases with $: as spillovers increase, firms reduce their investments in R&D, and to correct for this underinvestment, the government finds it optimal to increase the subsidy. Second, this value of the subsidy corresponds to the optimal subsidy found in the literature in the standard model (see Petrakis and PoyagoTheotoky, 2002). Therefore, the presence of cooperative R&D does not change the optimal subsidy to NRD. It would also be straightforward to show that the optimal subsidy to CRD (50%) is independent of the presence of NRD. The following proposition formalizes this result.. Proposition 4. The optimal R&D subsidy to noncooperative R&D is t=3$/2(1+$)). The optimal subsidy to cooperative R&D is tc=0.5.. The relationship between cooperative and noncooperative R&D has been studied from the point of view of R&D subsidies. Hinloopen (2001) studies two alternative policy tools: R&D subsidies (to either cooperative or noncooperative R&D) and R&D cooperation , and finds that it is preferred to provide R&D subsidies than to allow R&D cooperation. Petrakis and PoyagoTheotoky (2002) introduce pollution into the standard R&D model, and also find that, for a wide. 10.
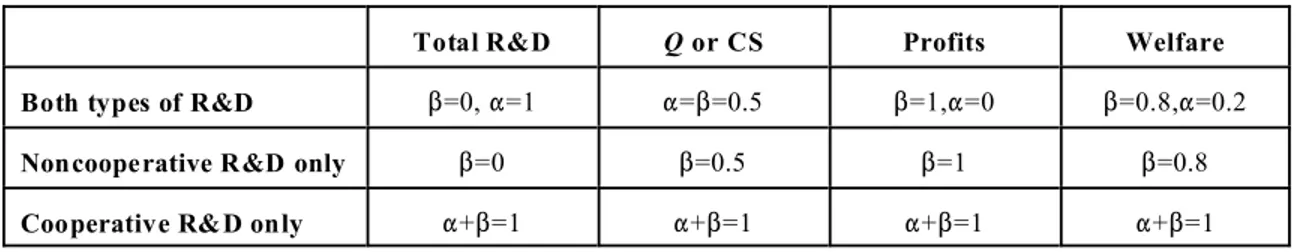
(14) class of cases, R&D subsidies are preferred to R&D cooperation. The current paper goes beyond the dichotomy of the choice between R&D cooperation and R&D subsidization: one policy is not a substitute for the other. It may be optimal to have both R&D subsidies and R&D cooperation. Actually, implicit in the cooperative R&D literature is that the government should encourage firms to cooperate when such cooperation is beneficial. One way of encouraging R&D cooperation is to subsidize cooperative R&D, as suggested in this paper. Again, this goes against the substitutability argument between R&D subsidization and R&D cooperation.. 3.4 The “optimal” levels of spillovers and information sharing The last question we consider is how a policymaker pursuing different objectives would try to affect the levels of spillovers and information sharing, through intellectual property rights and patent policy, for instance. This issue is relatively straightforward in the standard model, because there is only one type of R&D. However, with both types of R&D present, there are countervailing effects. First, spillovers have opposite effects on cooperative and noncooperative R&D. Second, there is an inevitable substitutability between spillovers and information sharing, because an increase in spillovers reduces the maximal level of information sharing. We consider different objectives: effective cost reduction, consumer surplus, profits, and total welfare. In addition, as a benchmark, we consider the total level of R&D, although we recognize that this is probably not an appropriate policy objective in itself, insofar as policy makers are concerned with the impact of R&D on different agents in the economy, and not with R&D per se. We first discuss the optimal levels of $ and " based on the model incorporating both types of R&D. Then we compare the results with those obtained in the standard model where only one type of R&D is performed. Table 2 illustrates the results. Table 2 - Values of spillovers and information sharing maximizing different objectives. Both types of R&D Noncooperative R&D only Cooperative R&D only. Total R&D. Q or CS. Profits. Welfare. $=0, "=1. "=$=0.5. $=1,"=0. $=0.8,"=0.2. $=0. $=0.5. $=1. $=0.8. "+$=1. "+$=1. "+$=1. "+$=1. 11.
(15) Total R&D is maximized when $=0 and "=1, so that all diffusion is due to information sharing. Total R&D increases only marginally with $ (because of the decline in NRD), while it increases steeply with " (because both types of R&D increase with "). Hence X is maximized when there are no spillovers. As for cost reduction (or consumer surplus, since the two move in tandem), it is maximized when $="=0.5. Therefore half the information flows through spillovers, and the other half through information sharing. Notice that this is not the maximal diffusion rate (which would be $=1 and "=0 here), because " affects only CRD. Higher spillovers, and less information sharing, are required to maximize effective cost reduction than to maximize R&D. This is because $ transmits information concerning both types of R&D, while " transmits information concerning CRD only. Hence the cost of maximal diffusion is less NRD (because of the higher $ and the lower ") and less CRD (because of the lower "), albeit CRD is affected positively by the higher value of $. In terms of magnitudes, numerical simulations suggest that total R&D is particularly sensitive to information sharing, while diffusion is sensitive to both spillovers and information sharing. Regarding profits, firms prefer perfect spillovers and no information sharing. This is due to the fact that spillovers contribute to the diffusion of both types of R&D, while information sharing contributes to the diffusion of CRD only. Hence firms benefit more from an equilibrium with lower total R&D but higher diffusion. Higher spillovers reduce NRD (but contribute to CRD), while the absence of information sharing reduces CRD considerably (but has a marginal negative effect on NRD). Firms benefit from this combination because it implies that they invest less in R&D and benefit more from each other’s R&D. It is easy to verify that profits are increasing in spillovers when evaluated at the equilibrium levels of R&D. In fact, comparing the two extreme cases ("=0,$=1) and ("=1,$=0), we observe that in the case with perfect spillovers and no information sharing, CRD is the same, effective cost reduction is the same, and NRD is lower than in the case with no spillovers and perfect information sharing. Hence, firms prefer the configuration ("=0,$=1) because it allows them to achieve the same level of total cost reduction with less R&D outlays. The gains from higher diffusion of NRD and CRD through the higher $ more than compensate the losses arising from the reduced level of NRD (because of the higher $). Paradoxically, a social planner who is pro-business would offer firms less protection for their innovations (this may hurt any one of them taken individually, but would benefit them collectively), 12.
(16) but would allow them to share technology freely. Moreover, firms prefer not to share information, not because information sharing is not beneficial, but because they benefit more from higher spillovers (which contribute to the diffusion of both types of R&D) than from information sharing (which boosts significantly only CRD). The incentives for information sharing are different here compared with the model with CRD only, where firms are indifferent between spillovers and information sharing as long as "+$=1.3 Here, firms prefer no information sharing, because they care more about maximal spillovers, which softens competition on R&D by reducing innovation. Finally, maximizing total welfare requires levels of spillovers and information sharing that are intermediate between those preferred by consumers and those preferred by firms: $=0.8 and "=0.2. This is to be expected, given that welfare is a weighted average of consumers’ and producers’ surplus. The following proposition derives the values of spillovers and information sharing maximizing total R&D and effective cost reduction.. Proposition 5. a) Total R&D is maximized when $=0 and "=1, and total effective cost reduction and consumer surplus are maximized when $="=0.5. b) Let A=1000, R=50, and (=60. Then, profits are maximized when $=1 and "=0, while total welfare is maximized when $=0.8 and "=0.2. Proof. Total R&D is given by. X increases with " and $. Therefore total R&D is maximized for some $ when " takes its maximum value, "=1-$. Substituting this value of " into total R&D and differentiating w.r.t. $ yields. which is negative, therefore total R&D is maximized when $=0 and "=1.. 3. See the third row of table 2 and the discussion that follows proposition 5.. 13.
(17) Total effective cost reduction is given by. Again, this expression increases with " and $. Using the same argument as above, we set "=1-$ and maximize w.r.t. $:. which yields $=0.5 and hence "=0.5. For consumer surplus, profits, and welfare, some parameters need to be assigned numerical values to be able to sign the derivatives analytically. Let A=1000, R=50, and (=60. Then CS is given by. This expression increases with " and $. Setting "=1-$ and maximizing w.r.t. $, we find $=0.5, and hence "=0.5. Similarly, using the same numerical parametrization, total profits are given by. This expression increases with " and $. Setting "=1-$, the expression is maximized for $=1, and hence "=0. Using the same argument, it is easily seen that total welfare is maximized when $=0.8 and "=0.2.. The levels of spillovers and information sharing maximizing total R&D and effective cost reduction obtained here differ from the standard model where firms have to choose between R&D cooperation and competition. When only NRD is performed, it is easy to show that total R&D is maximized when $=0, effective cost reduction is maximized when $=0.5, profits are maximized 14.
(18) when $=1, while welfare is maximized with $=0.8. On the other hand, when only CRD is allowed, setting "+$=1 maximizes all of the objectives considered here. The second and third rows of table 2 summarize these results. We see that the optimal values in the general model share some features with the standard models. They share with NRD the value of $, and with CRD the property that "+$=1. This means that adding CRD to an industry does not change the optimal value of spillovers (independently of the objective pursued). Moreover, with CRD only we are indifferent whether diffusion is due to $ or ". But in the general model, even though it is still true that "+$=1, we are no longer indifferent between spillovers and information sharing. The “optimal” R&D policy then depends on the type of R&D market under consideration (the relative importance of CRD) and on whether the focus of the policy is on innovation or diffusion. Assuming policymakers care most about total diffusion of the technology (effective cost reduction), the policy prescriptions would be as follows. In a market where NRD is predominant, an intermediate level of protection, which would balance the -negative- effect on R&D investments with the benefits from diffusion, would be prescribed. In a market where most R&D takes the cooperative form (although this is quite rare), policies affecting spillovers have no effect on effective cost reduction, insofar as firms cancel the effect of appropriability with information sharing. Finally, in the more realistic markets where both cooperative and noncooperative R&D exist in nonnegligible proportions, an intermediate level of protection would be preferred. A legitimate question is whether the presence of different types of R&D changes the results pertaining to underinvestment or overinvestment in R&D. The answer turns out to be negative. First note that in the current setting there is never overinvestment in R&D. Even when spillovers are low, firms never exceed (but may equal) the socially optimal level. There would be overinvestment if there were more than 2 firms in the market and spillovers were sufficiently low. Therefore, we only inquire as to how the underinvestment is affected by the presence of different types of R&D. The following table shows the ratio of actual R&D investment in the model to the socially optimal levels (which maximize total welfare, defined as above). The results are provided for two extreme cases: $=0 and $=1. Moreover, it is assumed that firms will set information sharing as high as possible ("=1-$), since this always increases their profits. Finally, to simplify the presentation, the results are calculated for the numerical parametrization A=1000, R=50, (=60. 15.
(19) Table 3 - Ratios of privately optimal to socially optimal R&D NRD. CRD. Total R&D. $=0. 100%. 49.6%. 66.2%. $=1. 24.5%. 49.0%. 36.8%. For NRD, R&D coincides with the socially optimal level when there are no spillovers, and the gap increases as spillovers increase, with the ratio reaching a low of 24.5% when spillovers are perfect. For CRD, the ratio is 49.6% when there are no spillovers, and declines slightly to 49.0% with perfect spillovers (in fact, CRD first increases with spillovers because of the increased benefits of diffusion; however, as spillovers increase further, CRD declines slightly, due to the decline in NRD, which reduces the value of cost reduction; but the ratio is always declining). Hence the ratio is more or less constant.4 Finally, the ratio of total R&D to the socially optimal level is at a high of 66.2% with no spillovers, and declines uniformly to 36.8% with perfect spillovers. These ratios are almost identical to those obtained in the standard model with only one type of R&D. Therefore, allowing firms to perform different types of R&D does not by itself solve the underinvestment problem. Moreover, note that there is underinvestment not only in NRD, but also in CRD. The relevant benchmark to which CRD should be compared is the socially optimal level of CRD, given the socially optimal level of NRD and given the fact that CRD involves information sharing. The socially optimal level of R&D itself “shifts” with the presence of cooperative R&D, because of information sharing. Hence, CRD is not necessarily a solution to the underinvestment problem (although it may increase R&D, especially with information sharing and/or high spillovers), because the socially optimal level of R&D itself increases when CRD is considered. Policy makers need to increase the level of each level of R&D (when there is no overinvestment, which is the case here) to reduce the gap between observed and optimal R&D.. 4. A similar ratio would be obtained for CRD in the absence of information sharing. The only difference is that with information sharing, the privately and socially optimal levels of CRD are constant, while in the absence of information sharing, they increase with spillovers. But in both cases the ratio is essentially invariant to spillovers.. 16.
(20) 4. Conclusions Modeling R&D as a choice between CRD and NRD neglects the synergies and complementarities between the two types of R&D. These interactions arise at several levels. In this paper we have explored the effect of information sharing on noncooperative R&D, the complementarity between CRD and NRD, the share of CRD in total investments, the subsidization of cooperative R&D, and the levels of spillovers and information sharing maximizing different objectives. The general conclusion from the model is that when devising cooperative R&D policy, we should take into account its impact on noncoopertative R&D. In particular, R&D subsidization and R&D cooperation are not substitutes. Moreover, the subsidization of cooperative R&D itself should be considered. The model has many possible extensions focusing on the interaction between the two types of R&D. The firm may have a fixed R&D budget which it allocates between the different research projects. This would make the competition between CRD and NRD much more stringent. Another issue is whether there are asymmetries between firms which induce some firms to invest more in one type of R&D vs. the other. This could help explain differences in the propensity to cooperate between firms, industries and countries. The distinction between different types of R&D is also crucial for the study of R&D determinants. Hertog and Thurik (1993) find that failing to distinguish between internal and external R&D gives misleading results regarding the effects of firm size, market concentration and capital intensity on R&D. In a similar fashion, it would be useful to disentangle the effects of R&D determinants on cooperative vs. noncooperative R&D, and not only on total R&D.. 5. References Arora , A., and Gambardella, A., 1990, ‘Complementarity and external linkages: the strategies of the large firms in biotechnology’, Journal of Industrial Economics, 38:361-79. Arrow, K. J., 1962, “Economic Welfare and the Allocation of Resources for Invention”, in Nelson, R. R., (ed.), The Rate and Direction of Inventive Activity, Princeton University Press, Princeton, NJ. Atallah, G., 2003, “Information Sharing and the Stability of Cooperation in Research Joint Ventures”, Economics of Innovation and New Technology, 12(6):531-54.. 17.
(21) Audretsch, D. B., Menkveld, A. J., and Thurik, A. R., 1996, “The Decision Between Internal and External R&D”, Journal of Institutional and Theoretical Economics, 152:519-29. Cockburn, I., and Henderson, R., 1998, ‘Absorptive capacity, coauthoring behavior and the organization of research in drug discovery’, Journal of Industrial Economics, 46:157-82. Cohen, W. M., and Levinthal, D. A., 1989, “Innovation and Learning: The Two Faces of R&D”, The Economic Journal, 99(397):569-96. d’Aspremont, C., and Jacquemin, A., 1988, “Cooperative and Noncooperative R&D in Duopoly with Spillovers”, American Economic Review, 78:1133-37. Hertog, R. G. J., and Thurik, A. R., 1993, “Determinants of Internal and External R&D: some Dutch Evidence”, De Economist, 141(2):279-89. Hinloopen, J., 2001, “Subsidizing R&D Cooperatives”, De Economist, 149(3):313-45. Kamien, M.I., Muller, E., and Zang, I., 1992, “Research Joint Ventures and R&D Cartels”, American Economic Review, 82(5):1293-1306. Katz, M.L., 1986, “An analysis of cooperative research and development”, RAND Journal of Econom ics, 17(4):527-43.. Petrakis, E., and Poyago-Theotoky, J., 2002, “R&D Subsidies versus R&D Cooperation in a Duopoly with Spillovers and Pollution”, Australian Economic Papers, March, 37-52. Scherer, F. M., 1991, “Changing Perspectives on the Firm Size Problem”, in Acs, Z., J. and Audretsch, D. B. (eds.), Innovation and Technological Change: An International Comparison, University of Michigan Press, Ann Arbor.. 18.
(22)
Figure

Documents relatifs
REQUESTS the Director-General, in his determination of allocation of resources as between regions, to continue to bear in mind the principles already outlined by the Executive
First, there is a direct effect as a higher labour share tends to reduce profits for a given level of output; second, a higher labour share is associated with higher output per
The value of the assets and liabilities of the purchased Company have been reflected at their book values, as they are reported in Cascades S.A.S.’s financial statements
The Canadian Task Force on Preventive Health Care recommends screening adults 60 to 74 years of age for colorectal cancer (strong recommendation), but given the severe
G Measuring Age-related Frailty in the General Population:a Comparison of the ESPS and SHARE Surveys
As expected, the comparative analysis reveals significant differences between the two surveys (ESPS and SHARE) regarding the frailty scores obtained using different questions,
This algorithm is important for injectivity problems and identifiability analysis of parametric models as illustrated in the following. To our knowledge, it does not exist any
The ratio of the sample to reference is used to measure absorbance and account for other variations.. This approach will account for variations in detector and source response
Feng, Strong solutions to a nonlinear parabolic system modeling compressible misci- ble displacement in porous media, Nonlinear Anal., Theory Methods Appl., 23 (1994), 1515–1531.
