Omega-3 PUFA metabolism and brain modifications during aging
2Laurie Chevalier*, Hillary Chappus-McCendie*, Claude Roberge and Mélanie Plourde
1,# 31
Research Center on Aging, Health and Social Services Centre – University Institute of Geriatrics of
4
Sherbrooke, Department of medicine, Université de Sherbrooke, 1036 Belvédère Sud, Sherbrooke,
5
Canada, J1H 4C4; E-Mails: [email protected] (M.P);
6
*LC and HCM equally contributed to the redaction and the revision of the manuscript and are considered
7
co-first authors.
8
#Author to whom correspondence should be addressed;
9
E-Mail: [email protected]
10
Phone number: +1-819-780-2220 extension 45664;
11
Fax: +1-819-829-7141.
12 13
Abstract:
14
In Canada, 5.5 million (16% of Canadians) adults are >65 years old and projections suggest this
15
number will be approximately 20% of Canadians by 2024. A major concern regarding old age is a
16
decline in health, especially if this entails a loss of self-sufficiency and independence caused by a
17
decline in cognition. The brain contains 60% of fat and is one of the most concentrated organs in long
18
chain omega-3 fatty acids such as docosahexaenoic acid (DHA). During aging, there are physiological
19
modifications in the metabolism of lipids that could also have consequences on brain structure and
20
levels of DHA. This review will hence discuss the physiological modifications in the metabolism of
21
lipids during aging with a focus on long chain omega-3 and omega-6 fatty acids and also outline the
22
structural and functional modifications of the brain during aging including brain lipid modifications
23
and its relation to higher levels of DHA and cognition. Therefore, in this review, we outline the
24
importance of collecting more data on the biology of aging since it might highly improve our
25
understanding about what are «normal» modifications occurring during aging and what can become
26
pathological.
27 28 29 30Keywords: lipid metabolism, aging, docosahexaenoic acid, fatty acids, brain structure, brain function,
31 32
1. Introduction
33
Almost every country in the world experiences an aging population, and this population is expected to be
34
one of the most significant forces shaping our economy and society in the next 20-30 years. A major concern
35
about old age, both at the individual and societal levels, is a decline in health, especially if this means a loss
36
of self-sufficiency and independence. Increasing research aimed at promoting healthy aging is actually
37
ongoing but one of the major hurdles is to define the biology of aging. Aging in humans refers to a
38
multidimensional process of physical, psychological, and social changes. Therefore, it follows that
39
fundamental knowledge on the biological processes occurring during aging may help to design
40
environmental strategies aimed at promoting healthy biological aging. Thus, there is a need for better
41
prevention strategies, but one major gap in this field is a need to better understand what the biological
42
modifications are, also called geroscience, since this field is relatively new. One of the strategies to promote
43
healthy aging is the consumption of one or two fish meals each week
1-3. Normally, the intake of fish
44
positively correlates with increased plasma and erythrocyte omega-3 fatty acids (n-3 FA), likely with
45
eicosapentaenoic acid (EPA) and docosahexaenoic acid (DHA) concentrations in a time- and
dose-46
dependent manner
4-6. EPA and DHA have to be provided through the diet because their synthesis from their
47
precursor alpha-linolenic acid (ALA) is extremely limited in humans
7. However, over the 20
thcentury, the
48
dietary fat consumption has drastically changed with an increased level of omega-6 fatty acids such as
49
linoleic acid (LA) from 2.79% to 7.21% of energy. This shift in our dietary fat intake was largely due to our
50
dependence on new food production methodologies, including soybean oil
8.
51
The link between our dietary fat intake and the incidence of chronic diseases has been largely debated over
52
the last 20 years. Our research group is mainly focused on prevention of cognitive decline, so the focus of
53
this review paper, with respect to chronic diseases, will be on cognition. This link between dietary fat intake
54
and the risk of cognitive decline has been the focus of many review papers overs the last 10-15 years
9-11.
55
One of the most recent reviews supports a positive association between dietary and blood n-6: n-3 ratio and
56
cognitive decline and incidence of dementia, as evaluated on 14 human studies including 7 prospective
57
studies
12. A recent meta-analysis on 11 cohort studies evaluated the association between 299 metabolites
58
and general cognitive ability and dementia. They reported that higher DHA levels in blood were associated
59
with higher cognitive function in 22,887 individuals
13. Hence, it seems that more elevated concentration of
60
n-3 FA in the blood is associated with lower cognitive decline and perhaps lower risk of other chronic
61
diseases. However, our group showed that for older participants, plasma EPA and DHA kinetics are
62
dysregulated and this will likely lower the capacity of older adults to incorporate EPA and DHA in organs
and tissues. Usually, a fish oil supplementation increases the level of EPA and DHA in the plasma or
64
erythrocytes but in those aged >70 years old, we don’t know whether this process is efficient. There is no
65
clear definition or parameters to define an old vs. a young participant. Most of the studies used the median
66
of age in their participants group or a continuous age ae range. Following from the information summarized
67
above, this paper will review some of the metabolism modifications occurring during aging with a focus on
68
lipid metabolism. By reviewing these evidences, we will also expose how these modifications might limit
69
incorporations of n-3 FA in membranes of cells with a focus on the brain because it is one of the most
70
enriched organs in DHA.
71
2. Lipid and fatty acid metabolism differences during aging
72
Generally speaking, there are differences in the lipid and fatty acid metabolism occurring during aging
73
and these modifications are considered totally normal and part of the aging process. These processes
74
include the transport of fatty acids after their intake and their transit to the different organs and tissues
75
that are modified during aging. This section will review some of these modifications.
76
2.1.Normal transport of fatty acids from dietary intake to their circulation in the blood:
77
In Western adults, the diet is composed of 30 to 40% of lipids, of which 92 to 96% are long chain
78
fatty acid esterified to a glycerol thus constituting what is the main form of dietary lipid: triglycerides
79
(TG)
14. Whole-body homeostasis requires fine-tuning of fatty acid transport and utilization by
80
metabolically active tissues
15. Because of their regulatory roles in cellular fatty acid uptake and
81
utilization, membrane apolipoprotein receptors and fatty acid transporters form an integral part of this
82
homeostatic system. As a result, imbalances in lipid metabolism likely will influence the functioning
83
of fatty acid transporters and their protein levels. Lipids are not soluble in water and necessitate
84
incorporation into amphiphilic molecules called lipoproteins to circulate in the blood. Hence,
85
following ingestion of TG, they will be hydrolysed at their ester bonds by gastric and pancreatic
86
lipases into two non-esterified fatty acids (NEFA) and one monoacylglycerol (MAG) with the fatty
87
acid being in the Sn-2 position
16. Both forms of lipids are passively transported into enterocytes
17via
88
diffusion or transporters such as "Fatty Acid Transport Proteins" (FATPs) and "Cluster of
89
Differentiation 36" (CD36)
18. Dietary lipids are efficiently digested and absorbed by the enterocytes
90
19
.
91
Once inside the intestinal cells, enzymes convert the NEFAs and MAG back into TG
20. These
92
will be integrated in chylomicrons and exported to the lymphatic system via the Golgi apparatus
21.
The chylomicrons, now rich in exogenous triglycerides, join the bloodstream via the thoracic duct and
94
get transported to the peripheral tissues such as muscle and fat cells. In the bloodstream, lipoprotein
95
lipase (LPL) gets activated when it detects an apolipoprotein C II (apoC-II)
22on the surface of the
96
chylomicrons. The role of lipoprotein lipase is to hydrolyse the ester bonds of TGs in chylomicrons
2297
to release NEFAs into the bloodstream where there will be an uptake by nearby cells. The loss of TGs
98
will result in a decrease in size of chylomicrons and leave chylomicrons constituents available for the
99
synthesis of native HDL disks
23. Remnant chylomicrons rich in cholesteryl esters will be captured by
100
endocytosis by hepatocytes receptors such as LDL receptor (LDLR)
22and LDL receptor-related
101
protein
(LRP)
(
https://onlinelibrary-wiley-102com.ezproxy.usherbrooke.ca/doi/abs/10.1002/%28SICI%291096-103
9136%28199708%2914%3A3%2B%3CS75%3A%3AAID-DIA449%3E3.0.CO%3B2-9
). The liver can then use
104the endogenous TG and cholesteryl esters to form the very low density lipoprotein (VLDL)
24. These
105
lipoproteins will be directed to peripheral tissues. Following a loss of TG, there will be a decrease in
106
VLDL density
25. With the action of lipoprotein lipase, VLDL will then become intermediate density
107
lipoprotein (IDL). With the action of hepatic lipase
25IDL becomes low density lipoprotein (LDL).
108
LDLs carry cholesterol to tissues
26. LDL will be captured by their receptor, LDLR which are found
109
on cell membranes, where it will be eliminated from the bloodstream by endocytosis
26. LDL
110
cholesterol will be recovered in the cell. An excess of cholesterol in the tissues will cause an inhibition
111
of transcription of the genes responsible for the formation of the LDLR
27. It thus reduces the uptake
112
of LDL by the cells and these LDLs will remain in circulation. The remaining LDLs in the circulation
113
are more likely to be oxidized
28which will thereafter contribute to the development of atherosclerotic
114
plaque
28.
115
2.2 Lipoprotein metabolism modification during aging
116
During aging, the metabolism of lipids is modified and causes an increase of plasma lipids. For instance,
117
the fasting plasma levels of VLDL, TG, LDL and cholesterol
29are significantly higher in the elderly
30.
118
Higher levels of lipid and cholesterol can be the source of many health problems such as cardiovascular
119
disease and diabetes (REF =
http://diabetes.diabetesjournals.org/content/46/8/1354.full-text.pdf + 120https://www.ncbi.nlm.nih.gov/pmc/articles/PMC4587882/)
.
121These plasma lipid changes in the elderly can cause an increase in plasma free fatty acid levels
(https://eds-122
b113-b378e62a44c1%40sessionmgr103). Increasing plasma FFA may result in increased plasma glucose
124
by decreasing glucose uptake into the cells. The enzymes responsible for the oxidative cascade of GLA are
125
intimately related to that of glycolysis. Thus, increased lipid oxidation inhibits glucose metabolism,
126
decreases
glucose
uptake
in
cells,
and
impairs
glycogen
storage
127
http://diabetes.diabetesjournals.org/content/diabetes/37/6/667.full.pdf.. This promotes hyperinsulinemia
128
and
ultimate
insulin
resistance
https://eds-b-ebscohost-129
com.ezproxy.usherbrooke.ca/eds/pdfviewer/pdfviewer?vid=1&sid=3f462f39-8acd-4cbf-b113-130
b378e62a44c1%40sessionmgr103.
131
Insulin resistance, often seen in the elderly (https://www.jci.org/articles/view/110908/pdf), will also cause
132
an increase in VLDL and blood triglycerides. Insulin resistance impairs the metabolism of chylomicrons,
133
VLDL, LDL and HDL
31since a lack of insulin or a lower sensitivity to insulin will reduce the catabolism
134
of chylomicrons and VLDL by LPL. During aging, there is also a higher level of LDL which remains
135
transient for a longer period of time in the plasma (Einarsson K, Nilsell K, Leijd B, Angelin B. Influence of
136
age on secretion of cholesterol and synthesis of bile acids by the liver. N Engl J Med 1985;313(5):277-82.
137
doi: 10.1056/NEJM198508013130501.) as a reference of this statement. = REF 30). In the long term, these
138
LDLs are more likely to be oxidized
31. The higher concentration of VLDL and chylomicrons in addition to
139
oxidized LDL accumulation in older insulin-resistant individuals would increase the risk of developing
140
cardiovascular disease (CVD)
32. Furthermore, the increase of LDL may be due to the diminution of bile
141
synthesis from cholesterol by the liver during aging
30, 33. The decrease in bile acid synthesis is due to the
142
decrease in the expression of "cholesterol 7-alpha hydroxylase" (CYP7A1) during aging. This cytochrome
143
is one of the CYP450 and regulates the formation of bile acids
34. This causes a decrease in the use of
144
cholesterol by the liver as well as a reduction in LDLR expression with age. Thus, plasma LDL will have
145
lower clearance with age resulting in an increase in plasma LDL concentration in the elderly
29. In the end,
146
it is possible that deregulation of LDL in the elderly is due to several different phenomena stemming from
147
the large amount of change that occurs with age. The decrease in LDL in the elderly has shown a reduction
148
in the incidence of CVD
35. In particular, a study showed that long chain polyunsaturated fatty acids
149
(PUFAs) allowed an increase in LDLR expression
36, which could increase the clearance rate of plasma
150
LDL in the elderly and reduce the incidence of CVD. These are some of the modification of the lipid
151
metabolism occurring during aging. Overall, there are usually higher TG and LDL levels in the blood of
152
older adults and it is important to consider these modifications in the prevention of chronic diseases but also
153
when interpreting results pertaining to fatty acid metabolism.
155 156
2.3 Omega-3 fatty acid metabolism during aging
157
Over the last 10 years, our group has worked on omega-3 metabolism with a focus on modifications
158
that occur during aging. This section will report the evidence of omega-3 fatty acid metabolism in
159
three different conditions: before supplementation with omega-3, during or after supplementation with
160
omega-3 fatty acid, and kinetics studies using uniformly labeled carbon 13 fatty acids (
13C-).
161
2.3.1 Without an omega-3 fatty acid supplementation
162
To our knowledge, there are ~ 24 studies that have reported the level of omega-3 fatty acids or the
163
omega-3 index in young versus old adults (Table 1). Most of the studies reported the fatty acid profile
164
in red blood cells or in plasma/serum phospholipids (PL). Among the 24 studies, 7 studies reported
165
the omega-3 index only and showed that it was higher in older participants
37-43. Two studies on the
166
omega-3 index reported an increase of about 5-7% of the omega-3 index every decade
37, 41. Eleven
167
studies reported the fatty acid profile in red blood cells (RBC)
37, 38, 41-50. For most of the studies, it is
168
difficult to compare the results since the data were not expressed the same way. For instance, two
169
studies reported that the participants having the highest level of omega-3 were on average 8-10 years
170
older than those with the lowest omega-3 fatty acid levels in erythrocytes
43, 44. Other studies reported
171
the level of increase in omega-3 fatty acids for each increasing decade. Hence, it is difficult to draw a
172
clear conclusion for the omega-3 fatty acid results in RBC but it appears that at older ages, there is
173
more omega-3 in RBC. It is important to note that these papers did not include a complete fatty acid
174
profile of the RBC as it was recently recommended in a paper describing the best practices for the
175
design, laboratory analysis and reporting of clinical trials involving fatty acids
51, hence limiting
176
comparisons between studies. With respect to plasma/serum PL, there were eight studies
45, 52-58. Six
177
of these studies reported on average a 1.5 fold higher level of DHA in the plasma PL of older
178
participants, aged between 50-88 years old compared with younger participants, aged between 20-49
179
years old
45, 53-57. One study reported a 2 fold higher level of EPA in plasma PL but there were no
180
difference between ages for DHA
52. Yet another study reported only a positive correlation between
181
age and EPA+DHA in plasma PL but it was not possible to quantify the magnitude of the difference
182
between young and older adults
58. Overall, there is generally good evidence supporting the idea that
183
during aging, the relative % of omega-3 fatty acids or its concentration in RBC and plasma/serum are
higher in the oldest participants compared to the youngest. Some of the proposed mechanism includes
185
a reduction of omega-3 fatty acids in cell membranes, higher intestinal absorption during aging, higher
186
availability and release of adipose tissue stocks. Hence, the exact mechanism behind this higher level
187
of blood omega-3 in older individuals might be multi-level but the important point here is that they
188
might be associated to longevity.
189
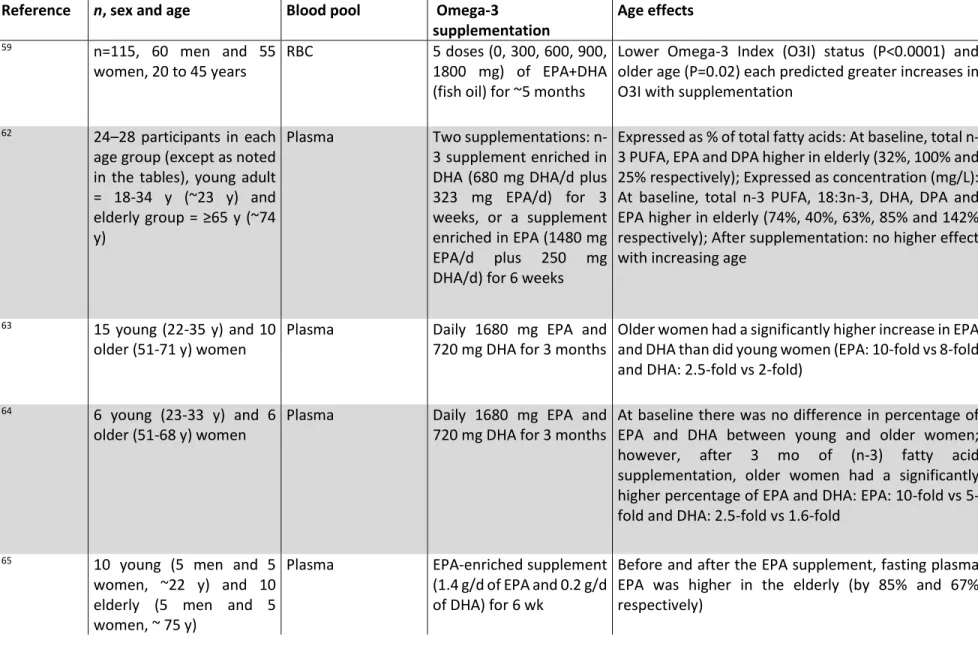
2.3.2 With an omega-3 fatty acid supplementation
190
To our knowledge, there are nine published studies specifically addressing EPA and DHA responses to an
191
omega-3 fatty acid supplement with participants of different ages (Table 2). Supplementation doses range
192
from 300 mg/d to more than 4 g/d and lasted between 6 weeks and twelve months. Seven studies evaluated
193
the fatty acid profile in the plasma whereas one study evaluated the fatty acid profile in erythrocytes only
59194
and another did so in platelets and adipose tissues only
60. One study reported the omega-3 index pre- and
195
post-supplementation
59and showed that a low omega-3 index at baseline and an older age predicted those
196
with a greater increase of the omega-3 index after supplementation
59. This study had similar results to
197
Vandal et al.,
61which showed that the oldest had a higher increase in DHA compared to the youngest after
198
the supplementation, but in their study, Vandal had similar DHA levels in young and old participants at
199
baseline.
200
The other studies investigated the plasma level of omega-3 fatty acids. One study reported that older
201
participants had higher omega-3 levels at baseline but after the supplementation, the increase was similar in
202
both groups
62. The six other studies reported a higher increase in EPA
63-67and/or DHA
68in older
203
participants compared to younger. The exact mechanism explaining this effect is unclear. Most of the studies
204
reported that it is unlikely that the age-related differences in EPA and DHA at baseline are due to differences
205
in intake of omega-3 PUFA with age. Rather it seems to be related to age differences in endogenous
206
production and incorporation of EPA and DHA due to hormones and hormone sensitivity, body
207
composition, and physical activity, all of which change with age
67. The study of Walker et al. also showed
208
that the adipose tissue stores less DHA with age in response to EPA + DHA supplementation, hence
209
suggesting that age-related differences in the handling and storage of exogenous supplied DHA may be
210
related to impaired insulin sensitivity with aging or to differences in body composition with aging
67. The
211
adipose tissue represents a significant store of EPA and DHA, containing the equivalent of several hundred
212
days of the fatty acid content of a typical diet. Altogether, these results support that providing a supplement
213
of omega-3 fatty acid to older adults increases their blood levels when compared to younger individuals.
214
These results may be caused by the fact that older individuals have shown to be more compliant to treatments
than younger people (REF =
https://onlinelibrary.wiley.com/doi/full/10.1046/j.1365-2710.2000.00315.x),
216causing a higher level of omega-3 in their blood. But despite that fact, those results brings into question
217
whether this type of supplementation is useful to them in the prevention of chronic diseases since they may
218
not be able to use it. Another important point is that it might also be due to their lower turnover of circulating
219
TG, hence contributing to their higher omega-3 levels, since omega-3 fatty acid levels are esterified in TG.
220
To answer some of these questions, employing
13C-fatty acids is useful.
221
2.3.3 Using
13C-fatty acid to evaluate their kinetics during aging
222Tracing metabolism of
13C-fatty acids may provide some insight into possible age-related changes in
223
fatty acid metabolism in humans. Metabolism of
13C-DHA has been investigated in humans
69-71. In
224
young adults given an oral dose of 250-280 mg
13C-DHA,
13C enrichment peaked at 2 h post-dose in
225
plasma triglycerides when the tracer was given in the triglyceride form, but at 6 h post-dose when the
226
tracer was esterified to phosphatidylcholine
69, 71. Brossard et al. have reported a 1.4% apparent
retro-227
conversion of
13C-DHA to
13C-docosapentaenoate (22:5 omega-3) and
13C-EPA 3 d after giving the
228
tracer
70. These first results showed the feasibility of tracing DHA metabolism in humans. However,
229
neither the impact of aging on
13C-DHA metabolism nor its -oxidation were investigated, although
230
both may influence the somewhat higher blood levels of EPA and DHA commonly seen in healthy
231
elderly
54, 65, 66, 68, 72. Our group are pioneers in this field as we investigated the kinetics of
13C-DHA
232
in six young and six elderly participants
73. We found that, in the elderly,
13C-DHA was 4 times higher
233
in plasma triglycerides and NEFA at 4 h post-dose, -oxidation was 1.9 times higher, whereas
234
apparent retro-conversion of
13C-DHA to other
13C-omega-3 fatty acids was 2.1 times higher 24 h and
235
7 d after tracer intake compared to the young adults
73. Hence, because DHA seems to remain
236
transiently for longer periods of time in the blood of the elderly compared to the young, it may thus
237
indicate that efficiency to remove DHA from the blood is lower in the elderly than in the young,
238
resulting in lower incorporation of DHA in the membrane of cells that serve to initiate signalization
239
65, 66, 68, 72
. This result is consistent with the transient slower metabolism of TG and LDL in older as
240
compared to young adults and this was described in a previous section.
241
Our most recent work with tracers between old and young men was conducted with
13C-EPA or
242
arachidonic acid (
13C-ARA), two key fatty acids that are precursors of anti- and pro-inflammatory
243
cytokines, respectively. Surprisingly, the kinetics of
13C-EPA and
13C-ARA was quite similar between
244
young and old men despite a time x age interaction for
13C-EPA kinetics where the postprandial shape
of the curve was steeper in old vs young men
74. One intriguing result we obtained was that in old
246
men, synthesis of DHA from EPA started 2 h after tracer intake whereas it was delayed to 1 d in young
247
men. This result suggests that old adults might need more DHA than what was actually provided in
248
their diet compared to the young men. However, newly synthesized DHA accumulated in the plasma
249
of old men for 7 d and this might be because it remains for a longer period in the plasma as suggested
250
by our previous study with
13C-DHA. Therefore, there might be a defect in old adults to uptake DHA
251
in the tissues. We also calculated that plasma half-life of
13C-EPA was 2 d whereas that of
13C-ARA
252
was 4 d, similar to that of DHA. DHA and ARA are the two most concentrated long chain
253
polyunsaturated fatty acids in brain membranes. With our -oxidation measures using breath samples,
254
we calculated
13C-EPA whole-body half-life to be ~14 days in old men whereas in the younger group
255
it was ~21 days
74. This result indicates that older adults turn over EPA ~7 days faster than the younger
256
adults. This is an intriguing result since epidemiological studies and results we obtained in previous
257
studies
62, 65support that old adults have twice as much plasma EPA, hence one would anticipate a
258
lower whole-body turnover in old vs young adults. Therefore, it seems that there is somehow a
259
disconnect between plasma levels of EPA and perhaps DHA and their kinetics, thus more studies are
260
needed to understand the mechanism of these modifications and their possible consequences such as
261
potential higher risk of cognitive decline.
262
3 Brain modifications during aging:
263
The brain is composed of 60% fat with one third of its content being ARA and DHA. The brain is
264
hence the second most rich tissue in fat after adipose tissue. The brain fatty acids are however mostly
265
PLs unlike the adipose tissue that is mainly composed of TGs. Because DHA is an important
266
constituent of brain structure, there has been much interest in the association between the level of
267
DHA in brain membranes, brain function and brain volume and losses during aging. Therefore, this
268
section will summarize the evidence about morphological, functional, and content modifications of
269
the brain during aging and whether dietary omega-3 intake can improve brain structure and function.
270
3.1. Morphological modifications of the brain during aging 271
There are a number of morphological modifications of the brain that occur during aging. Several
272
studies have indicated that brain volume decreases over the course of the human lifespan. A review
273
conducted by Hedman et al.
75compiled the results of 56 longitudinal magnetic resonance imaging (MRI)
274
studies on whole brain volumes in healthy individuals and concluded that the rate of total brain volume loss
is not constant throughout aging. For instance, the rate of brain volume loss after 35 years of age is
276
approximately 0.2% per year. Between 35 and 60 years of age, the volume loss rate slowly increases to
277
0.5% followed by a steady volume loss of over 0.5% per year over 60 years of age
75. Furthermore, other
278
studies have indicated that volume loss in the whole brain is greater in males than in females
76, 77.
279
Several studies demonstrate a reduction of gray matter volume during aging
78-84. More specifically,
280
the volume of gray matter in the cortex and the cerebellum of older individuals is 18% and 13% smaller,
281
respectively, than those of their younger counterparts
81. There is also a significant loss of gray matter in the
282
frontal, limbic, temporal, and parietal lobes but not in the occipital lobe
78, 83. Similarly, studies have also
283
indicated that there is a decrease of white matter volume in the brains of older individuals
81, 85-87. According
284
to Jäncke et al.
81, there is a decrease in white matter volume in the cortex and cerebellum of older individuals
285
by 5% and ~9%, respectively, compared to younger adults. Moreover, one study indicated that the rate of
286
decrease of white matter is not constant during aging
87. Instead, white matter volume slowly increases
287
before the age of 40, peaks at approximately 50 years of age, and then quickly decreases after the age of 60
288
87
. As well, white matter hyperintensity lesions increase in size with age in the frontal, temporal, and parietal
289
lobes but not in the occipital lobes
86.
290
In addition to age-related changes in the volume of the whole brain, gray matter, and white matter, there are
291
also differences in the volume of specific brain structures. There seems to be a general decrease in the
292
volume of the following brain structures in older individuals compared to younger individuals: cerebral
293
hemisphere
76, frontal lobe
88, 89, parietal lobe
77, 88, 89, temporal lobe
88, 89, thalamus
81, 90, basal ganglia
89,
294
and the cerebellum
89. Notably, there is atrophy of the hippocampus during aging
77, 81, 91-93. A meta-analysis
295
by Fraser et al.
93detailed hippocampal atrophy rates according to 28 studies. They determined that the
296
overall rate of atrophy for the entire sample was 0.85% per year
93. However, the rate of hippocampal
297
atrophy reported in the studies differed based on mean age of the participants: rate of atrophy was 0.38%
298
per year in studies with a mean age of 55, 0.98% per year for a mean age of 55 to 70 years, and 1.12% per
299
year for a mean age of greater than 70 years. In contrast to the aforementioned structures, the ventricles of
300
the brain increase in volume during aging
76, 91. Altogether, there is generally good evidence supporting loss
301
of matter in many brain structures, including loss in white and gray matter. These losses of brain matter can
302
contribute to lower cognitive functions during aging.
303
3.2 Modification of brain functions during aging
In addition to the many structural changes that occur during aging, brain functions are also modified during
305
this period. For instance, there is an age-related decrease in glucose metabolism in the whole brain and the
306
frontal, parietal, and temporal lobes as well as in Broca’s and Wernicke’s areas
77. It also seems that brain
307
activation during the execution of motor functions is modified in older adults. For example, there is a
308
decrease in blood-oxygen level dependent (BOLD) signals in multiple brain regions (sensorimotor cortex,
309
cerebellum and thalamus) of older adults during mastication and an increase in BOLD signal in the
310
prefrontal area
94. Another study showed that classical motor coordination regions were activated during
311
complex inter-limb coordination tasks, but that there was also increased activation of higher-level
312
sensorimotor and frontal regions in older individuals
95. Similarly, other studies have demonstrated that the
313
performance of motor tasks result in increased activation of additional brain areas such as the basal ganglia,
314
prefrontal cortex, precuneus, and the cerebellum
96-98in older invividuals.
315
Moreover, cognitive functions are modified as a result of changes in the volume of various brain structures.
316
For instance, a meta-analysis of 57 publications from the years 1984 to 1998 concluded that white matter
317
hyperintensities are linked with poorer performance on cognitive tests for processing speed, immediate and
318
delayed memory, executive functions, and global cognitive functioning
99. Further, a decrease in the
319
thalamus volume in older individuals is associated with attenuated performance on tests assessing cognitive
320
speed
90. An additional meta-analysis of 33 studies concluded that larger prefrontal cortex volume and
321
thickness is correlated with better executive functioning
100. In regard to hippocampus volume and memory,
322
Van Petten
101reported in a meta-analysis of 33 studies that the positive correlation between hippocampus
323
size and episodic memory in older adults was weaker than expected. However, a more recent study
324
demonstrated that smaller hippocampus size is significantly associated with lower performance in episodic
325
memory, working memory, processing speed, and executive function tasks
102. Similarly to motor function,
326
it has been shown that older adults recruit additional brain regions during memory tasks
103-105.
327
Aging is also associated with changes in the activity of brain structures involved in sensation and perception.
328
For instance, there are less areas activated in older versus younger adults in response to various odors
106. A
329
meta-analysis of 105 studies concluded that the activation of the fusiform gyrus, cerebellum, and
330
hippocampus is elevated in elderly versus younger individuals during the processing of emotional faces
107.
331
Moreover, older individuals had greater activation of the prefrontal cortex during more difficult perceptual
332
tasks compared to younger individuals
108. The brains of older adults are also less responsive to blue light
333
stimulation compared to younger adults
109.
More recent studies have shed light on the changes that occur in the functional neural networks of the brain.
335
It seems that aging is associated with weaker connectivity in long-range connections and stronger
336
connectivity of short-range connections
110, 111. Elderly individuals also have less intra-network and greater
337
inter-network connectivity
112, 113. More specifically, older individuals have less connectivity within the
338
default mode network (DMN) and somatomotor network
113, as well as greater connectivity between the
339
salience network and the executive control network (ECN) and the DMN
112. Moreover, age seems to shift
340
dynamic functional connectivity from posterior to anterior regions, which is also reflected in the decreased
341
activation of posterior regions during the decline of episodic memory in older individuals
114.
342
Overall, there are several morphological and functional modifications within the brain during aging and
343
understanding how these modifications manifest could be helpful to limit the rate at which these declines
344
occur.
345
3.3 Modifications of brain content during aging
346
The number of studies, particularly those that use neuroimaging techniques, that have evaluated the change
347
in human brain content during aging is limited. Post-mortem examinations of the human brain have
348
indicated that there is a change in protein and lipid content during aging. With regard to protein, one study
349
indicated that there is a 5-15% decrease in total protein content of the brain between 30 and 90 years of age
350
115
. A decrease in protein content in the substantia nigra, hippocampus, caudate nucleus, and gray matter
351
has also been reported
116, 117. However, Söderberg et al.
116found that protein content remained unchanged
352
in the cerebellum, pons, and medulla oblongata of older individuals. Similarly, a number of post-mortem
353
studies have demonstrated changes in the lipid content of older brains. For instance, Svenerholm et al.
118354
reported that there is a linear decrease in cholesterol and phospholipids in the frontal and temporal cortices
355
and a curvilinear decrease in cholesterol, PLs, cerebrosides, and sulfatides in frontal and temporal white
356
matter between the ages of 20 and 100. In terms of PLs, Söderberg et al.
116found that they were relatively
357
unchanged during aging with only a 5-10% decrease in the oldest age group. A more recent study conducted
358
by Hancock et al.
119reported that PL content in the entorhinal cortex of older individuals is relatively stable
359
during aging, but there is an increase in mitochondrial phosphatidylcholine (PC) and a decrease in
360
mitochondrial phosphatidylethanolamine (PE). The same group reported that age is associated with an
361
increase in mitochondrial PE containing DHA, but said the increase is not large enough to increase total
362
DHA in the mitochondria. Norris et al.
120examined phospholipid composition in the dorsolateral prefrontal
363
cortex in individuals aged 20-100 years. They found that there is a general age-related increase in
364
phospholipids containing DHA and decrease in PLs containing ARA and docosatetraenoic acid
120.
A recent study used positron emission tomography to assess the incorporation of DHA from plasma to the
366
brain using carbon-11 ([1-C
11])-DHA in apolipoprotein E epsilon 4 allele (APOE4) carriers versus
non-367
carriers
121. APOE4 is the most important genetic risk of late-onset Alzheimer’s disease
122. Yassine et al.
368
found that the mean global gray matter DHA incorporation coefficient was 16% higher in APOE4 carriers
369
vs non-carriers
121. A higher DHA incorporation coefficient was also observed in other regions including
370
the entorhinal cortex
121. However, the whole-brain DHA incorporation rate was not significantly different
371
between APOE groups
121. They also did not observe any age-related effects on DHA incorporation, but this
372
may be due to the fact that only 4 of their 23 participants were over 50 years old
121. The authors
373
hypothesized that increased DHA incorporation in the brains of APOE4 carriers could be a compensatory
374
mechanism to counteract brain DHA loss
121. Our group also documented that the metabolism of DHA is
375
imbalanced in APOE4 carriers
123-126and that they are perhaps more vulnerable to DHA deficiency
127.
376
3.4 Does omega-3 fatty acid consumption improve brain structure and function?
377
There are a number of studies that have examined the relationship between omega-3 fatty acid consumption
378
and brain structure and function. For instance, Gu et al.
128evaluated the link between white matter integrity
379
and dietary nutrient intake in 239 elderly participants. They assessed white matter integrity using fractional
380
anisotropy measured by diffusion tensor imaging (DTI). They found that the nutrient pattern characterized
381
by high consumption of omega-3 and omega-6 fatty acids and vitamin E was positively correlated with
382
fractional anisotropy which corresponds to better white matter integrity
128. Another group examined the
383
relationship between dietary fish consumption and brain structural integrity in 260 cognitively normal adults
384
aged 65 years or older
129. Fish intake was measured using the National Cancer Institute Food Frequency
385
Questionnaire and the gray matter volume of various brain regions was measured with MRI
129. They found
386
that eating baked or broiled fish weekly is positively associated with higher gray matter volume in several
387
brain regions, including the hippocampus, posterior cingulate, precuneus, and the orbital frontal cortex
129.
388
Samieri and colleagues
130evaluated the association between plasma EPA and DHA concentrations and
389
gray matter atrophy in the medial temporal lobe in 281 individuals aged 65 years or older. The authors
390
compared fatty acid plasma concentrations at baseline to the results of MRI examinations from baseline and
391
four years after baseline
130. They observed that greater levels of plasma EPA was associated with lower
392
atrophy of the gray matter of the right amygdala and the hippocampal/parahippocampal region; this same
393
association was not observed for plasma DHA levels
130, which is counterintuitive. Samieri et al.
130also
394
found that increased amygdala gray matter atrophy was linked with more depressive symptoms and poorer
395
semantic memory performances compared to baseline. Lastly, Witte et al.
131assessed the connection
between fish oil supplement consumption and brain structure and function in 65 participants aged 50 to 75
397
years. Participants consumed either fish oil, which contained 2.2 grams of omega-3 fatty acids, or a placebo
398
daily for 26 weeks. Neuropsychological testing and MRI examinations were performed before and after the
399
intervention period. The investigators found that after the 26-week intervention period, the fish oil group
400
had better white matter structural integrity in selective white matter tracts in the frontal, temporal, parietal,
401
and limbic areas
131. They also observed that the fish oil group had significant increases in gray matter
402
volume in the left hippocampus, precuneus, the superior temporal, inferior parietal and postcentral gyri, and
403
in the right middle temporal gyrus
131. In terms of performance on cognitive measures, they found that the
404
fish oil group had an improvement of 26% on executive function scores compared to no improvement in the
405
placebo group
131. In addition, they found a positive correlation between verbal fluency scores and EPA
406
percentage in red blood cell membranes in the fish oil group after intervention
131. Although for many years
407
it was thought that an intake of fish throughout life protects against cognitive decline, the recent evidence
408
suggests that fish intake might not be required throughout life to improve brain structure and function.
409
Hence, starting an EPA+DHA supplementation after 50 years old might benefit older individuals with
410
respect to prevention of brain volume and function losses.
411
4
Are we ready for updated recommendations on dietary omega-3 fatty acids intake during aging?
412
In this review paper, we have outlined that there are many physiological modifications occurring during
413
aging with respect to lipid metabolism and brain volume and function losses and that an omega-3 fatty
414
acid intake might help to support the brain throughout aging. It is important to note that life expectancy
415
is longer, which means that older adults may live longer with their chronic diseases. A major concern
416
regarding old age is a decline in health, especially if this entails a loss of self-sufficiency and
417
independence caused by a decline in cognition. A decline in working memory appears to be one of the
418
major consequences of normal aging
132, 133. As outlined in the previous sections, the brain undergoes
419
physiological change during aging. While age is one risk of cognitive decline, this multifactorial disease
420
is also increased by a complex interaction between both genetic and environmental risk factors
134-136.
421
We believe nutrition has a role to play in the prevention of cognitive decline but nutrition alone might
422
not be as efficient as a multidomain intervention. Recent evidence from the FINGER trials
137reported
423
that combining physical exercise, personalized nutritional recommendations to avoid nutrient
424
deficiencies, controlling cardiovascular risks and having cognitive stimulation prevented cognitive
425
decline. However, they recently refocus their message by showing that dietary changes initiated early in
426
the intervention was the most influential for global cognition improvement over two years of follow-up
138
. Therefore, nutrition might have a key role to play in the prevention of cognitive decline. In the case
428
of the FINGER study, dietary recommendations were not focussed on the consumption of fish oil but
429
were either focused to alleviate nutritional deficiency including low blood levels of DHA. It also has to
430
be emphasized that there is currently no drug to prevent, cure or delay the progression of dementia and
431
that some pharmaceutical companies have shut down their research laboratories in this area. Therefore,
432
prevention strategies are currently the most efficient means since once the disease process has started,
433
there is no available drug for limiting its progression. However, there is one group in Canada working
434
on a nutritional strategy, a ketogenic beverage. They reported that a ketogenic beverage increases brain
435
energy metabolism in Alzheimer’s patients
139, 140.
436
Returning to the question of if we are ready to change recommendations on omega-3 fatty acids, we think
437
that we are not there yet. However, working on the biology of aging might greatly improve our
438
understanding about what are «normal» modifications occurring during aging and what can become
439
pathological. Seizing this opportunity, we might contribute to the prevention of cognitive decline in the
440
future with nutrition playing a vital role in this process.
441 442
443
Acknowledgements
444
This work was supported by Canadian Institute of Health Research (CIHR, MOP 119454), Quebec
445
Network of research in aging, Natural Science and Engineering Research Council of Canada, Research
446
center on aging for a scholarship to LC, Faculté de Médecine et des sciences de la santé for a scholarship to
447
HCM, and CIHR for a salary award to MP. MP also hold an institutional research chair on lipid metabolism
448
during aging funded by the medical research center of Université de Sherbrooke.
449
Conflicts of Interest
450
MP received funding from Neptune Wellness Solutions but the funding did not funded studies cited in
451
this review and did not funded any of the work of this review.
452
References
453
1. Barberger-Gateau P, Letenneur L, Deschamps V, Peres K, Dartigues JF, Renaud S. Fish, meat, and risk of 454
dementia: cohort study. Bmj. 2002;325(7370):932-3. 455
2. Holub DJ, Holub BJ. Omega-3 fatty acids from fish oils and cardiovascular disease. Mol Cell Biochem. 456
2004;263(1-2):217-25. 457
3. Morris MC, Evans DA, Tangney CC, Bienias JL, Wilson RS. Fish consumption and cognitive decline with age 458
in a large community study. Arch Neurol. 2005;62(12):1849-53. 459
4. Arterburn LM, Hall EB, Oken H. Distribution, interconversion, and dose response of n-3 fatty acids in 460
humans. Am J Clin Nutr. 2006;83(6):S1467-76. 461
5. Vidgren HM, Agren JJ, Schwab U, Rissanen T, Hanninen O, Uusitupa MI. Incorporation of n-3 fatty acids 462
into plasma lipid fractions, and erythrocyte membranes and platelets during dietary supplementation with fish, 463
fish oil, and docosahexaenoic acid-rich oil among healthy young men. Lipids. 1997;32(7):697-705. 464
6. Calder PC. Polyunsaturated fatty acids and inflammation. Prostaglandins Leukot Essent Fatty Acids. 465
2006;75(3):197-202. Epub 2006/07/11. 466
7. Plourde M, Cunnane SC. Extremely limited synthesis of long chain polyunsaturates in adults: Implications 467
for their dietary essentiality and use as suppements. Appl Physiol Nutr Metab. 2007;32(4):619-34. 468
8. Blasbalg TL, Hibbeln JR, Ramsden CE, Majchrzak SF, Rawlings RR. Changes in consumption of omega-3 and 469
omega-6 fatty acids in the United States during the 20th century. The American Journal of Clinical Nutrition. 470
2011;93(5):950-62. 471
9. Cunnane SC, Plourde M, Pifferi F, Begin M, Feart C, Barberger-Gateau P. Fish, docosahexaenoic acid and 472
Alzheimer's disease. Prog Lipid Res. 2009;48(5):239-56. Epub 2009/04/14. 473
10. Salem N, Jr., Vandal M, Calon F. The benefit of docosahexaenoic acid for the adult brain in aging and 474
dementia. Prostaglandins Leukot Essent Fatty Acids. 2015;92:15-22. 475
11. Barberger-Gateau P, Samieri C, Feart C, Plourde M. Dietary omega 3 polyunsaturated fatty acids and 476
Alzheimer's disease: interaction with apolipoprotein E genotype. Curr Alzheimer Res. 2011;8(5):479-91. 477
12. Loef M, Walach H. The Omega-6/Omega-3 Ratio and Dementia or Cognitive Decline: A Systematic Review 478
on Human Studies and Biological Evidence. Journal of Nutrition in Gerontology and Geriatrics. 2013;32(1):1-23. 479
13. van der Lee SJ, Teunissen CE, Pool R, Shipley MJ, Teumer A, Chouraki V, et al. Circulating metabolites and 480
general cognitive ability and dementia: Evidence from 11 cohort studies. Alzheimer's & dementia : the journal of 481
the Alzheimer's Association. 2018;14(6):707-22. Epub 2018/01/10. 482
14. Mc Auley MT, Mooney KM. Computationally Modeling Lipid Metabolism and Aging: A Mini-review. 483
Computational and structural biotechnology journal. 2015;13:38-46. Epub 2015/03/10. 484
15. Schwenk RW, Holloway GP, Luiken JJ, Bonen A, Glatz JF. Fatty acid transport across the cell membrane: 485
regulation by fatty acid transporters. Prostaglandins, leukotrienes, and essential fatty acids. 2010;82(4-6):149-54. 486
Epub 2010/03/09. 487
16. Mu H, Hoy CE. The digestion of dietary triacylglycerols. Prog Lipid Res. 2004;43(2):105-33. 488
17. Mattson FH, Volpenhein RA. The Digestion and Absorption of Triglycerides. J Biol Chem. 1964;239:2772-7. 489
18. Kunisaki S, C. M. Ultrasound growth patterns of fetal lung malformations: Implications on prenatal care 490
and postnatal outcome. Prenat Diagn. 2015;35(24):89-90. 491
19. D'Aquila T, Hung YH, Carreiro A, Buhman KK. Recent discoveries on absorption of dietary fat: Presence, 492
synthesis, and metabolism of cytoplasmic lipid droplets within enterocytes. Biochimica et biophysica acta. 493
2016;1861(8 Pt A):730-47. Epub 2016/04/25. 494
20. Bisgaier CL, Glickman RM. Intestinal synthesis, secretion, and transport of lipoproteins. Annu Rev Physiol. 495
1983;45:625-36. 496
21. Mansbach CM, 2nd, Nevin P. Intracellular movement of triacylglycerols in the intestine. J Lipid Res. 497
1998;39(5):963-8. 498
22. Cooper AD. Hepatic uptake of chylomicron remnants. J Lipid Res. 1997;38(11):2173-92. 499
23. Redgrave TG, Small DM. Quantitation of the transfer of surface phospholipid of chylomicrons to the high 500
density lipoprotein fraction during the catabolism of chylomicrons in the rat. J Clin Invest. 1979;64(1):162-71. 501
24. Gruffat D, Durand D, Graulet B, Bauchart D. Regulation of VLDL synthesis and secretion in the liver. Reprod 502
Nutr Dev. 1996;36(4):375-89. 503
25. Havel RJ. The formation of LDL: mechanisms and regulation. J Lipid Res. 1984;25(13):1570-6. 504
26. Brown MS, Goldstein JL. A receptor-mediated pathway for cholesterol homeostasis. Science. 505
1986;232(4746):34-47. 506
27. Zhang Y, Ma KL, Ruan XZ, Liu BC. Dysregulation of the Low-Density Lipoprotein Receptor Pathway Is 507
Involved in Lipid Disorder-Mediated Organ Injury. Int J Biol Sci. 2016;12(5):569-79. 508
28. B. B. Stress oxydant et pathologies cardiovasculaires. . Médecine Thérapeutique Cardiol. . 2006;2(1):43-52. 509
29. Fortier M, Tremblay-Mercier J, Plourde M, Chouinard-Watkins R, Vandal M, Pifferi F, et al. Higher plasma 510
n-3 fatty acid status in the moderately healthy elderly in southern Quebec: higher fish intake or aging-related 511
change in n-3 fatty acid metabolism? Prostaglandins, leukotrienes, and essential fatty acids. 2010;82(4-6):277-80. 512
Epub 2010/03/09. 513
30. Einarsson K, Nilsell K, Leijd B, Angelin B. Influence of age on secretion of cholesterol and synthesis of bile 514
acids by the liver. The New England journal of medicine. 1985;313(5):277-82. Epub 1985/08/01. 515
31. Verges B. Pathophysiology of diabetic dyslipidaemia: where are we? Diabetologia. 2015;58(5):886-99. 516
32. Austin MA, Hokanson JE, Edwards KL. Hypertriglyceridemia as a cardiovascular risk factor. Am J Cardiol. 517
1998;81(4A):7B-12B. 518
33. Ericsson S, Berglund L, Frostegard J, Einarsson K, Angelin B. The influence of age on low density lipoprotein 519
metabolism: effects of cholestyramine treatment in young and old healthy male subjects. J Intern Med. 520
1997;242(4):329-37. 521
34. Russell DW, Setchell KD. Bile acid biosynthesis. Biochemistry. 1992;31(20):4737-49. 522
35. Grundy SM, Cleeman JI, Rifkind BM, Kuller LH. Cholesterol lowering in the elderly population. Coordinating 523
Committee of the National Cholesterol Education Program. Arch Intern Med. 1999;159(15):1670-8. 524
36. Fernandez ML, West KL. Mechanisms by which dietary fatty acids modulate plasma lipids. J Nutr. 525
2005;135(9):2075-8. 526
37. Block RC, Harris WS, Pottala JV. Determinants of Blood Cell Omega-3 Fatty Acid Content. The open 527
biomarkers journal. 2008;1:1-6. 528
38. Gellert S, Schuchardt JP, Hahn A. Low long chain omega-3 fatty acid status in middle-aged women. 529
Prostaglandins Leukot Essent Fatty Acids. 2017;117:54-9. 530
39. Harris WS, Luo J, Pottala JV, Espeland MA, Margolis KL, Manson JE, et al. Red blood cell polyunsaturated 531
fatty acids and mortality in the Women's Health Initiative Memory Study. J Clin Lipidol. 2017;11(1):250-9 e5. 532
40. Harris WS, Pottala JV, Lacey SM, Vasan RS, Larson MG, Robins SJ. Clinical correlates and heritability of 533
erythrocyte eicosapentaenoic and docosahexaenoic acid content in the Framingham Heart Study. Atherosclerosis. 534
2012;225(2):425-31. 535
41. Harris WS, Pottala JV, Varvel SA, Borowski JJ, Ward JN, McConnell JP. Erythrocyte omega-3 fatty acids 536
increase and linoleic acid decreases with age: observations from 160,000 patients. Prostaglandins Leukot Essent 537
Fatty Acids. 2013;88(4):257-63. 538
42. Sands SA, Reid KJ, Windsor SL, Harris WS. The impact of age, body mass index, and fish intake on the EPA 539
and DHA content of human erythrocytes. Lipids. 2005;40(4):343-7. 540
43. Aarsetoey H, Ponitz V, Grundt H, Staines H, Harris WS, Nilsen DW. (n-3) Fatty acid content of red blood 541
cells does not predict risk of future cardiovascular events following an acute coronary syndrome. J Nutr. 542
2009;139(3):507-13. 543
44. Block RC, Harris WS, Reid KJ, Sands SA, Spertus JA. EPA and DHA in blood cell membranes from acute 544
coronary syndrome patients and controls. Atherosclerosis. 2008;197(2):821-8. 545
45. Caprari P, Scuteri A, Salvati AM, Bauco C, Cantafora A, Masella R, et al. Aging and red blood cell 546
membrane: a study of centenarians. Exp Gerontol. 1999;34(1):47-57. 547
46. Carver JD, Benford VJ, Han B, Cantor AB. The relationship between age and the fatty acid composition of 548
cerebral cortex and erythrocytes in human subjects. Brain Res Bull. 2001;56(2):79-85. 549
47. Farzaneh-Far R, Harris WS, Garg S, Na B, Whooley MA. Inverse association of erythrocyte n-3 fatty acid 550
levels with inflammatory biomarkers in patients with stable coronary artery disease: The Heart and Soul Study. 551
Atherosclerosis. 2009;205(2):538-43. 552
48. Itomura M, Fujioka S, Hamazaki K, Kobayashi K, Nagasawa T, Sawazaki S, et al. Factors influencing 553
EPA+DHA levels in red blood cells in Japan. In vivo. 2008;22(1):131-5. 554
49. Thorlaksdottir AY, Skuladottir GV, Petursdottir AL, Tryggvadottir L, Ogmundsdottir HM, Eyfjord JE, et al. 555
Positive association between plasma antioxidant capacity and n-3 PUFA in red blood cells from women. Lipids. 556
2006;41(2):119-25. 557
50. Yanagisawa N, Shimada K, Miyazaki T, Kume A, Kitamura Y, Ichikawa R, et al. Polyunsaturated fatty acid 558
levels of serum and red blood cells in apparently healthy Japanese subjects living in an urban area. Journal of 559
atherosclerosis and thrombosis. 2010;17(3):285-94. 560
51. Brenna JT, Plourde M, Stark KD, Jones PJ, Lin YH. Best practices for the design, laboratory analysis, and 561
reporting of trials involving fatty acids. Am J Clin Nutr. 2018;108(2):211-27. 562
52. Asciutti-Moura LS, Guilland JC, Fuchs F, Richard D, Klepping J. Fatty acid composition of serum lipids and its 563
relation to diet in an elderly institutionalized population. Am J Clin Nutr. 1988;48(4):980-7. 564
53. Crowe FL, Skeaff CM, Green TJ, Gray AR. Serum n-3 long-chain PUFA differ by sex and age in a population-565
based survey of New Zealand adolescents and adults. Br J Nutr. 2008;99(1):168-74. 566
54. de Groot RH, van Boxtel MP, Schiepers OJ, Hornstra G, Jolles J. Age dependence of plasma phospholipid 567
fatty acid levels: potential role of linoleic acid in the age-associated increase in docosahexaenoic acid and 568
eicosapentaenoic acid concentrations. Br J Nutr. 2009;102(7):1058-64. 569
55. Dewailly E, Blanchet C, Gingras S, Lemieux S, Holub BJ. Cardiovascular disease risk factors and n-3 fatty 570
acid status in the adult population of James Bay Cree. Am J Clin Nutr. 2002;76(1):85-92. 571
56. Dewailly E, Blanchet C, Lemieux S, Sauve L, Gingras S, Ayotte P, et al. n-3 Fatty acids and cardiovascular 572
disease risk factors among the Inuit of Nunavik. Am J Clin Nutr. 2001;74(4):464-73. 573
57. Dewailly EE, Blanchet C, Gingras S, Lemieux S, Sauve L, Bergeron J, et al. Relations between n-3 fatty acid 574
status and cardiovascular disease risk factors among Quebecers. Am J Clin Nutr. 2001;74(5):603-11. 575
58. Ogura T, Takada H, Okuno M, Kitade H, Matsuura T, Kwon M, et al. Fatty acid composition of plasma, 576
erythrocytes and adipose: their correlations and effects of age and sex. Lipids. 2010;45(2):137-44. 577