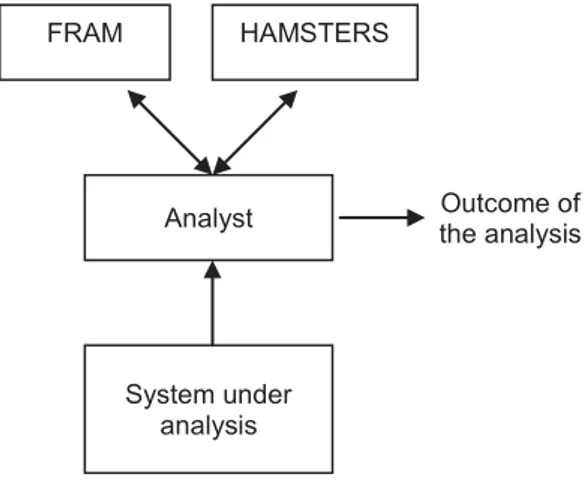
Modelling of Automation Degradation : a Case Study
9
0
0
Texte intégral
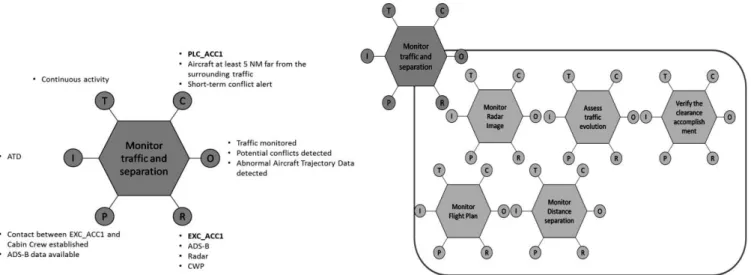
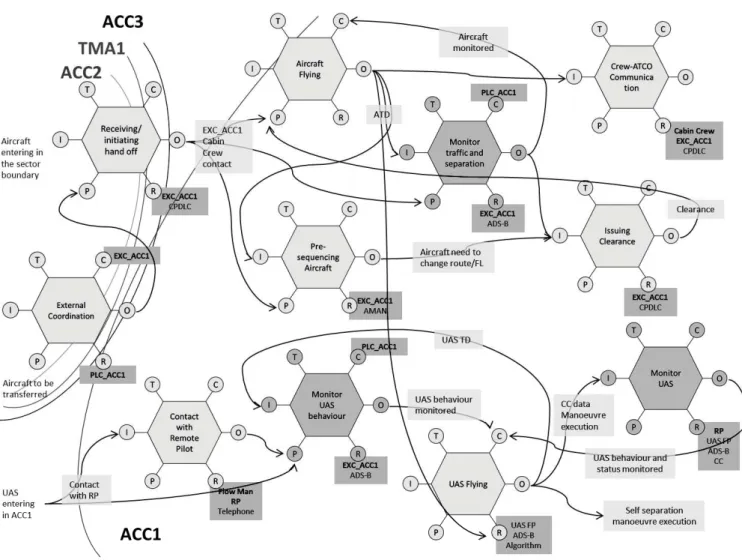
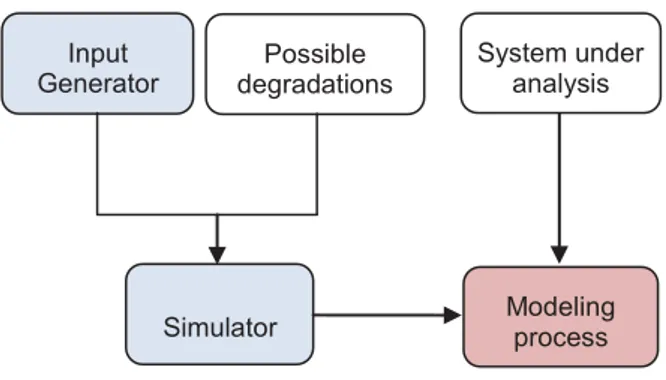
Figure

+3
Documents relatifs
