Any correspondence concerning this service should be sent to the repository administrator:
staff-oatao@inp-toulouse.fr
O
pen
A
rchive
T
oulouse
A
rchive
O
uverte (
OATAO
)
OATAO is an open access repository that collects the work of Toulouse researchers
and makes it freely available over the web where possible.
This is an author -deposited version published in:
http://oatao.univ-toulouse.fr/
Eprints ID: 3798
To link to this article: DOI:10.1016/j.jcis.2009.04.087
URL:
http://dx.doi.org/10.1016/j.jcis.2009.04.087
To cite this document
: Alphonse, Pierre and Bleta, Rudina and Soules, Regis ( 2009)
Effect of PEG on rheology and stability of nanocrystalline titania hydrosols. Journal of
Colloid and Interface Science, vol. 337 (n° 1). pp. 81-87. ISSN 0021-9797
Effect of PEG on rheology and stability of nanocrystalline titania hydrosols
Pierre Alphonse
*, Rudina Bleta, Regis Soules
Université de Toulouse, CIRIMAT UPS-CNRS, 118 route de Narbonne, 31062 Toulouse cedex 9, France
Keywords: Sol–gel Titanium dioxide Colloid Nanofluid Rheology PEG
a b s t r a c t
Very stable titania hydrosols were prepared by fast hydrolysis of titanium isopropoxide in a large excess of water. XRD patterns show that these sols contain nanocrystals (5–6 nm) of anatase (70%) and brookite (30%). TEM images indicate that these primary particles form aggregates whose mean hydrodynamic diameter, determined by photon correlation spectroscopy, is in the range of 80–90 nm. The flow curves of these colloids, recorded for several volume fractions of nanoparticles, can be perfectly fitted, in the range 0–100 s!1, with a power-law model. In this range the behavior is Newtonian but for larger shear rates a shear thinning is observed. The viscosity dependence on particle concentration can be predicted by a Batchelor-type model were the volume fraction of particles is replaced by an effective volume frac-tion of aggregates, taking into account their fractal dimension. Addifrac-tion of polyethylene glycol (PEG 2000) induced a marked decrease (more than 50%) of the sol viscosity down to a minimum. This is explained by assuming that PEG adsorbs on the surface of TiO2particles producing stabilization by steric effects and leading to formation of more compact aggregates. Without PEG the sol viscosity strongly decreases on aging. This effect is not caused by the growth of primary particles. It is rather interpreted as a progressive reorganization of the aggregates toward a more compact packing.
1. Introduction
Titanium dioxide coatings, with large specific surface areas and controlled porosity, have wide applications in different fields such as solar energy conversion [1], photocatalysis [2], and catalysis [3,4]. Among the different synthesis routes used to produce titania films, the sol–gel method is ubiquitous because it has many advan-tages such as purity, homogeneity, control over the microstructure, ease of processing, low cost, and the ability to coat large and com-plex substrates.
By mastering size and organization of the nanoparticles in col-loidal suspensions, titania films with controlled porosity and sur-face area can be synthesized. These nanoparticles are usually prepared from the hydrolysis and condensation of titanium alk-oxides in water. In presence of a large excess of water (w = [H2O]/[Ti] " 100), hydrolysis is very fast and nucleation and
particle growth are completed within a few seconds, producing ultrafine primary particles whose size ranges from 2 to 8 nm[5]. These nanoparticles agglomerate very rapidly, producing large pre-cipitates of macroscopic dimensions[6]. It was shown that, upon aging, such precipitates give a mixture of anatase and brookite [7]. Peptization through the action of an inorganic acid (HCl or
HNO3) is often used to break up the aggregates. The final result
is a translucent suspension containing particles whose size ranges from 15 to 100 nm. Since the final size is still larger than the size of the primary particles, these peptized colloids consist of agglomer-ated structures containing several primary particles[6]. Peptiza-tion is a slow process that exhibits first-order kinetics [8]with time constants of several days[6]. But peptization time can be re-duced by increasing either the temperature (>80 !C) or the acid concentration[7]. The effects of parameters like the pH, the hydro-lysis and peptization temperature, and the alkoxide alkyl group have been studied. It was found that the size of titania nanoparti-cles is mainly controlled by colloidal interactions, whereas chemi-cal factors, such as the rate of hydrolysis and condensation, have a secondary role[9].
Though the synthesis of titania films by the sol–gel process has been extensively studied, most of the sols used in the reported pro-cedures have shown a very limited stability (<24 h). It should be emphasized that, for a large scale production of titania coatings (for example, by roll-coating), a long term stability of the titania sol is needed in order to achieve an acceptable repeatability. Never-theless the peptized sols are prone to reagglomeration and the in-crease of size can lead to flocculation. The poor stabilization of nanosized titania has led to the hypothesis that the slow peptization is the result of the simultaneous action of two opposing mecha-nisms: (i) the fragmentation of primary particle agglomerates by the peptizing agent, and (ii) the coarsening, which is driven by the solid concentration, the titania solubility (which depends on pH),
Corresponding author. Fax: +33 561 556 163.
E-mail addresses:alphonse@chimie.ups-tlse.fr(P. Alphonse), bleta@chimie.ups-tlse.fr(R. Bleta),regis.soules@pca.ups-tlse.fr(R. Soules).
and the size polydispersity[6,10]. Coarsening involves the growth of larger particles at the expense of smaller ones (Ostwald ripening).
Catalytic applications require a tunable porosity to optimize the diffusion rate of reactants toward the adsorption sites and a high surface area to maximize the interface between the reactant flow and the catalyst surface. To control the porosity of titania xerogels, polymers or structure directing agents are added to the sols before or after the peptization[11–18]. These additives are removed by calcination of the xerogels in air. However because these additives interact with titania particles, they could have a strong effect on the stability and rheology of the sols. Therefore knowledge of this influence is mandatory in order to achieve the synthesis of repro-ducible catalytic films with controlled thickness and porosity.
In this paper the effect of polyethylene glycol (PEG) on the sta-bility and rheology of titania sols is investigated. PEG is a widely used additive, but most of the studies were focused on the charac-terization of the microstructure of xerogels and very few are con-sidering its influence on the properties of the colloidal suspensions. 2. Experimental
2.1. Sol synthesis
Titania sols were prepared by hydrolysis of titanium alkoxide in a large excess of water. This method gives colloids of titania nano-crystallites dispersed in water[14,5]. The following procedure was optimized to give crystallites as small as possible and to produce stable sols. Hot (80 !C) distilled water (H2O/Ti " 90) was added
quickly, under vigorous stirring, on titanium (IV) isopropoxide dis-solved in isopropyl alcohol (C3H8O/Ti = 3.5). A white precipitate
was obtained. After 5 min, a solution of nitric acid (H+/Ti = 0.2)
was added to the suspension and the mixture was kept under stir-ring for 16 h at 80 !C. The white suspension changed gradually to a translucent sol by peptization. At the end of peptization the pH of the sol is close to 1.0. More concentrated sols were obtained by evaporation at 80 !C until the required concentration was reached. A slight increase in pH was observed after concentration, i.e., pH " 0.5 for a titania concentration of 10 wt%.
2.2. Rheology
Rheology mesurements on the sols were done with a rheometer Anton Paar Physica MCR fitted with a cone and plate device. The dimensions corresponding to the geometry were 50 mm for the diameter and 1! for the angle. The minimum distance between plate and truncated cone was 0.05 mm. Rheograms were recorded at 20 !C, with shear rate being stepwise increased and decreased over the range of 1–1000 s!1, with a total time period of 300 s for
both the increasing and the decreasing shear rate sweeps. For each sample, a minimum of four measurements was performed. For the lowest shear rates (typically below 10 s!1some fluctuations of
vis-cosity were observed, especially in the case of the less viscous sols.
2.3. Zeta potential and particle hydrodynamic diameter
Electrophoretic mobility and particle hydrodynamic diameters were determined on a Malvern Zetasizer 3000 using a He–Ne laser as light source (k = 633 nm). The zeta potential was calculated from electrophoretic mobility using the Henry equation and Smolu-chowski approximation
Particle sizes were measured by photon correlation spectros-copy (PCS). All size measurements were done at 25 !C with a scat-tering angle of 90!. To control the effect of multiple scatscat-tering and particle interactions, analysis were performed at several dilutions in order to check that the measured size was not dependent on the dilution.
2.4. Powder X-ray diffraction (PXRD)
The crystal structure was investigated by powder X-ray diffrac-tion. Data were collected, at room temperature, on a Bruker AXS D4 h–2h diffractometer, in Bragg–Brentano geometry, using filtered CuK
a
radiation and a graphite secondary-beam monochromator. Diffraction intensities were measured by scanning from 20! to 80! (2h) with a step size of 0.02! (2h). Crystalline structures were refined using FullProf software[19]. The peak profiles were mod-eled by pseudo-Voigt functions. The refined FWHM (full-width at half-maximum) of the lines was used to compute, by the Scherrer equation, the average crystallite size[20]. The instrumental broad-ening contribution was evaluated by using a highly crystalline ru-tile sample as standard.2.5. Specific surface area and density
The specific surface areas were computed from the adsorption isotherms, using the Brunauer–Emmett–Teller (BET) method[21]. Adsorbate was nitrogen and isotherms were recorded at 77 K with a Micromeritics ASAP 2010M.
Skeletal densities of powders were determined using a gas pyc-nometer (Micromeritics AccuPyc 1330) working with helium. Each experimental value results from the average of 10 successive mea-surements on the same sample.
2.6. Electron microscopy
High resolution transmission electron microscopy analyses were performed on a JEOL 2100F operating at 200 kV. Conventional TEM observations were done on a JEOL 1011 operating at 100 kV. Samples were prepared by dipping a carbon-coated grid in a sol di-luted 50 times in water. Then the grid was allowed to dry for 48 h at room temperature.
3. Results and discussion
3.1. Characterization of titania hydrosols
XRD pattern (Fig. 1) shows that titania sols dried at room tem-perature contain two crystalline phases, anatase (tetragonal, I41/
amd, JCPDS No. 00-021-1272) and brookite (orthorhombic, Pbca,
20 30 40 50 60
Intensity (arbitrary unit)
2θ (°) A B Iobs Icalc Iobs-Icalc Bragg-pos
Fig. 1. XRD powder pattern of a titania xerogel dried at 30 !C. Experimental pattern (dots) and whole-pattern decomposition (line) computed for a mixture of anatase
(A: tetragonal unit cell, space group No. 141, I41/amd) and brookite (B:
JCPDS No. 01-076-1934). Due to the numerous brookite reflections, and to the strong overlap of the diffraction lines (because phases are nanocrystalline), we failed to find an acceptable solution by the Rietveld method. However, the profile matching method (whole-pattern decomposition) gave the cell parameters and the peak profiles for both phases. From the peak width we found an average size for anatase crystallites of ca. 6 nm while the size of brookite crystals was ca. 5 nm. As already reported[22], to deter-mine the phase proportions of anatase and brookite, refinement of the structure by the Rietveld method was done within a 2h range restricted to 20–35! (2h). This range includes the (1 0 1) line of ana-tase, and (1 2 0), (1 1 1), and (1 2 1) lines of brookite. For the refine-ment, all parameters except the scale factor were fixed. We found by this method a fraction of brookite in the mixture close to 30%. TEM images (Fig. 2) confirm that the average particle size is 5– 6 nm. A selected area electron diffraction (SAED) pattern shows rings of reflections whose intensities and positions are in good agreement with those observed in the XRD pattern (Fig. 1). The images taken at lower magnification show that primary particles have a strong tendency to form aggregates, with a chainlike struc-ture, containing more than 100 particles (Fig. 2). The packing den-sity of these clusters decreases from center to border. It seems probable that boundary particles could be disconnected from such aggregates at high shear rates.
The specific surface area of a sol dried at room temperature (and outgassed at 50 !C for 24 h) is 240 ± 10 m2g!1. The specific surface
area Sw(in m2g!1) of a material composed of spherical particles all
having the same diameter D (in nm) can be calculated by the equation
Sw¼ 6
q
D; ð1Þwhere
q
is the density of the particles (in kg m!3). This density issupposed to be close to the density of a xerogel prepared by drying the titania sol at room temperature. This xerogel density was mea-sured with a helium pycnometer and found to be 2700 ± 100 kg m!3.
However, the average density of a material containing 70% of ana-tase crystals (
q
= 3900 kg m!3) and 30% of brookite crystals(
q
= 4120 kg m!3) is 4000 kg m!3. This difference can be interpretedby assuming that the numerous hydroxyl groups on the surface of the particles produce a layer having a lower density than the core.
Taking
q
= 2700 kg m!3and D = 6 nm gives a surface area equalto 370 m2g!1. This high value compared to the experimental one
indicates that primary particles in the core of aggregates are so clo-sely packed that nitrogen cannot have access to their surface.
Another evidence that primary particles agglomerate to give aggregates whose size is large enough to scatter visible light is the fact that these suspensions are not transparent but translucent (milky). The mean hydrodynamic diameter of aggregates, deter-mined by photon correlation spectroscopy, was in the range of 80–90 nm, in good agreement with electron microscopy images.
The zeta potentials of suspensions were in the range of +25 to +30 mV. This rather low repulsive barrier can explain why the pep-tization process requires 16 h at 80 !C to give a translucent sol.
3.2. Effect of TiO2concentration (volume fraction)
Concentrations of titania (in g/L) in colloids were calculated from the residual mass after calcination (for 2 h at 800 !C) of a known volume of sol. Assuming volume additivity, the volume fraction of particles,U, can be calculated by
U
¼Cq
; ð2Þwhere C is the concentration (in g/L) of TiO2in the sol and
q
is thedensity of titania particles (
q
= 2700 kg m!3).Rheograms recorded for sols containing increasing amounts of titania are presented in Fig. 3. Rheograms were measured by increasing and then decreasing the shear rate. For each rheogram the curves obtained during reversible shear rate–shear stress paths overlapped; i.e., no hysteresis was observed in any of the studied sols. None of the sols exhibited a Bingham plastic behavior (yield stress can always be approximated to zero). The fitting of the data was done by using the power-law rheological model[23]
r
¼ K _c
n; ð3Þwhere
r
is the shear stress (Pa), _c
the shear rate (s!1), K theconsis-tency coefficient, and n the power-law index. The results of the least-square fitting of the experimental points are reported inTable 1. In the range 1–100 s!1this model gives an excellent agreement
with the experimental data, showing a Newtonian behavior (n very close to 1). For shear rates larger than 100 s!1shear thinning is
ob-served. The behavior observed for water at a low shear rate is
prob-ably due to the rheometer geometry used which is inappropriate for low viscosity media.
The viscosity dependence on particle concentration in diluted suspensions is usually expressed as a function of relative viscosity versus volume fraction of the particles[24]. The relative viscosity,
gr
, being defined asg
r¼g
=g
s; ð4Þwhere
gs
is the viscosity of the dispersion medium (water in our case).The relative viscosities, measured for several shear rates, are plotted against the volume fraction of nanoparticles inFig. 4. For low particle volume fractions, as is the case here, the relative vis-cosity can be predicted by Batchelor’s model[25](valid forU< 0.1)
g
r¼ 1 þ ½g
(U
þ ½g
( 2U
2; ð5Þ
where [
g
] is the intrinsic viscosity defined by½
g
( ¼ limU!0ð
g
r! 1Þ=U
: ð6ÞFor monodisperse dispersions of hard spheres, [
g
] = 5/2[24]. It was recently shown[26–31]that Batchelor’s model strongly underestimates the viscosity measured for nanoscale colloid solu-tions (so-called nanofluids). This deviation was attributed to parti-cle aggregation. The aggregates can be considered as new partiparti-cles with an effective diameter Da. The effective volume fractionUaisgiven by
Ua
¼U
Dad
! "3!Df
; ð7Þ
where d is the diameter of primary particles and Dfis the fractal
dimension of the aggregates. Dfrepresents the packing change with
distance from the center of the aggregate. The lower the value of Df
the more open the packing[23]. The number of particle per aggre-gate is given by na¼ Da d ! "Df : ð8Þ
As in the Eq.(5), relative viscosity will be related to the effective volume fractionUaby 0.001 0.01 0.1 1 10 100 1 10 100 1000 Shear Stress (P a) Shear Rate (s-1) water 3.4 wt.% 5.1 wt.% 7.5 wt.% 12.5 wt.%
Fig. 3. Effect of titania concentration in sols on shear stress–shear rate curves. Temperature = 20 !C. Lines correspond to the fitting of experimental data points
(symbols) by a power-law model (Eq.(3)), in the range 1–100 s!1.
Table 1
Fitting rheological data, in the range 1–100 s!1, with power-law model, Eq.(3): effect
of concentration of titania particles. Concentration (wt%) Volume fraction (U) K Relative error on K (%) n Relative error on n (%) 0 0.000 0.001 0.3 1.00 n Fixed 3.4 0.013 0.004 0.3 0.98 0.1 5.1 0.020 0.007 2.0 0.96 0.6 7.5 0.029 0.012 1.6 0.97 0.5 12.5 0.050 0.016 0.8 0.99 0.2 Rheometer temperature = 20 !C. 0 2 4 6 8 10 12 14 16 0 0.01 0.02 0.03 0.04 0.05 Relative viscosity Volume fraction Shear Rate = 100 Shear Rate = 316 Shear Rate = 1000
Fig. 4. Relative viscosity dependence on volume fraction of titania particles for several shear rates. Rheometer temperature=20 !C. Symbols correspond to
exper-imental data points. Lines correspond to the best fit of experexper-imental data by Eq.(10)
g
r¼ 1 þ ½g
(Ua
þ ½g
( 2U
2a: ð9Þ
Fitting the experimental data
gr
= f(U) presented inFig. 4with the equationg
r¼ 1 þ kU
þ ðkU
Þ 2 with k ¼ ½g
( Da d ! "3!Df ð10Þgives the best k. Then the ratio Da/d can be calculated according to
the values of [
g
] and Df. As shown inFig. 4, a good fit can beob-tained if the data forU> 0.04 are not taken into account.
Assuming that [
g
] = 5/2 (dispersions of hard spheres), to obtain the value of Da/d we need to know Df, the fractal dimension ofaggregates. In the studies on nanofluids, the authors take Df= 1.8
[27,28,30], which corresponds to diffusion-limited aggregation (sticking probability = 1). In our case, the sols are prepared by pep-tization, the sticking probability is less than unity, and we are in reaction-limited aggregation regime. In this case Df" 2.1–2.2
[32]. However, for titania sols prepared by hydrolysis–peptization of titanium isopropoxide, the values reported for Dfwere 1.5[10]
and 1.72[6]. Moreover, the medium value of zeta potential and the time required for peptization are in favor of a low Df. The values
of Da/d, calculated for Df= 1.8 and Df= 1.7, are reported inTable 2.
At low shear rates and for Df= 1.8, the number of particles in
aggre-gates is 240. This number decreases to 115 if Df= 1.7.
It is noted inTable 2that the number of particles in aggregates decreases when the shear rate increases. It can be due to a loss, at high shear rate, of loosely bound particles at the boundary of aggregates.
The number of particles in aggregates reported for nanofluids is generally close to 10[28]. Our larger values can be explained by the fact that our primary particles are smaller and thus have a higher probability of aggregation (as decreasing particle size at constant volume fraction decreases the average interparticle dis-tance, making the attractive van der Waals forces more important [33]). It can be linked with the fact that the relative viscosity of our sols is about three times higher than those reported for larger par-ticles[28].
As shown inFig. 4there is a sharp decrease of the relative vis-cosity forU> 0.04. This can be due to some interpenetration of the branch-like parts of aggregates (Fig. 2) leading to a decrease of the effective volume fractionUa.
3.3. Effect of the PEG 2000 addition
Because the nanoparticles have a strong tendency to agglomer-ate, due to the van der Waals interactions, electrostatic or steric stabilization is usually used to stabilize colloids by creating repul-sions between the particles[33]. Electrostatic stabilization consists of the adsorption of ions on the surface of the particles with crea-tion of the electric double layer, whereas steric stabilizacrea-tion can be achieved by the adsorption of large molecules such as polymers forming a dense layer around the particles[34]. Coil dimensions of polymers are usually larger than the range over which attrac-tions between colloidal particles are active[35]. In this study we investigated the effect of post addition of PEG as a surface modifier for the stabilization of titania sols.
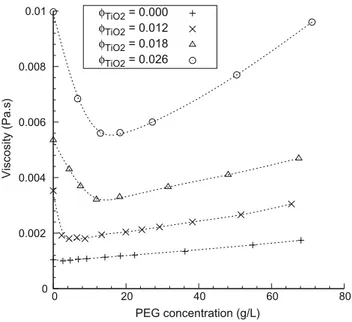
Fig. 5presents the effect of PEG 2000 addition on the viscosity of sols for several volume fractions of titania particles. Whatever the volume fraction of particles, the addition of low amounts of PEG 2000 induces a large decrease of the sol viscosity. On further PEG addition the viscosity reaches a minimum (about 50–60% of the value observed without PEG) and then it increases steadily. The PEG concentration corresponding to the minimum increased when the volume fraction of titania increased. It can be noted that this minimum is reached for a ratio between the number of ethyl-ene oxide units and the number of titanium atoms (EO/Ti) in the range of 0.3–0.4.
We have observed that addition of PEG 2000 up to 40 g/L (EO/ Ti * 2) in a diluted sol (titania volume fraction = 0.012) produced a shift toward low diameters of the particle size distribution deter-mined by photon correlation spectroscopy. The mean hydrody-namic diameter of aggregates decreased from 80–90 to about 50 nm.
The decrease of viscosity, resulting from PEG addition, can be interpreted by assuming that PEG adsorbs on the surface of TiO2
particles producing stabilization by steric effects. This will de-crease the sticking probability, which in turn will inde-crease the frac-tal dimension Df. As the aggregates become more compact, the
effective volume fraction will decrease which finally will decrease the sol viscosity. For example, using Eq.(10), it can be calculated that for na= 120, increasing the fractal dimension from 1.7 to 1.8
leads to a decrease of relative viscosity of more than 50%.
0 0.002 0.004 0.006 0.008 0.01 0 20 40 60 80 Viscosity (Pa.s) PEG concentration (g/L) φTiO2 = 0.000 φTiO2 = 0.012 φTiO2 = 0.018 φTiO2 = 0.026
Fig. 5. Effect of addition of PEG 2000 on the viscosity of titania sols. Viscosity was
measured at a shear rate of 100 s!1. Rheometer temperature = 20 !C. The dotted
lines are shown for visual aid.
Table 2
Fitting relative viscosity with Eq.(10)and assuming [g] = 5/2 and either Df= 1.8 or
Df= 1.7; nais calculated by Eq.(8).
Shear rate (s!1) k Relative error on k (%) n
a(Df= 1.8) na(Df= 1.7) 10 94 1.12 231 115 100 97 0.93 242 120 316 90 0.71 217 109 1000 84 1.01 193 98 Table 3
Fitting rheological data, in the range 1–100 s!1, with power-law model, Eq.(3): Effect
of PEG concentration. PEG 2000 Concentration (g/L) K Relative error on K (%) n Relative error on n (%) 0 0.011 1.6 0.97 0.5 6.7 0.008 0.3 0.98 0.1 13.0 0.006 1.2 0.99 0.6 18.4 0.007 2.6 0.96 0.4 71.2 0.010 0.7 0.99 0.2
The flow curves were fitted by the power-law rheological mod-el. The results of the least-square fitting for a fixed volume fraction of titania (U= 0.026) are reported in Table 3. Again this model gives an excellent agreement with the experimental data. It is noted that the change of viscosity produced by PEG addition is mainly reflected by the consistency coefficient K because the power-law index remains close to unity. Addition of PEG tend to suppress the shear thinning behavior observed for high shear rates. This is in agreement with our previous interpretation because the loss of particles at the external boundary of aggregates at high shear rates will be minimized if aggregates are more compact.
3.4. Effect of aging
To study the effect of aging time on the viscosity, a fresh sol (volume fraction of titania,U= 0.026) was prepared and then di-vided in two parts: one part was kept unchanged while on the other part PEG (18 g/L) was added. The PEG quantity was chosen to be close to the value giving the minimum of viscosity (EO/ Ti = 0.4). This second sol was kept under stirring for about 2 h to achieve the complete dissolution of the polymer. A first measure-ment of the viscosity was performed in both sols (with and without PEG) immediately after the PEG addition starting 2 h after the end of synthesis. Then, the samples were allowed to stand at room temperature. Measurements of viscosity were performed on differ-ent time intervals over a period of 45 days (1160 h). It should be emphasized that no sedimentation was observed with these sols even after several months of settling. However, prior to each mea-surement, the samples were kept under stirring for 10 min in order to ensure the homogenization of the sol.
As shown inFig. 6, a steady decrease of the viscosity with time was observed even when the sols were not concentrated. After the addition of PEG, the viscosity change was rather low and the sols can be considered stables enough to make reproducible coatings.
Aging produces a broadening of the particle size distribution determined by photon correlation spectroscopy. There is also a slight shift toward large diameters and the mean hydrodynamic diameter increases slightly ("10 nm).
To check if the effect of aging was not the consequence of Ost-wald ripening by dissolution–reprecipitation, we have compared the XRD pattern for a fresh sol with the pattern of an aged sol. Ex-cept for a small difference in the first peak intensities, the patterns perfectly overlap, indicating that the aging effect is not caused by the growth of primary particles. Moreover, as rutile (the thermody-namically stable titania phase) was not formed by aging, this indi-cates that the dissolution–reprecipitation is very limited.
Actually the aging effect can be due to the fact that the densifi-cation of aggregates is a slow process with a time scale of several days. During the initial hydrolysis step, the very fast agglomeration process is diffusion-limited because there is no repulsion barrier and particles or clusters stick together each time they touch. Thus the aggregates are loosely packed and their fractal dimension is low (1.5 < Df< 1.7). After the acid addition, adsorption of protons
on the particle surface creates a repulsion barrier and the sticking probability decreases. A progressive reorganization of the aggre-gates toward a more compact packing is expected. To summarize, the effective volume fraction of the clusters is maximum after the sol synthesis and it decreases progressively as the fractal dimen-sion of the aggregates increases. As pointed out by Vorkapic and Matsoukas[6], it is possible that when a packing density limit is reached, the aggregates cannot be peptized anymore.
Finally, we have assumed that PEG addition leads to the forma-tion of more compact aggregates which explains why the aging ef-fect on viscosity is very limited.
4. Conclusion
Titania hydrosols were prepared by fast hydrolysis of titanium alkoxide in a large excess of water. XRD patterns show that these sols contain nanocrystals (5–6 nm) of anatase (70%) and brookite (30%). TEM images indicate that these primary particles have a strong tendency to form aggregates whose mean hydrodynamic diameter, determined by photon correlation spectroscopy, is in the range of 80–90 nm
The flow curves of these colloids, recorded for several volume fractions of nanoparticles, can be perfectly fitted, in the range 0– 100 s!1, with a power-law model. In this range the behavior is
Newtonian but for larger shear rates a shear thinning is observed. The viscosity dependence on particle concentration can be pre-dicted by a Batchelor-type model were the volume fraction of par-ticles is replaced by an effective volume fraction of aggregates taking into account their fractal dimension.
Addition of PEG 2000 induced a marked decrease (about 50– 60% of the value observed without PEG) of the sol viscosity down to a minimum. This decrease can be interpreted by assuming that PEG adsorbs on the surface of TiO2particles producing stabilization
by steric effects and leading to formation of more compact aggregates.
The sol viscosity decreases on aging and this effect is strongly reduced after addition of PEG 2000. This transformation is not caused by the growth of primary particles. It is rather interpreted as a progressive reorganization of the aggregates toward a more compact packing.
References
[1] B. O’Regan, B.M. Gratzel, Nature 353 (1991) 737–740.
[2] O. Carp, C.L. Huisman, A. Reller, Prog. Solid State Chem. 32 (2004) 33–177. [3] M. Haruta, Catal. Today 36 (1997) 153–166.
[4] T. Giornelli, A. Lofberg, E. Elisabeth Bordes-Richard, Appl. Catal. A 305 (2006) 197–203.
[5] G. Oskam, A. Nellore, R.L. Penn, P.C. Searson, J. Phys. Chem. B 107 (2003) 1734– 1738.
[6] D. Vorkapic, T. Matsoukas, J. Colloid Interface Sci. 214 (1999) 283–291. [7] B.L. Bischoff, M.A. Anderson, Chem. Mater. 7 (1995) 1772–1778. 0.002 0.004 0.006 0.008 0.01 0.012 0.014 1 10 100 1000 10000 Viscosity (Pa.s) Time (h) without PEG 18 g/L PEG 2000
Fig. 6. Effect of aging at room temperature on sol viscosity without and with
addition of PEG 2000. Viscosity was measured at a shear rate of 100 s!1. Volume
fraction of titania sol, U = 0.026. Rheometer temperature = 20 !C. The dotted lines are shown for visual aid.
[8] J.R. Bartlett, J.L. Woolfrey, in: L.L. Hench, J.K. West (Eds.), Chemical Processing of Advanced Materials, Wiley, 1992, pp. 23, 247–256.
[9] D. Vorkapic, T. Matsoukas, J. Am. Ceram. Soc. 81 (1998) 2815–2820. [10] J.R. Bartlett, J.L. Woolfrey, Mater. Res. Soc. Symp. Proc. 271 (1992) 309–315. [11] S. Music, M. Gotic, M. Ivanda, S. Popovic, A. Turkovic, R. Trojko, A. Sekulic, K.
Furic, Mater. Sci. Eng. B 47 (1997) 33–40.
[12] G.J.A.A. Soler-Illia, C. Sanchez, New J. Chem. 24 (2000) 493–499. [13] L. Zhang, Y. Zhu, Y. He, W. Li, H. Sun, Appl. Catal. B 40 (2003) 287–292. [14] F. Bosc, A. Ayral, P-A Albouy, C. Guizard, Chem. Mater. 15 (2003) 2463–2468. [15] S. Bu, Z. Jin, X. Liu, L. Yang, Z. Cheng, Mater. Chem. Phys. 88 (2004) 273–279. [16] T. Miki, K. Nishizawa, K. Suzuki, K. Kato, Mater. Lett. 58 (2004) 2751–2753. [17] T. Miki, K. Nishizawa, K. Suzuki, K. Kato, J. Mater. Sci. 39 (2004) 699–701. [18] F. Bosc, A. Ayral, N. Keller, V. Keller, Appl. Catal. B 69 (2007) 133–137. [19] J. Rodrı´guez-Carvajal, Commission Powder Diffraction (IUCr) Newslett. 26
(2001) 12–19.
[20] A.L. Patterson, Phys. Rev. 56 (1939) 978–982.
[21] S. Brunauer, P. Hemmett, E. Teller, J. Am. Chem. Soc. 60 (1938) 309–319. [22] H. Zhang, J. Banfield, J. Phys. Chem. B 104 (2000) 3481–3487.
[23] J.W. Goodwin, R.W. Hughes, in: Rheology for Chemists: An Introduction, The Royal Society of Chemistry, London, 2002.
[24] A. Einstein, Ann. Phys. 19 (1906) 289–306. [25] G.K. Batchelor, J. Fluid Mech. 83 (1977) 97–117.
[26] W.J. Tseng, K.-C. Lin, Mater. Sci. Eng. A355 (2003) 186–192.
[27] R. Prasher, D. Song, J. Wang, P. Phelan, Appl. Catal. Lett. 89 (2006) 133108. [28] H. Chen, Y. Ding, Ch. Tan, New J. Phys. 9 (2007) 367.
[29] Y. He, Y. Jin, H. Chen, Y. Ding, D. Cang, H. Lu, Int. J. Heat Mass Transfer 50 (2007) 2272–2281.
[30] J. Chevalier, O. Tillement, F. Ayela, Appl. Catal. Lett. 91 (2007) 233103. [31] S.M.S. Murshed, K.C. Leong, C. Yang, Int. J. Therm. Sci. 47 (2008) 560–568. [32] T.D. Waite, J.K. Cleaver, J.K. Beattie, J. Colloid Interface Sci. 241 (2001)
333–339.
[33] R.J. Hunter, Foundations of Colloid Science, second ed., Oxford University Press, 2001.
[34] T.F. Tadros, Polym. J. 23 (1991) 683–696.
[35] J. Dutta, H. Hofmann, in: H.S. Nalwa (Ed.), Encyclopedia of Nanoscience and