1
POWER GENERATION AND GASEOUS EMISSIONS PERFORMANCE OF
AN INTERNAL COMBUSTION ENGINE FED WITH BLENDS OF
SOYBEAN AND BEEF TALLOW BIODIESEL
Waldir Nagel Schirmer1, Mayara Ananda Gauer2, Edson Tomaz3, Paulo Rogério Pinto Rodrigues4, Samuel Nelson Melegari de Souza5, Luiz Inácio Chaves6, Lucas Villetti7, Luciano Zart Olanyk8, Alexandre Rodrigues Cabral9,*
1 Environmental Engineering Department, Universidade Estadual do Centro-oeste (UNICENTRO), Irati, Brazil. Address: PR 153 Road, Km 07, Riozinho Square, Irati, Parana State, Brazil, Zip code 84.500-000. Phone: 55 (42) 34213216. [email protected]
2 Environmental Engineering Department, Fundação Municipal Centro Universitário da Cidade de União da Vitória, Bento Munhoz da Rocha Neto Avenue, 3856, São Basílio Magno Square, União da Vitória, Parana State, Brazil, Zip Code 84600-000. Phone: +55 42 3522-1837. E-mail: [email protected]
3 Chemical Processes Department, Chemical Engineering Faculty, Universidade Estadual de Campinas (UNICAMP), Albert Einstein Avenue, 500, Barão Geraldo Square, Campinas, São Paulo State, Brazil, Zip code 13083-852. Phone: +55 19 3521-3953. E-mail: [email protected]
4 Chemistry Department, Universidade Estadual do Centro-oeste (UNICENTRO), Camargo Varela de Sá Street, 03, Vila Carli Square, Guarapuava, Parana State, Brazil, Zip Code 85040-080. Phone: +55 42 3629-8100. E-mail: [email protected]
5 Center of Exact and Technological Sciences, Universidade do Oeste do Paraná, Universitária Street, 2069, Universitário Square, Cascavel, Parana State, Brazil, Zip code 85814-110. Phone: +55 45 3220-7438. E-mail: [email protected]
6 Instituto Federal do Paraná – Campus Assis Chateaubriand, Cívica Avenue, 475, Centro Cívico Square, Assis Chateaubriand, Parana State, Brazil, Zip code 85935-000. Phone: +55 44 3528-0800. E-mail: [email protected]
7 Center of Exact and Technological Sciences, Universidade do Oeste do Paraná, Universitária Street, 2069, Universitário Square, Cascavel, Parana State, Brazil. Phone: +55 45 3220-7438. E-mail: E-mail: [email protected]
Schirmer, W.N., Gauer, M.A., Tomaz, E., Rodrigues, P.R.P., de Souza, S.N.M., Chaves, L.I., Villetti, L., Olanyk, L.Z. and Cabral, A.R. (2016). Power generation and gaseous emissions performance of an internal combustion engine fed with blends of soybean and beef tallow biodiesel. Environmental Technology, 37 (12): 1480-1489. DOI: 10.1080/09593330.2015.1119202
2 8 Mechanical Engineering Department, Universidade Tecnológica Federal do Paraná (UTFPR), Sete de Setembro Avenue, 3165, Curitiba, Parana State, Brazil, Zip code 80.230-901. Phone: 55 (42) 34231259 E-mail: [email protected]
9 Dept. Civil Engineering, Université de Sherbrooke, Sherbrooke, QC, Canada J1K 2R1; +1 819-821-7906; [email protected].
3 Abstract
1 2
This study aimed to compare the performance of an internal combustion engine fed with 3
blends of biodiesel produced from soybean and diesel, and blends of biodiesel produced from 4
beef tallow and diesel. Performance was evaluated in terms of power generated at low 5
loading conditions (0.5; 1.0 and 1.5 kW) and emission of organic and inorganic pollutants. In 6
order to analyze inorganic gases (CO, SO2 and NOx), an automatic analyzer was used and the 7
organic emissions (BTEX) were carried out using a Gas Chromatograph (GC). The results 8
indicate that the introduction of the two biodiesels in the fuel caused a reduction in CO, SO2 9
and BTEX emissions. In addition, the reduction was proportional to the increase in loading 10
regime. Beef tallow biodiesels presented better results regarding emission than soybean 11
biodiesels. The use of pure biodiesels also presented a net reduction in pollutant gas 12
emissions without hindering the engine generator performance. 13
14
Key-words: air pollution; biodiesel; diesel; gas emissions; volatile organic compounds. 15
4 1. Introduction
16 17
The development of alternative – and cleaner - sources of energy has become a major 18
preoccupation of researchers and businesses alike. In particular, the use of biodiesel as an 19
energy source is becoming a viable and environmentally friendly alternative to diesel. 20
Several studies reported in the literature suggest the environmental advantages of using 21
biodiesel – pure or in blends with diesel - for internal combustion engines. A study carried 22
out by the U.S. EPA [1], estimated that the use of a blend with 20% soybean-generated 23
biodiesel and 80% diesel leads to a reduction of ~10% in particulate material, ~21% in 24
hydrocarbons and 11% in carbon monoxide emissions, but a 2% increase in NOx emissions. 25
Ferreira et al. [2] analyzed the volatile organic compound (VOC) emissions in compression 26
ignition engines fueled with diesel and a blend of diesel and biodiesel (B10). In their study, 27
an indirect-injection, four-cylinder engine, coupled with a hydraulic dynamometer, was used 28
with a maximum power generation of 50 kW. The engine worked for 30 hours under varying 29
torques and at a constant rotation (2500 rpm). The results showed a reduction in benzene 30
(19.5%) and ethylbenzene (4.2%) emission with the use of B10, in comparison to pure diesel 31
emissions. Corrêa and Arbilla [3] tested mamona ethyl-derived biodiesel in a six-cylinder 32
diesel engine, at 1500 rpm rotation and steady-state. They obtained a reduction in 33
monoaromatic and polyaromatic hydrocarbon emissions when biodiesel was added to the fuel 34
mix. Dorado et al. [4] carried out tests with pure waste olive oil methyl ester-derived 35
biodiesel and diesel in indirect injection engines operating under steady-state. In this 36
situation, it was verified that the use of biodiesel led to a reduction in CO (~59%); CO2 37
(~9%); NO (~37%) and SO2 (~58%) emissions. However, the introduction of these types of 38
5 biodiesel caused an 81% increase in NO2 emissions and 8.5% increase in fuel consumption. 39
In addition, the technical literature in this particular field seems to corroborate the statement 40
that biodiesel combustion emissions are directly dependent on raw-material precursor and 41
engine operation conditions, such as load and power. 42
43
The purpose of this study was to evaluate the emissions of inorganic (CO, NOx and SO2), and 44
organic (benzene, toluene, ethylzenbene and xylene – BTEX) pollutants, as well as the 45
energetic performance of an internal combustion engine operating under low loadings. Due to 46
their toxicity and harmful effects to human health even in low concentrations, the organic 47
compounds chosen for quantification were benzene, toluene, ethylbenzene and xylenes 48
(BTEX) [5]. They are mainly released by vehicles and are amongst the most commonly 49
found volatiles in the urban atmosphere [5-7]. They are considered as precursors of 50
photochemical reactions that occur in the lower atmosphere, contributing to the formation of 51
photochemical smog [8]. 52
53
The fuels used were blends of soybean biodiesel and mineral diesel, and blends of the latter 54
with beef tallow biodiesel and mineral diesel. Several volumetric blending proportions with 55
mineral diesel were used (B0, B5, B20, B50 and B100). Beef tallow and soybean are by far 56
the main precursors of biodiesels in Brazil, corresponding to ~92% of the biodiesel 57
production in the country [9]. 58
59
A great number of studies involving biofuels are restricted to their possible use as a substitute 60
for gasoline and diesel, and how the latter two compare with biofuels in terms of energy 61
6 output. Quite often, environmental aspects associated with fuel use, such as quantities of 62
greenhouse emissions, are not considered. This aspect is considered herein and is one 63
important novelty of the study. 64
65 66
2. Material and methods 67
68
2.1 Diesel, biodiesel and blends
69 70
In order to carry out the tests in a bench engine, pure type A diesel (provided by Petrobras 71
S.A., Brazil) was used. It had a maximum sulfur content of 1800 ppm and was exempt of any 72
additives. The two basic biodiesel fuels, soybean methyl ester biofuel (herein identified as 73
SB) and beef tallow biofuel (herein identified as BT), were obtained from companies 74
registered at the Petroleum Natural Gas and Biofuels National Agency (ANP, Brazil). BT is a 75
mix of beef tallow methyl ester (62%) and soybean methyl ester (38%). The BT composition 76
results from regulatory requirements that state that soybean must be added to beef tallow so 77
that BT meets the ANP requirements [10] to be commercialized as fuel [11]. 78
79
The upper heating value (UHV) was determined in the laboratory for the three fuels and their 80
blends. The lower heating value (LHV) for each fuel and composition tested was estimated 81
according to Penido Filho [12]. Blends were prepared with 0, 5, 20, 50 and 100% vol. of each 82
biodiesel in the diesel. These proportions are represented herein by B0, B5, B20, B50 and 83
7 B100. Formulation B5 was required by Brazilian legislation when the experiments were 84
performed [13]. As of 2015, the required proportion is 7%. 85
86
2.2 Characterization of the engine used and performance tests
87 88
Emission and power-generation performance tests were performed with a direct-injection, 89
monophase power generator (Branco, model BD 6500 CF) yielding 7.36 kW of power 90
coupled with a 5.5 kW load panel. For each diesel-biodiesel proportion (SB0 to SB100 and 91
BT0 to BT100), the following loadings were evaluated: 0.5 kW, 1.0 kW and 1.5 kW, 92
corresponding to approximately 10%, 20% and 30% of the total load supported by the load 93
panel (5.5 kW). It is worth noting that the manufacturer claims that this Branco model can be 94
powered by alternative fuels (such as biodiesel). 95
96
Engine performance evaluations were carried out for each blend of fuel. The first step was to 97
calculate the brake specific fuel consumption (BSFC; g/kWh) using mass consumption data 98
(kg/s) and applying Eq. (1): 99
100
𝐵𝑆𝐹𝐶 = 3600 𝑀𝐶 𝑉𝑖⁄ (1)
101 102
where V is the output voltage (V) and i is the electrical current (A) 103
104
Finally, the overall performance, expressed as overall efficiency as a function of the system 105
load (E; %), was calculated using Eq. (2) [14]: 106
8 107
(2)
108
109
All the necessary parameters were collected in duplicate and the statistical analysis used was 110
the Randomized Experimental Block Design (Tukey test, at 5% probability level). 111
112
2.3 Combustion emission tests
113 114
2.3.1 Inorganic gases
115
An automatic combustion gas analyzer (Bacharach, model PCA3-285KIT / 24-8453) was 116
used to monitor the emissions of CO, NOx (NO+NO2) and SO2, which are typically released 117
by diesel cycle vehicles. The equipment probe was located near the exhaust gas outlet (or 118
pipe), transversally to the combustion gas exhaust flow. For each sampling, the analyzer was 119
brought to equilibrium with the environmental conditions until the oxygen measurement 120
leveled back to 20.9% vol. at atmospheric pressure. Inorganic gas emissions were assessed 121
for loads 0.5, 1.0, and 1.5 kW, using the same number of fuel formulations previously 122
described. More than 50 samples were collected for CO analysis and 30 for SO2 and NOx for 123
each fuel blend. Statistical analyses were performed following the Randomized Experimental 124
Block Design Test (Tukey test, at 5% probability level). 125
126
2.3.2 Organic gases
127
Sampling and analyses
128 100 BSFC LHV 3600 = E
9 Organic emission tests were carried out for all fuel blends and power loadings. Organic gas 129
sampling followed the U.S. EPA Compendium Method TO-17 [15]. The VOC present in the 130
air were collected by active sampling onto 89-mm long, 6-mm OD and 4-mm ID Perkin 131
Elmer glass sorbent tubes. The solid adsorbent used was the 60-80 mesh, 35-m²/g specific 132
surface area porous polymer Tenax TA (2,6-diphenyl-p-phenylene oxide; supplied by 133
Supelco). The sorbent tubes were filled with 180 mg Tenax TA and conditioned in automatic 134
thermal desorption for 30 minutes at 320 ºC. This ensured the removal of any artifact that 135
could be present in the adsorbent bed. The choice for this adsorbent took into account its 136
hydrophilic feature, minimum artifact level (<1 ng) [15]. In addition, this absorbent is 137
designed to be used in thermal desorption system equipment. The adopted desorption 138
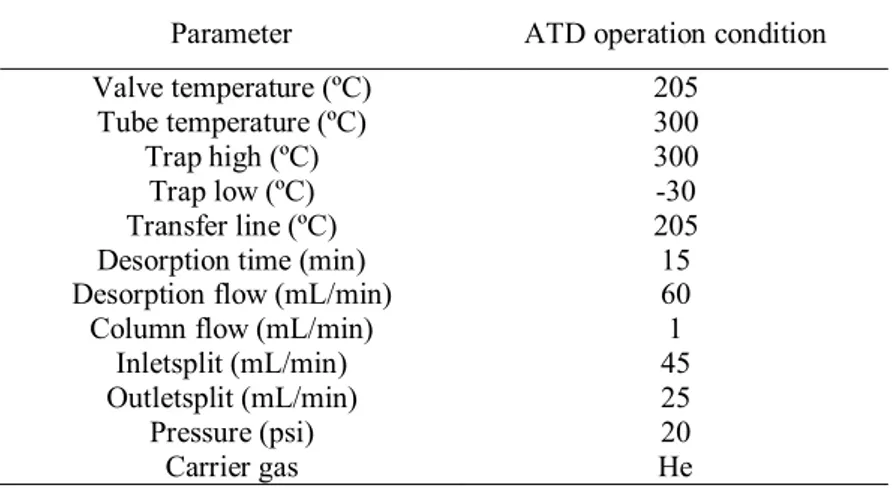
parameters are presented in Table 1. 139
140
Pumping air into the tubes was carried out with a portable pump (AirChek, XR 5000) with 141
sampling air flow fixed at 100 mL/min. It was, therefore, possible to adjust the sampling 142
volume according to the safe sampling volume [15]. Sampling and preliminary analyses 143
pointed out that the safe sampling volume for organic gases was 500 mL. 144
145
After sampling, the tubes were wrapped in tin foil and sent for analysis to the Environmental 146
Technology Development Research Laboratory at the Chemistry Engineering College of 147
Campinas State University (UNICAMP). Samples were analyzed using a Perkin Elmer gas 148
chromatograph, model AutoSystem XL, equipped with a flame ionization detector (FID). 149
150 151
10 Table 1 Desorption parameters in automatic thermal desorption (ATD)
152 153 154
In order to separate the compounds, a 60-m long capillary column, 100% dimethyl 155
polysiloxane, was used. The chromatographic conditions adopted in this study are presented 156
in Table 2. The FID operational conditions were the following: temperature – 250 ºC; 157
synthetic air flow – 420 mL/min; hydrogen flow – 45 mL/min. 158
159 160
Table 2 Chromatographic oven heating conditions 161
162 163
Quality control and calibration curves for organic gases
164
For quality control, organic emission tests included duplicate samplings (for all fuel blends 165
and power loadings) and field blanks. Two tubes were used as field blanks, submitted to the 166
same conditioning, storage and transport conditions as the tubes used in the analyses [15]. 167
The detection and quantification limits (DL and QL) were estimated from the analytical 168
response of laboratory blanks. The standard deviation of mass obtained in the blanks was 169
multiplied by 3.3 to estimate the DL and by 10 to estimate the QL [16]. 170
171
BTEX were quantified by external standard calibration. To prepare the solutions for the 172
calibration curves, methanol (Merck KGaA) was used as a solvent. The stock solution 173
preparation requires previous knowledge of the mass band of the substances that will be 174
11 sampled. A six-point calibration curve (all points in triplicate) for each BTEX was performed 175
so that these analytical curves covered a wide range of masses for the analytes in the samples. 176
In all cases, the coefficients of determination (R2) were greater than 0.99. 177
178
The concentration of each BTEX compound was determined considering its mass (as 179
determined by chromatography) and the safe sampling volume used to trap the gas (500 mL). 180
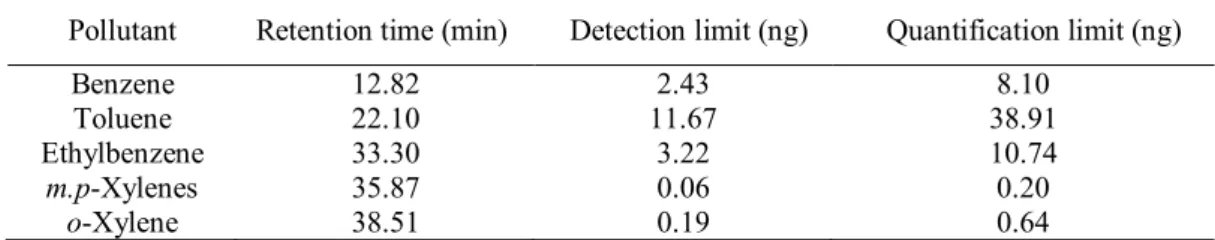
The retention times, detection and quantification limits for each BTEX are shown in Table 3. 181
182
Table 3 BTEX retention times, detection and quantification limits. 183
184 185
3. Results and discussion 186
187
3.1 Engine generator performance
188 189
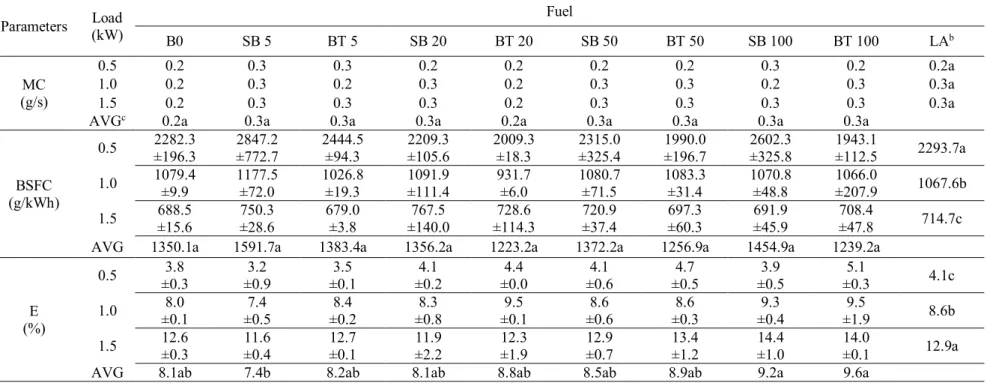
The results obtained from engine performance parameters are presented in Table 4. A first 190
important observation that can be drawn from the results is that mass consumption values 191
were not statistically different from one another (at a 5% probability level), regardless of the 192
applied load and fuel blend. 193
194 195
12 Table 4 - Mass consumption (Mc), brake specific fuel consumption (BSFC) and overall 196
efficiency as a function of the system load (E) using diesel, biodiesel and their blends (at a 197
5% probability level)a 198
199
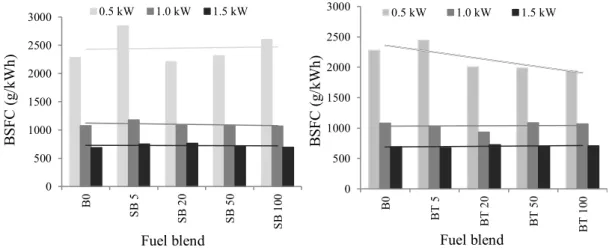
The results presented in Fig. 1 show that brake specific fuel consumption (BSFC) is not 200
affected by variations in fuel blends, a pattern also observed by Oberweis and Al-201
Shemmeri[17] in their comparison of diesel, biodiesel and blends of the two. However, the 202
increase in load supplied to the engine caused a statistically significant reduction in BSFC. 203
Similar results were found by Silva et al. [14]when testing diesel and waste fat biodiesel in 204
an engine generator identical to the one used in this study. Silva et al. [14] claim that the 205
BSFC tends to be higher in low load situations (particularly when lower than 1.5 kW). 206
Valente et al. [18] also observed that the BSFC tends to decrease with higher loads. 207
According to Heywood [19], the increase in BSFC at lower loads is associated with low 208
speeds, which cause lower inertial stress and reduce the mechanical efficiency. The latter is 209
due to higher efforts to pump the gases inside and outside the combustion chamber, and to 210
friction forces from mobile parts inside the engine. In addition to the preceding, Heywood 211
[19] observed that when loads are increased, fuel mass consumption tends to increase due to 212
the higher effort required. This higher amount of burnt fuel, supplies more energy inside the 213
combustion chamber and, as a consequence, causes the temperature to increase. As a result, 214
fuel is burned more efficiently because any residual that would be released with the exhaust 215
gases, gets burned. Accordingly, despite the increase in fuel mass consumption, a reduction 216
in BSFC with higher loads is observed due a more efficient thermodynamic use of the fuel 217
[19]. 218
13 219
Fig. 1 Brake specific fuel consumption (BSFC) as a function of fuel type, fuel blends and 220
loads. 221
222
In Fig. 2, it can be observed that the tendency of the overall efficiency (E) was to increase for 223
all types of blends, with higher efficiencies obtained when higher loadings were supplied to 224
the engine. In addition, the overall efficiency increased with increasing content of biofuel in 225
the mix. For SB, the gain in efficiency with increasing biofuel addition was marginal for the 226
lower loads (0.5 and 1.0 kW; in fact there was a slight decrease for SB5). On the other hand, 227
for the higher load (1.5 kW), the value of E actually decreased for soybean biofuels, but 228
bounced up for the pure biofuel (SB100). The latter’s overall efficiency was nearly 15% 229
greater than that of B0 (14.4% from 12.7%). For BT, the general tendency was for E to 230
increase with increasing loads and blends, with the exception of BT5 at 0.5 kW and BT20 at 231
1.5 kW. The maximum performance obtained in this study was 14.4%, for pure soybean 232
diesel (SB100) at 1.5 kW load. The tendencies observed corroborate those obtained by Silva 233
et al. [14], who also reached the conclusion that for loads lower than 1.5 kW, engine 234
performances remained lower than 15%. 235
236
Fig. 2. Overall efficiency (E) as a function of system load and fuel type and blends. 237
238
3.2 Inorganic gas emissions - CO, SO2 and NOx
239 240
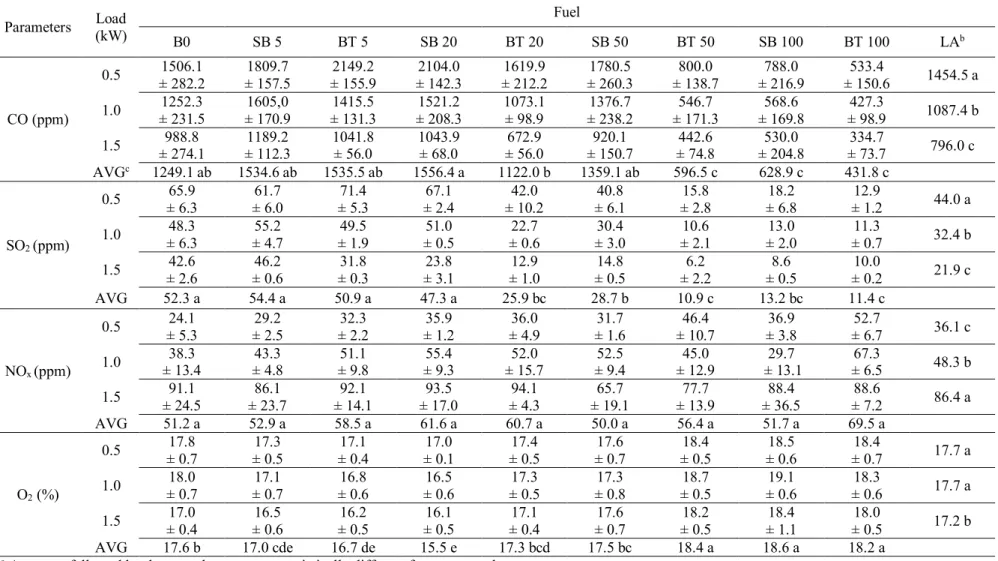
14 The concentrations of inorganic gas (CO, SO2 and NOx) emitted for each load, fuel type and 241
blend are presented in Table 5. To simplify the interpretation of these results, they are also 242
presented in graphic form in Fig. 3. 243
244
Table 5 Inorganic gas emissions (average values and standard deviation at a 5% probability 245
level)a 246
247
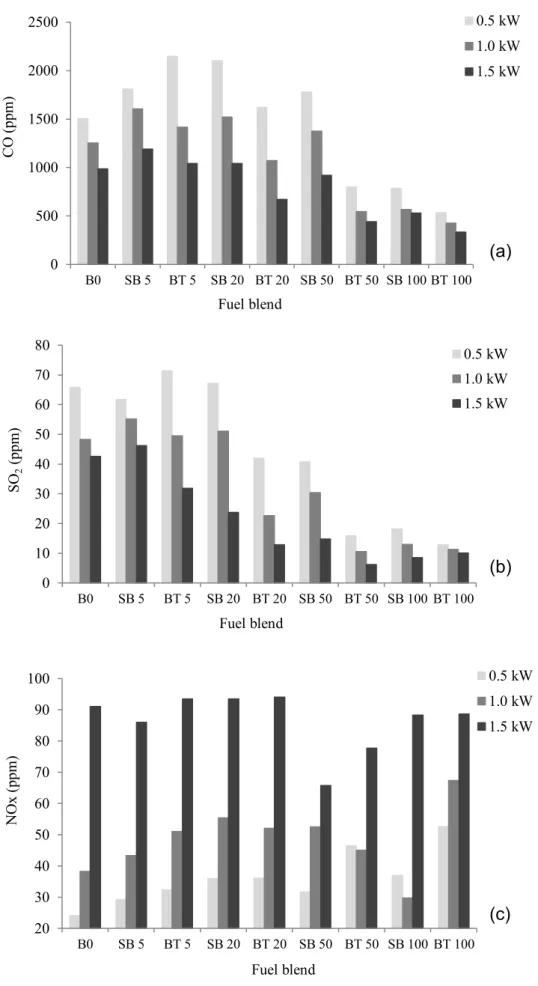
Fig. 3. Inorganic gas emissions as a function of load, fuel type and blend. 248
249
Fig. 3a shows that CO emissions increased with small additions of biofuel to mineral diesel, 250
regardless of the load applied. However, when biofuel additions became greater than 50%, 251
CO emissions decreased abruptly and significantly. Beef tallow biodiesel led to greater 252
decreases in CO emissions than soybean biodiesel. These results were similar to those 253
presented by U.S. EPA [1] which concluded that animal fat biodiesel, due to its higher level 254
of molecule saturation, led to greater reductions in CO emissions than the soybean biodiesel. 255
256
Reductions in CO emissions were higher in conditions in which higher load was applied to 257
the engine. This tendency was also observed by Bueno[20], who evaluated CO combustion 258
emissions in an engine fueled with diesel and 20% soybean ethyl ester (B20), working at 259
constant speed (2000 rpm) and under load fractions 33, 66 and 100% of maximum torque. In 260
general, the CO emissions presented herein corroborate those found in the technical literature 261
[4, 21-23]. 262
15 The percentage of oxygen measured (Table 5) was lower for blends with low biofuel 264
additions (SB5, BT5, SB20 and BT20), which is associated with the greater CO emissions 265
observed for these blends (Fig. 3a). As more biofuel is added to mineral diesel, the 266
concentrations of emitted O2 increase and those of CO become lower. Schumacher et al. [24] 267
and Wang et al. [25] explained that the presence of oxygen in biodiesel provides better 268
conditions for complete combustion, leading to a reduction in CO emissions. In addition, 269
biodiesels have higher cetane numbers, which facilitates complete combustion (as it promotes 270
reduction in ignition delay) and, consequently leads to lower CO release [26, 27]. 271
272
For SB5, the results showed a slight increase in SO2 emissions at higher loads, while the 273
emissions at the lowest load remained the same. For beef tallow, however, SO2 emissions 274
remained at almost the same level for the lower loads after an addition of 5% of this biofuel, 275
but decreased by nearly 25% when the higher load (1.5 kW) was applied. 276
277
For blends with more than 20% of the two biofuels, the trend in SO2 emissions was quite 278
similar to that observed for CO, i.e. a continuous decrease in emissions with further addition 279
of the biofuels. BT emissions for all loads – and blends with more than 20% of biofuels - 280
were lower than those of SB, except when pure biodiesel was employed. The fact that BT 281
blends generate fewer SO2 emissions, agrees with the findings of a study by Miller [28], who 282
observed that the emissions level of this pollutant are lower with animal fat biodiesel, when 283
compared to soybean biodiesel. 284
16 In the end, SO2 emissions from each of the pure biofuels were approximately 75% lower than 286
those from pure diesel (B0). Miranda[29] reached similar results employing waste cooking 287
oil biodiesel. Reductions found for this pollutant are justified by the fact that the biodiesel is 288
practically sulfur free [27, 30-32] compared to 1800 ppm commonly found in diesel. 289
290
NOx emissions showed a very different pattern when compared to the other two pollutants 291
discussed above. The emissions of this pollutant remarkably increased with increasing loads 292
applied to the engine, a behavior also observed by Cheung et al.[33], Elango and 293
Senthilkumar [34], and Xue et al. [35]. However, considering each load separately, there is 294
no apparent pattern associated with NOx emissions as the amount of biofuel in the mix 295
increases. A greater database might help identify a clearer response of the system to the 296
increase in biofuel addition. 297
298
Nabi et al. [21] pointed out that the highest oxygen content in biodiesel [due to a higher 299
concentration of oxygenated groups, such as esters] and proper adjustment of fuel injection 300
timing can contribute to the increase in NO and NO2 emissions. Other studies (i.e. Oberweis 301
and Al-Shemmeri [17]) claim that the increase in NOx emissions with the increase in load, 302
results from the higher temperatures reached in the combustion chamber (and NOx emissions 303
are directly related to the gas combustion temperature). In the present study, the increases in 304
temperature (data not presented) from the low to the mid loadings are minimum, whereas the 305
increases from the mid to the high load vary between 5o C and 10o C (by all means, not a 306
steep increase). 307
17 Li and Gülder [36] claim that the increase in the biodiesel cetane number might be 309
responsible for a reduction in NOx emissions under low loading conditions. Considering that 310
the loads employed in this study were 10%, 20% and 30% of the maximum load, the previous 311
statement seems to corroborate the findings of the present study. 312
313
3.3 Organic Gas Emissions – BTEX
314 315
BTEX Determination
316
The average concentrations obtained as a function of the engine load and fuel used, for the 317
four compounds, are illustrated in Figures 4 to 7. Analyses of the field blanks prepared for 318
each blend and loading did not show the presence of any of the BTEX compounds within 319
detectable limits. 320
321
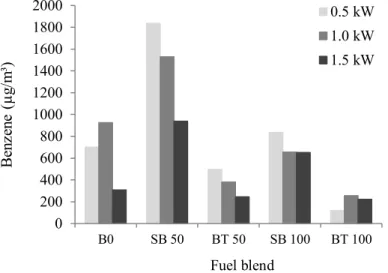
Fig. 4. Benzene emissions with different fuels and loads evaluated. 322
323
Fig. 5. Toluene emissions with different fuels and loads evaluated. 324
325
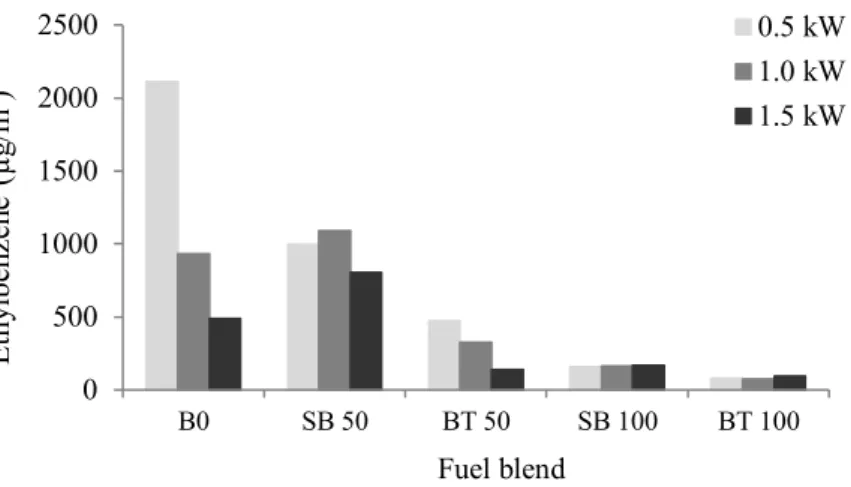
Fig. 6. Ethylbenzene emissions with different fuels and loads evaluated. 326
327
Fig. 7. Xylene emissions with different fuels and loads evaluated. 328
329
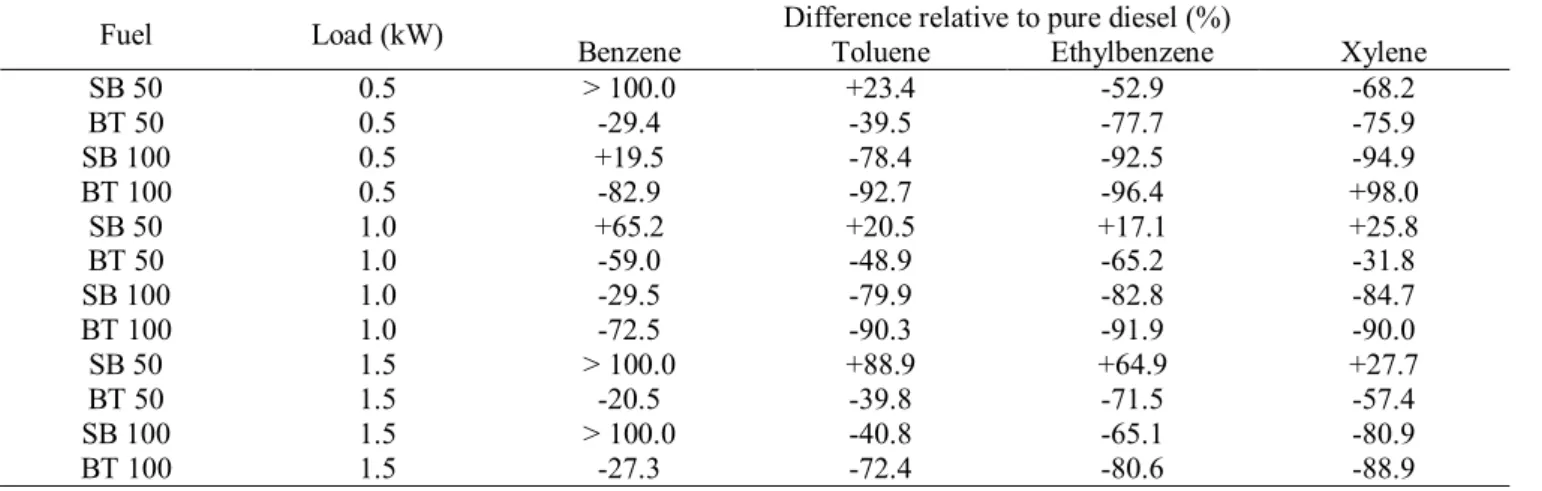
The general pattern for all four compounds was clearly of decreasing emissions with 330
increasing addition of both biofuels. However, the magnitude and intensity of the decrease in 331
18 emissions varied depending on the type of compound and loading applied. Table 6 332
summarizes the changes in BTEX concentrations for all blends and loads. 333
334
Table 6 BTEX emissions relative to pure diesel (SB0 or BT0) 335
336
One of the most common arguments in the literature to explain the BTEX emission 337
reductions when biodiesel is used as a substitute for diesel is the higher oxygen content and 338
cetane number of biodiesels. The fact that biodiesels are more oxygenated than pure diesel 339
favors their oxidation, therefore leading to lower emissions of these pollutants. A higher 340
cetane number favors combustion and promotes lower ignition delay, which reduces 341
incomplete burning, and, consequently, emission of these hydrocarbons [37, 38]. 342
343
Soybean presented higher BTEX concentrations than beef tallow for all comparable blends 344
and loadings. This possibly results from the higher cetane index of methyl esters originated 345
from the beef tallow biodiesel, which possess a higher degree of molecule saturation [27, 39]. 346
The lowest emissions were found when pure beef tallow (BT100) was used. SB100 produced 347
lower BTEX emissions than those of pure diesel, except in the case of Benzene, for which 348
SB100-associated emissions were higher when the lower and higher loadings were applied. 349
The higher oxygen content of pure biodiesel – as compared to pure diesel – also explains why 350
these compounds are more easily oxidized, and, as a result, their use leads to lower emission 351
values than pure diesel [23]. 352
19 In the case of benzene, there was a reduction in emissions with increasing loads applied to 354
the engine (Fig. 4) for blends containing 50% of the two biofuels (i.e. SB50 and BT50). This 355
fact was also reported by Di et al. [38] and Cheung et al. [33] and can be attributed to the 356
higher temperatures reached inside the combustion chamber at higher loads, which facilitates 357
thermal oxidation of benzene. For BT100, there was a slight increase in emissions from the 358
lower loading to the intermediate one (Fig. 4). 359
360
Ballesteros et al. [40] , who tested the response of a diesel engine when biodiesels were 361
employed, observed that the only monoaromatic detected in exhaust, for blends with over 362
70% of biofuels, was benzene. 363
364
As far as Toluene emissions are concerned, only the SB50 blend (for all loadings) did not 365
follow the general pattern of decreasing emissions with addition of SB biofuel to pure diesel. 366
367
An addition of 50% soybean biofuel to pure diesel led to an increase in ethylbenzene 368
emissions for the intermediate and higher loadings. Otherwise, the general pattern of 369
decreasing emissions with addition of biofuel and increase in loading observed for this 370
compound, corroborate what was found in several studies, including one by the U.S. EPA 371
[1], which concluded that ethylbenzene emission reductions could be greater than 61% when 372
biodiesel is used as a substitute for diesel. In another study, Miranda [29] found that 373
ethylbenzene emissions were approximately 75% lower when biodiesel was used, while 374
Magara-Gomez et al. [41] obtained nearly no ethylbenzene emissions when using soybean 375
biodiesel and beef tallow biodiesel in a farm tractor. 376
20 377
Finally, as far as xylenes are concerned, the increase in emissions associated with SB50 was 378
only noticeable for the intermediate and higher loadings (1.0 and 1.5 kW), although much 379
less steep than observed for the other compounds. Several other studies observed a clear 380
reduction in xylene emissions when biodiesels were added to pure diesel [1, 33, 38, 41]. 381
382
According to Corrêa and Arbilla [3], in order to explain emission variations with the addition 383
of biodiesel to diesel, it is necessary to analyze in detail the engineering of the engine 384
generator employed, as well as the degradation mechanisms of organic compounds at high 385
combustion temperatures (thermodynamic destruction, direct emission through incomplete 386
combustion and pyrosynthesis). The same authors also highlighted that the diesel cycle 387
engine combustion is a complex process influenced by several factors such as liquid 388
atomization, quantity of air in the mixture and burning at high temperatures and pressures. 389
The addition of biodiesel to diesel might alter some of the latter’s physico-chemical 390
properties and this might result in greater or lower amounts of substances released to the 391 atmosphere. 392 393 394 4. Conclusions 395 396
The present study involved two precursors of biodiesel, namely soybean and beef tallow. 397
Together, they are responsible for approximately 92% of biodiesel production in Brazil. The 398
21 results permit to conclude that the use of the two selected biodiesels is advantageous with 399
respect to performance and combustion emissions for the engine generator tested. 400
401
A first important observation that can be drawn from the study is that mass consumption 402
values did not vary significantly, regardless of the biofuel, applied load and fuel blend. Brake 403
specific fuel consumption is not affected by variations in fuel blends for both types of 404
biofuels. The tendency of the overall efficiency was to increase for all types of blends when 405
higher loadings were supplied to the engine. In addition, the overall efficiency increased with 406
increasing content of biofuel in the mix. 407
408
As far as emissions abatement is concerned, reductions were in fact obtained, but their 409
magnitude – or importance – varied according to the contaminant studied and to the 410
operational conditions. Indeed, there were reductions in CO, SO2 and BTEX emissions with 411
the use of biodiesel. Beef tallow biodiesel led to greater decreases in CO emissions than 412
soybean biodiesel. The same applied to SO2 reductions, except when pure biodiesel was 413
employed. In the latter case, emissions from the pure biodiesels were approximately the 414
same. This situation was expected, considering that these fuels are basically aromatic and 415
sulfur free in their composition. Use of beef tallow biodiesel led to lower emissions than 416
those produced by soybean biodiesel. NOx emissions showed a very different pattern when 417
compared to the other two pollutants with emissions notably increasing with increasing loads. 418
No particular pattern in NOx emissions reduction or increase as a function of mix increase 419
was observed. 420
22 It should be pointed out that the best performance and emission reductions for the engine 422
generator tested occurred when each of the two biodiesels used were blends containing 423
greater than 50% of the two biofuels. Therefore, considering the methodology followed in 424
this study, the use of the current proportion of biodiesel addition to diesel in Brazil (7%) does 425
not present an optimal environmental advantage. 426 427 428 Acknowledgements 429 430
The Authors would like to thank the Conselho Nacional de Desenvolvimento Científico e 431
Tecnológico (CNPq, Brazil) for its financial support and the Laboratory of Environmental 432
Technologies Research and Development (LPDTA – UNICAMP) for its technical support. 433
434 435
23 References
[1] USEPA (2002). A Comprehensive Analysis of Biodiesel Impacts on Exhaust Emissions, Report EPA420-P-02-001, National Vehicle and Fuel Emissions Laboratory, Ann Arbor, MI, 126 p.
[2] Ferreira, S.L., et al. (2008). Analysis of the emissions of volatile organic compounds from
the compression ignition engine fueled by diesel-biodiesel blend and diesel oil using gas chromatography. Energy, 33(12): 1801-6.
[3] Corrêa, S.M. and G. Arbilla (2006). Aromatic hydrocarbon emissions in diesel and
biodiesel exhaust. Atmospheric Environment, 40(35): 6821-6826.
[4] Dorado, M.P., et al. (2003). Exhaust emissions from a diesel engine fueled with
transesterified waste olive oil. Fuel, 82(11): 1311-1315.
[5] Buczynska, A.J., et al. (2009). Atmospheric BTEX-concentrations in an area with
intensive street traffic. Atmospheric Environment, 43(2): 311-318.
[6] Fernandes, M.B., et al. (2002). Atmospheric BTX and polyaromatic hydrocarbons in Rio
de Janeiro, Brazil. Chemosphere, 47(4): 417-425.
[7] Ras-Mallorqui, M.R., R.M. Marce-Recasens, and F. Borrull-Ballarin (2007).
Determination of volatile organic compounds in urban and industrial air from Tarragona by thermal desorption and gas chromatography-mass spectrometry. Talanta, 72(3):
941-950.
[8] Muezzinoglu, A., M. Odabasi, and L. Onat (2001). Volatile organic compounds in the air
24 [9] Agência Nacional do Petróleo, Gás Natural e Biocombustíveis (ANP). Boletim Mensal
de Biodiesel, November 2013, Brasília - DF, 14 p.
[10] Agência Nacional do Petróleo, Gás Natural e Biocombustíveis (ANP). Resolução No. 14, May 2012, Brasilia, 9 p.
[11] Corrêa, I.M., J.V.G. Maziero, and M. Storino (2011). Mistura de biodiesel de sebo
bovino em motor diesel durante 600 horas. Ciência Rural, 41(7): 1189-1194.
[12] Penido Filho, P., Os motores à combustão interna. 1st ed. Vol. 1. 1983, Belo Horizonte: Ed. Lemi. 699 p.
[13] Ministério de Minas e Energia (MME). C.N.d.P. Energética. Resolução nº 06, Art. 2º, Lei nº 11.097/2005, 2009, Brasília, Brazil.
[14] Silva, M.J., et al. (2012). Motor gerador ciclo diesel sob cinco proporções de diesel
com óleo diesel. Revista Brasileira Engenharia Agrícola e Ambiental, 16(3): 320-326.
[15] USEPA (1999). Determination of Volatile Organic Compounds in Ambient Air Using Active Sampling Onto Sorbent Tubes, Compendium of Methods for the Determination of Toxic Organic Compounds in Ambient Air (TO-17), 2nd ed., Report EPA/625/R-96/010b, USEPA, Cincinnati, OH, 53 p.
[16] Ribani, M., C.H. Collins, and C.B.G. Bottoli (2007). Validation of chromatographic
methods: Evaluation of detection and quantification limits in the determination of impurities in omeprazole. Journal of Chromatography A, 1156(1–2): 201-205.
[17] Oberweis, S. and T.T. Al-Shemmeri (2010). Effect of Biodiesel blending on emissions
and efficiency in a stationary diesel engine. in 10th Intl. Conf. on Renewable Energies and
25 [18] Valente, O.S., et al. (2010). Fuel consumption and emissions from a diesel power
generator fuelled with castor oil and soybean biodiesel. Fuel, 89(12): 3637-3642.
[19] Heywood, J.B., Internal combustion engine fundamentals. 1988, New York: McGraw Hill. 930 p.
[20] Bueno, A.V. (2006). Análise da operação de motores diesel com misturas parciais de
biodiesel. Ph.D. Thesis, Faculdade de Engenharia Mecânica, Universidade Estadual de
Campinas; 120 p.
[21] Nabi, M.N., M.M. Rahman, and M.S. Akhter (2009). Biodiesel from cotton seed oil and
its effect on engine performance and exhaust emissions. Applied Thermal Engineering,
29(11-12): 2265-2270.
[22] Pereira, R.G., et al. (2007). Exhaust emissions and electric energy generation in a
stationary engine using blends of diesel and soybean biodiesel. Renewable Energy,
32(14): 2453-2460.
[23] Qi, D.H., et al. (2009). Combustion and performance evaluation of a diesel engine
fueled with biodiesel produced from soybean crude oil. Renewable Energy, 34(12):
2706-2713.
[24] Schumacher, L.G., et al. (1996). Heavy-duty engine exhaust emission tests using methyl
ester soybean oil/diesel fuel blends. Bioresource Technology, 57(1): 31-36.
[25] Wang, W.G., et al. (2000). Emissions from nine heavy trucks fueled by diesel and
biodiesel blend without engine modification. Environmental Science and Technology,
34(6): 933-939.
[26] Altiparmak, D., et al. (2007). Alternative fuel properties of tall oil fatty acid methyl
26 [27] Knothe, G., et al., Manual do Biodiesel. 2006, São Paulo: Edgard-Blücherp.
[28] Miller, C.A. (2008). Characterizing Emissions from the Combustion of Biofuels, Report EPA/600/R-08/069, U.S. Environmental Protection Agency, National Risk Management Research Laboratory, Research Triangle Park, NC, 51 p.
[29] Miranda, G.R. (2007). Avaliação das Emissões Atmosféricas Provenientes da
Combustão do Diesel, Biodiesel de Óleo de Fritura e suas Misturas. M.Sc. Thesis,
Universidade Federal de Santa Catarina; 108 p.
[30] Agarwal, A.K. (2006). Biofuels (alcohols and biodiesel) applications as fuels for
internal combustion engines. Prog. Energy Combust. Sci., 33: 233-271.
[31] Tashtoush, G.M., M.I. Al-Widyan, and M.M. Al-Jarrah (2004). Experimental study on
evaluation and optimization of conversion of waste animal fat into biodiesel. Energy
Conversion and Management, 45(17): 2697-2711.
[32] Villarreyes, J.A.M., et al. (2007). Diesel/biodiesel proportion for by-compression
ignition engines. Fuel, 86: 1977-1982.
[33] Cheung, C.S., L. Zhu, and Z. Huang (2009). Regulated and unregulated emissions from
a diesel engine fueled with biodiesel and biodiesel blended with methanol. Atmos.
Environ., 43: 4865-4872.
[34] Elango, T. and T. Senthilkumar (2011). Combustion and emission characteristics of
a diesel engine fuelled with jatropha and diesel oil blends. Therm. Sci., 15(04):
1205-1214.
[35] Xue, J., T.E. Grift, and A.C. Hansen (2011). Effect of biodiesel on engine performances
27 [36] Li, X. and Ö. Gülder, L., Effects of fuel cetane number , density and aromatic content
on diesel engine NOx emissions at different operating conditions, in 4th International
Symposium Comodia. 1998: Kyoto, Japan. p. 111-116.
[37] Lim, Y., et al. (2012). The Effect of the Diesel Cetane Number on Exhaust Emissions
Characteristics by Various Additives. J. Therm. Sci. Techn., 7(01): 90-103.
[38] Di, Y., C.S. Cheung, and Z. Huang (2009). Experimental investigation on regulated and
unregulated emissions of a diesel engine fueled with ultra-low sulfur diesel fuel blended with biodiesel from waste cooking oil. Sci. Total Environ., 407: 835-846.
[39] Dabdoub, M.J., J.L. Bronzel, and M.A. Rampin (2009). Biodiesel: Visão Crítica do
Status Atual e Perspectivas na Academia e na Indústria. Revista Química Nova, 32(03):
776-792.
[40] Ballesteros, R., et al. (2008). Speciation of the semivolatile hydrocarbon engine
emissions from sunflower biodiesel. Fuel, 87(10-11): 1835-1843.
[41] Magara-Gomez, K.T., et al. (2012). Sensitivity of hazardous air pollutant emissions to
the combustion of blends of petroleum diesel and biodiesel fuel. Atmos. Environ., 50:
28 List of Tables
Table 1 Desorption parameters in automatic thermal desorption (ATD) Table 2 Chromatographic oven heating conditions
Table 3 BTEX retention times, detection and quantification limits.
Table 4 - Mass consumption (Mc), brake specific fuel consumption (BSFC) and overall efficiency as a function of the system load (E) using diesel, biodiesel and their blends (at a 5% probability level)a
Table 5 Inorganic gas emissions (average values and standard deviation at a 5% probability level)a
29 List of Figures
Fig. 1 Brake specific fuel consumption (BSFC) as a function of fuel type, fuel blends and loads.
Fig. 2. Overall efficiency (E) as a function of system load and fuel type and blends. Fig. 3. Inorganic gas emissions as a function of load, fuel type and blend.
Fig. 4. Benzene emissions with different fuels and loads evaluated. Fig. 5. Toluene emissions with different fuels and loads evaluated. Fig. 6. Ethylbenzene emissions with different fuels and loads evaluated. Fig. 7. Xylene emissions with different fuels and loads evaluated.
Table 1. Desorption parameters in automatic thermal desorption (ATD)
Parameter ATD operation condition
Valve temperature (ºC) 205
Tube temperature (ºC) 300
Trap high (ºC) 300
Trap low (ºC) -30
Transfer line (ºC) 205
Desorption time (min) 15
Desorption flow (mL/min) 60
Column flow (mL/min) 1
Inletsplit (mL/min) 45
Outletsplit (mL/min) 25
Pressure (psi) 20
Table 2. Chromatographic oven heating conditions
Step Rate (ºC/min) Temperature (ºC) Time (min)
Initial 0.0 35 35
1 2.0 60 10
2 1.5 80 5
3 7.0 100 10
Table 3. BTEX retention times, detection and quantification limits.
Pollutant Retention time (min) Detection limit (ng) Quantification limit (ng)
Benzene 12.82 2.43 8.10
Toluene 22.10 11.67 38.91
Ethylbenzene 33.30 3.22 10.74
m.p-Xylenes 35.87 0.06 0.20
Table 4. Mass consumption (Mc), break specific fuel consumption (BSFC) and overall efficiency as a function of the system load (E) using diesel, biodiesel and their blends
(at 5% probability level)a
Parameters (kW) Load Fuel
B0 SB 5 BT 5 SB 20 BT 20 SB 50 BT 50 SB 100 BT 100 LAb MC (g/s) 0.5 0.2 0.3 0.3 0.2 0.2 0.2 0.2 0.3 0.2 0.2a 1.0 0.2 0.3 0.2 0.3 0.2 0.3 0.3 0.2 0.3 0.3a 1.5 0.2 0.3 0.3 0.3 0.2 0.3 0.3 0.3 0.3 0.3a
AVGc 0.2a 0.3a 0.3a 0.3a 0.2a 0.3a 0.3a 0.3a 0.3a
BSFC (g/kWh)
0.5 2282.3 ±196.3 ±772.7 2847.2 2444.5 ±94.3 2209.3 ±105.6 2009.3 ±18.3 2315.0 ±325.4 1990.0 ±196.7 ±325.8 2602.3 1943.1 ±112.5 2293.7a 1.0 1079.4 ±9.9 1177.5 ±72.0 1026.8 ±19.3 1091.9 ±111.4 931.7 ±6.0 1080.7 ±71.5 1083.3 ±31.4 1070.8 ±48.8 1066.0 ±207.9 1067.6b 1.5 ±15.6 688.5 750.3 ±28.6 679.0 ±3.8 ±140.0 767.5 ±114.3 728.6 720.9 ±37.4 ±60.3 697.3 691.9 ±45.9 708.4 ±47.8 714.7c AVG 1350.1a 1591.7a 1383.4a 1356.2a 1223.2a 1372.2a 1256.9a 1454.9a 1239.2a
E (%)
0.5 ±0.3 3.8 ±0.9 3.2 ±0.1 3.5 ±0.2 4.1 ±0.0 4.4 ±0.6 4.1 ±0.5 4.7 ±0.5 3.9 ±0.3 5.1 4.1c 1.0 ±0.1 8.0 ±0.5 7.4 ±0.2 8.4 ±0.8 8.3 ±0.1 9.5 ±0.6 8.6 ±0.3 8.6 ±0.4 9.3 ±1.9 9.5 8.6b 1.5 ±0.3 12.6 11.6 ±0.4 ±0.1 12.7 ±2.2 11.9 ±1.9 12.3 12.9 ±0.7 ±1.2 13.4 14.4 ±1.0 14.0 ±0.1 12.9a
AVG 8.1ab 7.4b 8.2ab 8.1ab 8.8ab 8.5ab 8.9ab 9.2a 9.6a
a The averages followed by the same letter are not statistically different from one another. b LA: load average
Table 5. Inorganic gas emission (average values and standard deviation at 5% probability level)a
Parameters (kW) Load Fuel
B0 SB 5 BT 5 SB 20 BT 20 SB 50 BT 50 SB 100 BT 100 LAb CO (ppm) 0.5 ± 282.2 1506.1 ± 157.5 1809.7 ± 155.9 2149.2 ± 142.3 2104.0 ± 212.2 1619.9 ± 260.3 1780.5 ± 138.7 800.0 ± 216.9 788.0 ± 150.6 533.4 1454.5 a 1.0 ± 231.5 1252.3 ± 170.9 1605,0 ± 131.3 1415.5 ± 208.3 1521.2 1073.1 ± 98.9 ± 238.2 1376.7 ± 171.3 546.7 ± 169.8 568.6 ± 98.9 427.3 1087.4 b 1.5 ± 274.1 988.8 ± 112.3 1189.2 1041.8 ± 56.0 1043.9 ± 68.0 ± 56.0 672.9 ± 150.7 920.1 ± 74.8 442.6 ± 204.8 530.0 ± 73.7 334.7 796.0 c AVGc 1249.1 ab 1534.6 ab 1535.5 ab 1556.4 a 1122.0 b 1359.1 ab 596.5 c 628.9 c 431.8 c SO2 (ppm) 0.5 ± 6.3 65.9 ± 6.0 61.7 ± 5.3 71.4 ± 2.4 67.1 ± 10.2 42.0 ± 6.1 40.8 ± 2.8 15.8 ± 6.8 18.2 ± 1.2 12.9 44.0 a 1.0 ± 6.3 48.3 ± 4.7 55.2 ± 1.9 49.5 ± 0.5 51.0 ± 0.6 22.7 ± 3.0 30.4 ± 2.1 10.6 ± 2.0 13.0 ± 0.7 11.3 32.4 b 1.5 ± 2.6 42.6 ± 0.6 46.2 ± 0.3 31.8 ± 3.1 23.8 ± 1.0 12.9 ± 0.5 14.8 ± 2.2 6.2 ± 0.5 8.6 ± 0.2 10.0 21.9 c AVG 52.3 a 54.4 a 50.9 a 47.3 a 25.9 bc 28.7 b 10.9 c 13.2 bc 11.4 c NOx (ppm) 0.5 ± 5.3 24.1 ± 2.5 29.2 ± 2.2 32.3 ± 1.2 35.9 ± 4.9 36.0 ± 1.6 31.7 ± 10.7 46.4 ± 3.8 36.9 ± 6.7 52.7 36.1 c 1.0 ± 13.4 38.3 ± 4.8 43.3 ± 9.8 51.1 ± 9.3 55.4 ± 15.7 52.0 ± 9.4 52.5 ± 12.9 45.0 ± 13.1 29.7 ± 6.5 67.3 48.3 b 1.5 ± 24.5 91.1 ± 23.7 86.1 ± 14.1 92.1 ± 17.0 93.5 ± 4.3 94.1 ± 19.1 65.7 ± 13.9 77.7 ± 36.5 88.4 ± 7.2 88.6 86.4 a AVG 51.2 a 52.9 a 58.5 a 61.6 a 60.7 a 50.0 a 56.4 a 51.7 a 69.5 a O2 (%) 0.5 ± 0.7 17.8 ± 0.5 17.3 ± 0.4 17.1 ± 0.1 17.0 ± 0.5 17.4 ± 0.7 17.6 ± 0.5 18.4 ± 0.6 18.5 ± 0.7 18.4 17.7 a 1.0 ± 0.7 18.0 ± 0.7 17.1 ± 0.6 16.8 ± 0.6 16.5 ± 0.5 17.3 ± 0.8 17.3 ± 0.5 18.7 ± 0.6 19.1 ± 0.6 18.3 17.7 a 1.5 ± 0.4 17.0 ± 0.6 16.5 ± 0.5 16.2 ± 0.5 16.1 ± 0.4 17.1 ± 0.7 17.6 ± 0.5 18.2 ± 1.1 18.4 ± 0.5 18.0 17.2 b AVG 17.6 b 17.0 cde 16.7 de 15.5 e 17.3 bcd 17.5 bc 18.4 a 18.6 a 18.2 a
a Averages followed by the same letter are not statistically different from one another. b LA: load average
Table 6. BTEX emissions relative to pure diesel (SB0 or BT0)
Fuel Load (kW) Benzene Difference relative to pure diesel (%)Toluene Ethylbenzene Xylene
SB 50 0.5 > 100.0 +23.4 -52.9 -68.2 BT 50 0.5 -29.4 -39.5 -77.7 -75.9 SB 100 0.5 +19.5 -78.4 -92.5 -94.9 BT 100 0.5 -82.9 -92.7 -96.4 +98.0 SB 50 1.0 +65.2 +20.5 +17.1 +25.8 BT 50 1.0 -59.0 -48.9 -65.2 -31.8 SB 100 1.0 -29.5 -79.9 -82.8 -84.7 BT 100 1.0 -72.5 -90.3 -91.9 -90.0 SB 50 1.5 > 100.0 +88.9 +64.9 +27.7 BT 50 1.5 -20.5 -39.8 -71.5 -57.4 SB 100 1.5 > 100.0 -40.8 -65.1 -80.9 BT 100 1.5 -27.3 -72.4 -80.6 -88.9
Figure 1. Break specific fuel consumption (BSFC) as a function of fuel type, fuel blends and loads.
Figure 2. Overall efficiency (E) as a function of system load and fuel type and blends 0 500 1000 1500 2000 2500 3000 B0 SB 5 SB 20 SB 50 SB 10 0 BS FC (g/ kW h) Fuel blend 0.5 kW 1.0 kW 1.5 kW 0 500 1000 1500 2000 2500 3000 B0 BT 5 BT 2 0 BT 5 0 BT 1 00 BS FC (g/ kW h) Fuel blend 0.5 kW 1.0 kW 1.5 kW 0 2 4 6 8 10 12 14 16 B0 SB 5 SB 20 SB 50 SB 100 E (%) Fuel blends 0.5 kW 1.0 kW 1.5 kW 0 2 4 6 8 10 12 14 16 B0 BT 5 BT 20 BT 50 BT 100 E (%) Fuel blends 0.5 kW 1.0 kW 1.5 kW
Figure 3. Inorganic gas emissions as a function of load, fuel type and blends.
0 500 1000 1500 2000 2500 B0 SB 5 BT 5 SB 20 BT 20 SB 50 BT 50 SB 100 BT 100 CO (ppm ) Fuel blend 0.5 kW 1.0 kW 1.5 kW 0 10 20 30 40 50 60 70 80 B0 SB 5 BT 5 SB 20 BT 20 SB 50 BT 50 SB 100 BT 100 SO2 (ppm ) Fuel blend 0.5 kW 1.0 kW 1.5 kW 20 30 40 50 60 70 80 90 100 B0 SB 5 BT 5 SB 20 BT 20 SB 50 BT 50 SB 100 BT 100 N O x (ppm ) Fuel blend 0.5 kW 1.0 kW 1.5 kW (a) (b) (c)
Figure 4. Benzene emissions with different fuels and loads evaluated.
Figure 5. Toluene emissions with different fuels and loads evaluated.
0 200 400 600 800 1000 1200 1400 1600 1800 2000 B0 SB 50 BT 50 SB 100 BT 100 Be nz en e (µ g/ m ³) Fuel blend 0.5 kW 1.0 kW 1.5 kW 0 200 400 600 800 1000 1200 B0 SB 50 BT 50 SB 100 BT 100 To lu en e (µ g/ m ³) Fuel blend 0.5 kW 1.0 kW 1.5 kW
Figure 6. Ethylbenzene emissions with different fuels and loads evaluated.
Figure 7. Xylenes emissions with different fuels and loads evaluated.
0 500 1000 1500 2000 2500 B0 SB 50 BT 50 SB 100 BT 100 Eth yl be nz en e (µ g/ m ³) Fuel blend 0.5 kW 1.0 kW 1.5 kW 0 500 1000 1500 2000 2500 3000 3500 B0 SB 50 BT 50 SB 100 BT 100 X yl en es (µ g/ m ³) Fuel blend 0.5 kW 1.0 kW 1.5 kW