HAL Id: hal-00608314
https://hal.archives-ouvertes.fr/hal-00608314
Submitted on 12 Jul 2011
HAL is a multi-disciplinary open access
archive for the deposit and dissemination of
sci-entific research documents, whether they are
pub-lished or not. The documents may come from
teaching and research institutions in France or
abroad, or from public or private research centers.
L’archive ouverte pluridisciplinaire HAL, est
destinée au dépôt et à la diffusion de documents
scientifiques de niveau recherche, publiés ou non,
émanant des établissements d’enseignement et de
recherche français ou étrangers, des laboratoires
publics ou privés.
TOWARDS A FRAMEWORK OF INTER-OBSERVER
ANALYSIS FOR MULTIMEDIA QUALITY
ASSESSMENT
Ulrich Engelke, Yohann Pitrey, Patrick Le Callet
To cite this version:
Ulrich Engelke, Yohann Pitrey, Patrick Le Callet.
TOWARDS A FRAMEWORK OF
INTER-OBSERVER ANALYSIS FOR MULTIMEDIA QUALITY ASSESSMENT. Third International
Work-shop on Quality of Multimedia Experience (QoMEX), Sep 2011, Mechelen, Belgium. pp. 183- 188,
�10.1109/QoMEX.2011.6065700�. �hal-00608314�
TOWARDS A FRAMEWORK OF INTER-OBSERVER ANALYSIS IN MULTIMEDIA
QUALITY ASSESSMENT
Ulrich Engelke, Yohann Pitrey, Patrick Le Callet
IRCCyN UMR no 6597 CNRS, Ecole Polytechnique de l’Universite de Nantes,
rue Christian Pauc, La Chantrerie, 44306 Nantes, France
ABSTRACT
In multimedia quality assessment, observer ratings are typi-cally averaged into mean opinion scores (MOS) to obtain a subjective ground truth for a set of stimuli. Valuable infor-mation about individual observer rating behaviour and inter-observer differences is lost during this process. Such infor-mation, however, can be useful to improve subjective exper-iment procedures and quality of experience prediction mod-els. In this paper, we therefore present an inter-observer anal-ysis framework that tackles the quality assessment problem from an inverse angle, setting the focus on individual observer differences rather than stimuli differences. The framework consists of a set of procedures for inter-observer analysis as well as the necessary considerations during pre-processing and post-processing. The aim of this paper is to raise aware-ness that sole consideration of MOS simplifies quality assess-ment too much, especially given the ever increasing complex-ity of multimedia qualcomplex-ity assessment.
Index Terms— Inter-observer differences, multimedia
quality assessment, inter-rater coefficients, data mining. 1. INTRODUCTION
Quality of Experience (QoE) has been of major concern for multimedia service providers in recent years to complement more traditional paradigms such as Quality of Service (QoS) [1]. The objective is a transition from an application-centered to an user-centered delivery of multimedia services with the main goal being the satisfaction of the users’ experience. This task has been considerably complicated through recent ad-vances in coding and networking technology that facilitated ubiquitous usage of a broad range of multimedia applications on a variety of digital devices, ranging from mobile phones over laptop computers to high definition television in the home. For multimedia service providers it is crucial to automatically measure the QoE provided to satisfy the consumers’ expecta-tions. Hence, a considerable research effort has been devoted to the development of models that predict human quality per-ception. However, despite the increased complexity of mul-timedia quality assessment, subjective experiment outcomes are still reduced to an average vote over all participants, the
0 1 2 3 4 5 6 0 0.2 0.4 0.6 0.8 1 σ Normalised distribution Gaussian blur Fast fading
Fig. 1. Normalised distributions of standard deviations σ for images distorted through Gaussian blur or fast fasting [2]. mean opinion score (MOS). The agreement between partici-pants is measured using confidence intervals (CI) and related quantities, such as the standard error of the mean.
The use of MOS and CI may have sufficed in the context of ’simple’ assessment tasks, such as in the evaluation of con-tent with single, additive distortions. However, contemporary multimedia applications constitute a considerably more com-plex scenario, as a multitude of factors impact on the quality, including, source coding, error-prone networks, error con-cealment, re-scaling, and display devices. With such an in-creased complexity of the assessment task, the disagreement between observers may increase. This is illustrated in Fig. 1. Here, normalised distributions of standard deviations over all observers are shown for all Gaussian blur and fast fading dis-torted images in the LIVE image quality database [2]. It can be seen, that generally the observer agreement is considerably higher for the Gaussian blur distorted images, as indicated by the lower standard deviations. This can be attributed to the comparably simpler assessment task as the fast fading dis-torted images exhibit more complex distortion patterns. Not only system related factors, however, but also other internal (subjective) and external (environmental) factors have been found to contribute to observer disagreement. In [3], for in-stance, it was shown that the confidence of human observers into their quality ratings is inversely related to the CI. Differ-ent internal and external factors have been profiled in [4] in the context of audiovisual 3D perception, revealing individ-ual qindivid-uality preferences with respect to certain modalities.
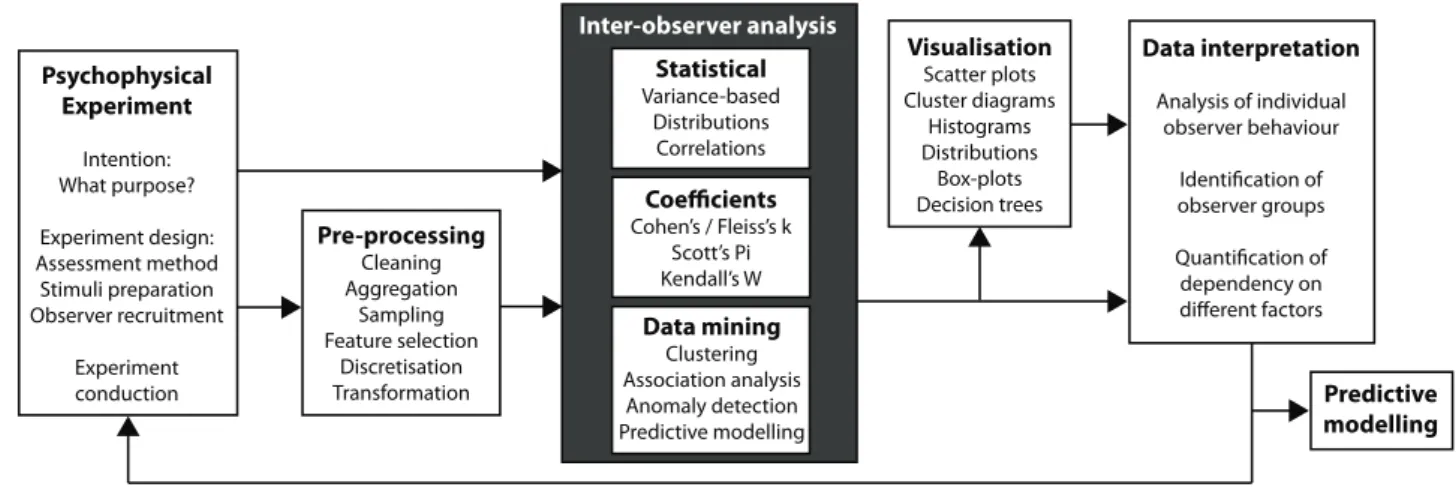
Psychophysical Experiment Intention: What purpose? Experiment design: Assessment method Stimuli preparation Observer recruitment Experiment conduction Pre-processing Cleaning Aggregation Sampling Feature selection Discretisation Transformation Inter-observer analysis Visualisation Scatter plots Cluster diagrams Histograms Distributions Box-plots Decision trees Data interpretation Analysis of individual observer behaviour Identification of observer groups Quantification of dependency on different factors Statistical Variance-based Distributions Correlations Coefficients Cohen’s / Fleiss’s k Scott’s Pi Kendall’s W Data mining Clustering Association analysis Anomaly detection Predictive modelling Predictive modelling
Fig. 2. Framework for inter-observer analysis in multimedia quality assessment.
is crucial to go beyond considerations of simple MOS and to gain a better understanding of individual observer perception in the context of multimedia services. The importance of eval-uating human observer differences has already been recog-nised in other research disciplines, especially in medical anal-ysis [5]. Not just the disagreement between observers as such needs to be quantified (as is done with CI) but more insight into rating behaviour needs to be obtained by analysing indi-vidual observers and by determining possible observer groups that exhibit similar behaviour. To identify whether differences are due to internal factors (e.g. personal preferences) or exter-nal factors (such as environmental influences or artifacts in the experimental design) is one goal of inter-observer analy-sis. This in turn is instrumental to improve psychophysical ex-periment procedures and to design elaborate QoE prediction models that more adequately reflect the complexity of mod-ern multimedia applications. To this end, conventional psy-chophysical assessment strategies and data analysis method-ologies deployed by the multimedia quality assessment com-munity may need to be revisited and additional, unconven-tional procedures need to be established.
1.1. Towards a framework of inter-observer analysis To address the above issues, we present in this paper a frame-work for assessment of inter-observer variability. The ob-jectives in this context are twofold. Firstly, we aim to raise awareness that inter-observer differences should not be ne-glected in multimedia quality assessment. This is particularly true in case of multimodal assessment and for novel applica-tions such as 3D video, where observer differences are ex-pected to be large. Secondly, we propose a set of existing and novel techniques to measure inter-observer variations and ap-ply them in a multimedia quality assessment context.
The integral parts of the framework are presented in Fig. 2 and are discussed in detail in this paper. Generally, the frame-work can be divided into three parts; preparation, inter-observer
analysis, and data exploitation. To take full advantage of the framework, special considerations should already take place during the psychophysical experiment and the pre-processing of the data. These preparatory issues are explained in Section 2. The focus of this paper is on the heart of the framework, the inter-observer analysis. We consider three different means to quantify inter-observer differences; statistics, inter-rater coef-ficients, and data mining [6], which are discussed in detail in Section 3. The subsequent visualisation and interpretation of the results is essential for a thorough exploitation and com-prehension of the inter-observer analysis and is briefly dis-cussed in Section 4, along with some implications on experi-mental design and predictive modelling. Finally, conclusions are drawn and future directions are given in Section 5.
The ultimate goal of the framework is to answer many im-portant questions, including: What are the underlying causes of observer differences? To what degree do they depend on internal and external factors, as well as the experimental de-sign? Can random variations be distinguished from system-atic variations? Are there particular observer groups that can be identified? Can individual observer differences or observer groups be incorporated into predictive quality models to im-prove their performance? It should be noted that the current state of the framework is by no means considered to be com-plete. The purpose is rather to initiate re-consideration of conventional quality assessment, discuss representative can-didate methodologies for inter-observer assessment, and to pose open questions that need more attention.
2. PREPARATION
This section discusses special considerations that should be taken into account in the conduction of the experiment and the data pre-processing to maximise the outcomes of the inter-observer analysis. A 3D quality experiment [7] is briefly in-troduced that is used throughout the paper as a means to better illustrate the different aspects of the framework.
2.1. Psychophysical experiments
Although analysis of inter-observer differences is of great in-terest for any existing experiment data, one may in fact take it particularly into account already during preparation of fu-ture experiments. This applies to all aspects of experiment design and especially to the stimuli preparation, observer re-cruitment, and the assessment methodology.
The presented stimuli are usually selected with the aim to determine system performance by carefully choosing param-eters from a realistic parameter space. Similar considerations can be applied to identify observer differences, where content classes can be carefully chosen such as to identify personal preferences or distortions can be introduced such as to iden-tify thresholds with respect to certain modalities.
The recruitment of observers does not necessarily need to be solely based on the discrimination between experts and non-experts, as is often done. To identify differences in rat-ing behaviour between observers, one may consider further demographic data and observer profiles as a criterion for ob-server recruitment. For instance, recruitment of obob-servers who have a 3D television and observers who do not may aid in identifying whether there is a difference in the comfort that these observer groups experience when viewing 3D content.
Depending on the application and the intended purpose, data should be recorded during the experiment in addition to the quality ratings. For instance, to identify observer confi-dence, additional confidence scores and response times have been recorded in [3]. To assess the comfort during 3D video viewing, additional comfort scores were collected in [7]. Such complementary information aids to gain a deeper insight into the rating behaviour and the perception of the presented stim-uli. Questionnaires handed out before and after the experi-ment can further provide valuable information.
In summary, the increasing complexity of quality assess-ment in contemporary multimedia applications needs to be reflected already during the conduction of the experiment.
2.1.1. 3D video quality experiment
The outcomes of a 3D video quality experiment are used here to illustrate the concepts of the framework. Details of the experiment can be found in [7] and are summarised in the following. The experiment was conducted in two laborato-ries in France and Sweden, however, in this paper we con-sider only the former experiment. Eleven different 3D video sources (SRC) were used along with 15 hypothetical refer-ence circuits (HRC) to create a total of 165 processed video sequences (PVS). The HRCs consisted of a number of differ-ent coding scenarios, including multi view coding and H.264 simulcast, to identify their impact onto perceived quality. The videos were viewed by 22 naive observers. In addition to the quality scores, comfort scores were collected to measure the degree of discomfort due to the 3D experience. Both scores were rated on a 5-point absolute category rating (ACR) scale.
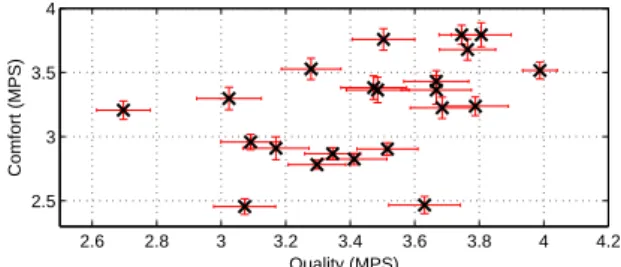
2.6 2.8 3 3.2 3.4 3.6 3.8 4 4.2 2.5 3 3.5 4 Quality (MPS) Comfort (MPS)
Fig. 3. Quality and comfort MPS including error bars.
2.2. Pre-processing
Pre-processing typically involves detection of observers that exhibit a considerably different rating behaviour compared to the majority of the observer population. These outliers are often removed according to certain criteria such as the ones specified by VQEG [8]. To identify the causes of the dis-agreement rather than directly rejecting these observers is one goal of the inter-observer framework.
Inter-observer analysis based on data mining techniques, as discussed in Section 3.3, needs particularly careful pre-processing to prepare the data with the aim to improve the quality of the outcome [6]. For instance, dimensionality re-duction using principal component analysis (PCA) based meth-ods can be used on high dimensional data to improve compre-hension of the results. Furthermore, discretisation of continu-ous scale data is usually needed for classification algorithms. To identify certain patterns it can further aid to transform the data into a more suitable format or representation before de-ploying the data mining algorithm.
3. INTER-OBSERVER ANALYSIS
In this framework we consider three means of inter-observer analysis, statistics, inter-rater coefficients, and data mining techniques, which are explained in the following sections. 3.1. Statistics
Simple statistics such as the mean, standard deviation, skew-ness, and kurtosis are usually computed over the observer population to quantify the characteristics of the ratings for particular PVS or HRC. Inversely, these simple statistics can be utilised to quantify rating behaviour of each observer over the presented stimuli. Figure 3 shows the mean PVS scores (MPS) for of the comfort versus quality scores for all 22 par-ticipants. It can be clearly seen that there is a wide range of different average quality and comfort ratings. To identify whether this ’bias’ is due to the observers’ different percep-tion of the PVS, due to systematic error in the experiment design, or simply by chance is of great importance.
The scatter plot in Fig. 3 gives an overview of the av-eraged differences amongst the observers, however, it does
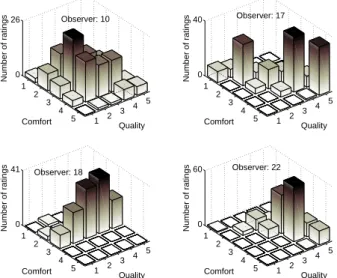
1 2 3 4 5 1 2 3 4 5 0 26 Quality Observer: 10 Comfort Number of ratings 1 2 3 4 5 1 2 3 4 5 0 40 Quality Observer: 17 Comfort Number of ratings 1 2 3 4 5 1 2 3 4 5 0 41 Quality Observer: 18 Comfort Number of ratings 1 2 3 4 5 1 2 3 4 5 0 60 Quality Observer: 22 Comfort Number of ratings
Fig. 4. Co-joint quality and comfort ratings for 4 observers.
not provide detailed information regarding the differences in rating behaviour. These differences are better accounted for in statistics that consider the distribution of the scores, such as the histograms of the co-occurrences of quality and com-fort scores illustrated in Fig. 4. Here, one can clearly identify considerable differences in rating behaviour between the four observers. Whereas observer 10 uses both scores in different combinations, observer 17 tends to give the same scores for a particular PVS, meaning, the scores are highly correlated. Observer 18, on the other hand uses a wide range of qual-ity scores but utilises mainly the middle of the comfort scale. Observer 22 focuses mainly on a very narrow range for both scores. These differences in rating behaviour should not be ignored and their underlying cause needs to be investigated.
The difference between any two observers can be quan-tified using correlations, such as the Pearson linear correla-tion coefficient illustrated in Fig. 5. The upper figure shows the correlations between all observers for the quality scores (above diagonal) and the comfort scores (below diagonal). The correlations are generally higher for the quality scores, which is supported by the marginal distributions in the lower plot. The lower agreement on comfort can have multiple rea-sons, including, more difficulty in rating or larger differences in perception, maybe due to the novelty of 3D applications.
In [9] it is argued that correlation is different from agree-ment and thus, should not be used to measure inter-observer agreement. This argument is supported by the simple exam-ple in Fig. 6. Here, the diagonal represents perfect correlation and perfect agreement. The solid dots, however, represent perfect correlation but poor agreement, due to the distance of the dots from the diagonal. The circles, on the other hand, represent high agreement but zero correlation.
Typically, analysis of variance (ANOVA) is used to mea-sure whether or not differences amongst two or more factors
Observer number 1 3 5 7 9 11 13 15 17 19 21 0 0.2 0.4 0.6 0.8 1 1 2 3 4 5 6 7 8 9 10 11 12 13 14 15 16 17 18 19 20 21 22 0 0.5 1 Observer number Mean correlation Quality Comfort
Fig. 5. Inter-observer correlations for quality scores (above diagonal) and comfort scores (below diagonal) and their marginal distributions. 0 2 4 6 8 10 0 2 4 6 8 10 Observer 1 Observer 2
Perfect correlation, low agreement High agreement, zero correlation
Fig. 6. Difference between correlation and agreement [9].
are significant. However, in [9] it is argued that ANOVA makes two assumptions that not necessarily hold in analysing observer disagreement. Firstly, ANOVA assumes that ob-servers have the same error variance and, secondly, it assumes that correlations between any two observer pairs are the same throughout the population. Especially the latter assumption is particularly questionable in case of subjective experiments with non-expert observers.
Given the above, so called inter-rater coefficients that are widely used in medical research and decision making could constitute a more suitable measure of inter-observer analysis.
3.2. Inter-rater coefficients
Inter-rater coefficients take into account that a certain amount of agreement between observers is due to chance alone [5]. As such, they aim to measure the true disagreement by iden-tifying and segregating the chance agreement. Early coeffi-cients include Kendall’s W [10] and Scott’s Pi [11]. Cohen’s
κ [12], probably the most widely used inter-rater coefficient,
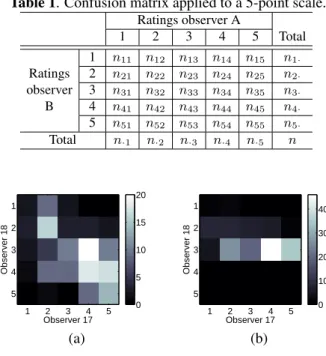
ob-Table 1. Confusion matrix applied to a 5-point scale. Ratings observer A 1 2 3 4 5 Total 1 n11 n12 n13 n14 n15 n1· Ratings 2 n21 n22 n23 n24 n25 n2· observer 3 n31 n32 n33 n34 n35 n3· B 4 n41 n42 n43 n44 n45 n4· 5 n51 n52 n53 n54 n55 n5· Total n·1 n·2 n·3 n·4 n·5 n Observer 17 Observer 18 1 2 3 4 5 1 2 3 4 5 0 5 10 15 20 (a) Observer 17 Observer 18 1 2 3 4 5 1 2 3 4 5 0 10 20 30 40 (b)
Fig. 7. Confusion matrices between observers 17 and 18 for (a) quality and (b) comfort scores.
servers have the same rating distributions. Fleiss’ κ [13] is an extension of Cohen’s κ from two to multiple observers.
Cohen’s κ is essentially based on a confusion matrix be-tween two observers, which is given in Table 1 for a 5-point scale. For illustration, the confusion matrices between ob-servers 17 and 18 are given in Fig. 7 for quality and comfort scores. One can see that the agreement between the two ob-servers is higher for the quality scores, as indicated by the high magnitudes around the diagonal.
The κ coefficient is computed as
κ = po− pe 1− pe = 1 n ∑5 i=1nii−n12 ∑5 i=1ni·n·i 1− 1 n2 ∑5 i=1ni·n·i (1)
with po and pe denoting the observed and expected
agree-ment, respectively. In [14] it is stated that the conventional κ is only suitable for nominal data and is inappropriate for or-dinal data, such as given with oror-dinal scales in quality assess-ment. The reason being, that in ordinal scales there are dif-ferent levels of disagreement and, hence, a weighted κ is rec-ommended that penalises disagreements in correspondence to their severeness as follows
κw= 1 n ∑5 i=1 ∑5 j=1wijnij−n12 ∑5 i=1 ∑5 j=1wijni·n·i 1− 1 n2 ∑5 i=1 ∑5 j=1wijni·n·i . (2) Note that the unweighted κ is a special case of the weighted
κ with wij = 1 for i = j and wij= 0 for i̸= j. Here, we use
linear weights wij = 1− 0.25|i − j|.
Observer number Observer number 1 3 5 7 9 11 13 15 17 19 21 1 3 5 7 9 11 13 15 17 19 21 0 0.2 0.4 0.6 0.8 1
Fig. 8. Cohen’s weighted κw between observers for quality
scores (above diagonal) and comfort scores (below diagonal).
Both the weighted and unweighted κ are measured on a scale from -1 to 1, with 1 indicating perfect agreement and 0 meaning agreement by chance. Values below zero indicate agreement less than chance and are very rare. To improve interpretation of κ, an ordinal scale was introduced in [15] as follows: ≤0 = poor, 0.01-0.2 = slight, 0.21-0.4 = fair, 0.41-0.6 = moderate, 0.41-0.61-0.8 = substantial, and 0.81-1 = almost perfect. However, the authors themselves admitted that the choice of ranges and labels was somewhat arbitrary, for which reason we do not consider them here.
In Fig. 8, Cohen’s weighted κw between all observers
is presented for the quality scores (above diagonal) and the comfort scores (below diagonal). The red crosses addition-ally mark the κw where the null hypothesis that agreement
is accidental is accepted (based on a p value of 0.05). It can be seen that the κware generally lower and the chance
agree-ment is higher for the comfort scores as compared to the qual-ity scores. It is further apparent, that observer 22 not only ex-hibits chance agreement with the majority of observers for the comfort scores, but also for the quality scores. This disagree-ment is also indicated in the correlations (see Fig. 5), however, its severeness is more apparent using the κwcoefficient.
3.3. Data mining
Within this framework, data mining techniques are instrumen-tal to identify patterns in the experiment data and to determine possible observer groups. These techniques are particularly useful in cases where an extensive amount of data is avail-able and when the dimensionality of the assessment task ex-ceeds easy comprehension of the results. Furthermore, pow-erful and freely available data mining software, such as the Waikato Environment for Knowledge Analysis (WEKA) [16] or RapidMiner [17], allow for straightforward application of a wide range of data mining algorithms. In [6], data mining techniques are generally separated into four categories, each of which finds their application within inter-observer analysis.
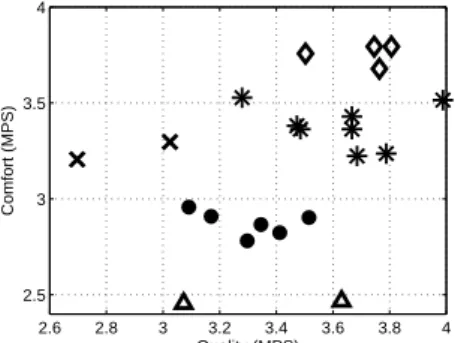
2.6 2.8 3 3.2 3.4 3.6 3.8 4 2.5 3 3.5 4 Quality (MPS) Comfort (MPS)
Fig. 9. Clustering using EM and 5 clusters.
Clustering[18] is considered to be particularly useful to identify user groups with respect to one or multiple different attributes. A range of different algorithms [19], such as k-means, expectation maximisation (EM), and support vector machines, provide powerful tools to identify these patterns. We applied EM clustering with 5 clusters to the MPS pre-sented in Fig.3. The results are prepre-sented in in Fig. 9 with different markers indicating the association of a data point to a cluster. It can be seen, that 5 clusters are created by the EM algorithm, however, the separation between clusters is not al-ways very distinct. Considerations of inter-observer analysis already during the quality experiment (see Section 2.1) may improve cluster separation.
Association analysiscan be used to discover strongly as-sociated attributes in the data, which is particularly useful for experiment data where a large number of different factors are considered. Implementations such as the Apriori algorithm facilitate efficient extraction of patterns in such high dimen-sional experiment data.
Anomaly detectiondevotes itself to the identification of data that is significantly different from the rest of the data and is thus particularly useful for outlier detection. Various techniques utilising proximity, density, or clustering-based al-gorithms cover outlier detection for low to high dimensional experiment data.
Predictive modellingis useful to infer models from the experiment data using classification (e.g. decision trees) or regression-based methods for discrete and continuous data, respectively. Typically, predictive modelling is conducted us-ing the MOS, however, more detailed information about in-dividual observer ratings may help to derive models that take into account the complexity of multimedia QoE assessment.
In general, data mining provides powerful tools for inter-observer analysis. However, a careful selection of suitable al-gorithms along with a thorough parameterisation are essential to maximise the usefulness of the output. The pre-processing of the data, as discussed in Section 2.2, is crucial to maximise the performance of the data mining algorithms. Strong inte-gration of data mining techniques into inter-observer analysis is an ultimate objective of the proposed framework.
4. DATA EXPLOITATION
As with conventional quality assessment, appropriate visu-alisation of the analysis outcomes is essential for compre-hension of the results with respect to the intended goals of the experiment. In case of inter-observer analysis the focus should thus be on emphasising the differences amongst ob-servers rather than different PVS. An appropriate visualisa-tion is the first step towards successful data interpretavisualisa-tion and in fact, in some cases visualisation alone can help to identify patterns in the data (often referred to as visual data mining). In case of high-dimensional data, a technique called online analytical processing (OLAP) [6] is particularly useful as it aggregates data to aid subsequent analysis. Several of these visualisation techniques have been discussed in this paper, a more comprehensive selection is given in [6].
Interpreting the data and making sense of it is possibly the most difficult part of the framework. From the discussion thus far it is obvious that there are indeed strong differences between observers in terms of bias and rating patterns. How-ever, to identify what exactly these differences stem from (in-ternal versus ex(in-ternal factors, systematic versus random dif-ferences, ...) is a highly difficult task and in fact, the authors believe that data interpretation would benefit from a careful deployment of the entire framework, starting with the experi-mental design.
Thoroughly interpreted inter-observer analysis outcomes are expected to be beneficial towards the improvement of sub-jective experiment procedures as well as for the improvement of QoE prediction models. For instance, in [7] it was found that there was a bias between the scores that were given in the two experiments, which could be caused by differences in the conduction of the experiment. However, they could also be due to cultural differences between the French and Swedish participants or other factors that yet need to be identified.
5. CONCLUSIONS
We propose a framework of inter-observer variability anal-ysis in the context of multimedia quality assessment. The paper serves to both, raise awareness to the importance of inter-observer analysis and to provide representative tools to conduct it. The different parts of the framework have been discussed in relation to a 3D video quality experiment. A considerable number of references is provided as a roadmap for the reader to further explore the discussed framework.
The results presented here are only a first step towards a more complete framework and many aspects are yet to be investigated. For instance, other inter-observer coefficients need to be investigated, including bivariate coefficients [20] that simultaneously account for two variables (here: quality and comfort). Also, the range of available data mining tech-niques is vast and yet to be explored to fully exploit their power in identifying patterns in the data. The authors also
plan to extend the framework to other domains, such as to the identification in observer differences of gaze patterns recorded through eye tracking [21]. Finally, the framework is planned to be applied to exhaustive data sets (such as the VQEG com-mon set) and a dedicated experiment is planned taking the ob-jective of inter-observer analysis into account already during the design of the procedures.
6. REFERENCES
[1] D. Soldani, M. Li and R. Cuny (Ed.), QoS and QoE
Manage-ment in UMTS Cellular Systems, John Wiley & Sons, 2006.
[2] H. R. Sheikh, Z. Wang, L. Cormack, and A. C. Bovik, “LIVE image quality assessment database release 2,” http://live.ece.utexas.edu/research/quality, 2005.
[3] U. Engelke, A. J. Maeder, and H.-J. Zepernick, “On confidence and response times of human observers in subjective image quality assessment,” in Proc. of IEEE Int. Conf. on Multimedia
and Expo, June 2009, pp. 910–913.
[4] D. Strohmeier, S. Jumisko-Pyykk¨o, and U. Reiter, “Profiling experienced quality factors of audiovisual 3D perception,” in
Proc. of Int. Workshop on Quality of Multimedia Experience,
June 2010, pp. 70–75.
[5] M. Banerjee, M. Capozzoli, L. McSweeney, and D. Sinha, “Beyond kappa: A review of interrater agreement measures,”
The Canadian Journal of Statistics, vol. 27, no. 1, pp. 3–23,
Mar. 1999.
[6] P. N. Tan, M. Steinbach, and V. Kumar, Introduction to Data
Mining, Addison Wesley, 2006.
[7] K. Wang, M. Barkowsky, R. Cousseau, K. Brunnstr¨om, R. Ols-son, P. Le Callet, and M. Sj¨ostr¨om, “Subjective evaluation of HDTV stereoscopic videos in IPTV scenarios using absolute category rating,” in Proc. of IS&T/SPIE Stereoscopic Displays
and Applications XXII, Jan. 2011, vol. 7863.
[8] Video Quality Experts Group, “Final report from the Video Quality Experts Group on the validation of objective models of multimedia quality assessment, phase I,” VQEG, Sept. 2008. [9] M. Haber and H. X. Barnhart, “Coefficients of agreement for
fixed observers,” Statistical Methods in Medical Research, vol. 15, no. 3, pp. 255–271, June 2006.
[10] M. G. Kendall and B. Babington Smith, “The problem of m rankings,” The Annals of Mathematical Statistics, vol. 10, no. 3, pp. 275–287, Sept. 1939.
[11] W. Scott, “Reliability of content analysis: The case of nominal scale coding,” Public Opinion Quarterly, vol. 19, no. 3, pp. 321–325, 1955.
[12] J. Cohen, “A coefficient of agreement for nominal scales,”
Ed-ucational and Psychological Measurement, vol. 20, no. 1, pp.
37–46, Apr. 1960.
[13] J. L. Fleiss, “Measuring nominal scale agreement among many raters,” Psychological Bulletin, vol. 76, no. 5, pp. 378–382, 1971.
[14] J. Sim and C. C. Wright, “The kappa statistic in reliability stud-ies: Use, interpretation, and sample size requirements,”
Physi-cal Therapy, vol. 85, no. 3, pp. 257–268, Mar. 2005.
[15] J. R. Landis and G. G. Koch, “The measurement of observer agreement for categorical data,” Biometrics, vol. 33, no. 1, pp. 159–174, 1977.
[16] M. Hall, E. Frank, G. Holmes, B. Pfahringer, P. Reutemann, and I. H. Witten, “The WEKA data mining software: An up-date,” SIGKDD Explorations, vol. 11, no. 1, pp. 10–18, June 2009.
[17] Rapid-I GmbH, “RapidMiner,” http://rapid-i.com/content/view/181/190/, 2011.
[18] P. Berkhin, “A survey of clustering data mining techniques,” in Grouping Multidimensional Data, J Kogan, C. Nicholas, and M. Teboulle, Eds., pp. 25–71. Springer Berlin Heidelberg, 2006.
[19] X. Wu, V. Kumar, J. R. Quinlan, J. Ghosh, Q. Yang, H. Mo-toda, G. J. McLachlan, A. Ng, B. Liu, P. S. Yu, Z. H. Zhou, M. Steinbach, D. J. Hand, and D. Steinberg, “Top 10 algo-rithms in data mining,” Knowledge and Information Systems, vol. 14, no. 1, pp. 1–37, 2008.
[20] M. M. Shoukri and A. Donner, “Bivariate modeling of interob-server agreement coefficients,” Statistics in Medicine, vol. 28, no. 3, pp. 430–440, Feb. 2009.
[21] U. Engelke, A. Maeder, and H.-J. Zepernick, “Analysing inter-observer saliency variations in task-free viewing of natural im-ages,” in Proc. of IEEE Int. Conf. on Image Processing, Sept. 2010.
![Fig. 1. Normalised distributions of standard deviations σ for images distorted through Gaussian blur or fast fasting [2].](https://thumb-eu.123doks.com/thumbv2/123doknet/8306192.279880/2.892.494.801.350.495/normalised-distributions-standard-deviations-images-distorted-gaussian-fasting.webp)