HAL Id: hal-01664515
https://hal.archives-ouvertes.fr/hal-01664515
Submitted on 14 Dec 2017
HAL is a multi-disciplinary open access
archive for the deposit and dissemination of
sci-entific research documents, whether they are
pub-lished or not. The documents may come from
teaching and research institutions in France or
abroad, or from public or private research centers.
L’archive ouverte pluridisciplinaire HAL, est
destinée au dépôt et à la diffusion de documents
scientifiques de niveau recherche, publiés ou non,
émanant des établissements d’enseignement et de
recherche français ou étrangers, des laboratoires
publics ou privés.
Toward a Holistic Framework for Conducting Scientific
Evaluations of OpenStack
Ronan-Alexandre Cherrueau, Dimitri Pertin, Anthony Simonet, Adrien Lebre,
Matthieu Simonin
To cite this version:
Ronan-Alexandre Cherrueau, Dimitri Pertin, Anthony Simonet, Adrien Lebre, Matthieu Simonin.
To-ward a Holistic Framework for Conducting Scientific Evaluations of OpenStack. The 17th IEEE/ACM
International Symposium on Cluster, Cloud and Grid Computing (CCGRID), May 2017, Madrid,
Spain. pp.544-548, �10.1109/CCGRID.2017.87�. �hal-01664515�
Toward a Holistic Framework for Conducting
Scientific Evaluations of OpenStack
Ronan-Alexandre Cherrueau, Dimitri Pertin, Anthony Simonet, Adrien Lebre Inria, Mines Nantes, LINA
Nantes, France Email: [email protected] Matthieu Simonin Inria, IRISA Rennes, France Email: [email protected]
Abstract—By massively adopting OpenStack for operat-ing small to large private and public clouds, the industry has made it one of the largest running software project, overgrowing the Linux kernel. However, with success comes increased complexity; facing technical and scientific chal-lenges, developers are in great difficulty when testing the impact of individual changes on the performance of such a large codebase, which will likely slow down the evolution of OpenStack. Thus, we claim it is now time for the scientific community to join the effort and get involved in the development of OpenStack, like it has been once done for Linux.
In this spirit, we developed Enos, an integrated frame-work that relies on container technologies for deploying and evaluating OpenStack on any testbed. Enos allows researchers to easily express different configurations, en-abling fine-grained investigations of OpenStack services. Enos collects performance metrics at runtime and stores them for post-mortem analysis and sharing. The relevance of the Enos approach to reproducible research is illus-trated by evaluating different OpenStack scenarios on the Grid’5000 testbed.
I. INTRODUCTION
Although the adoption of Cloud Computing has been largely favored by public offers (Amazon EC2 and Microsoft Azure, to name a few), numerous private and public institutions have been contributing to the devel-opment of open-source projects in charge of delivering Cloud Computing management systems [1]–[3]. In addi-tion to breaking vendor lock-in, these operating systems of Cloud Computing platforms enable administrators to deploy and operate private cloud offers, avoiding issues such as data-jurisdiction disputes, latency constraints, etc.
After more than six years of intensive effort, the OpenStack software suite has become the de facto open-source solution to operate, supervise and use a Cloud Computing infrastructure [3]. Despite its dynamism that makes whole ecosystem incredibly hard to keep up with, OpenStack has been adopted in a large variety of areas such as public administrations, e-commerce and science1. Its undeniable success and spread urges the
1See http://superuser.openstack.org/ for further information
scientific community to get involved and contribute to the OpenStack software in the same way it has been once done for the Linux ecosystem. A major involvement of our community would enable OpenStack to better cope with ongoing changes in Cloud Computing, such as Fog and Edge Computing and IoT applications.
To help developers and researchers identify major weaknesses of a complex system such as OpenStack and to facilitate the evaluation of proposed improvements, we designed Enos.2 Leveraging container technologies
and “off-the-shelf” benchmarks, Enos is the first holistic framework for evaluating OpenStack in a flexible and reproducible way. Its Experimentation-as-Code vision allows to automate every step of the experimentation workflow, from the configuration to the results gather-ing and analysis. In addition, because each service is isolated in a single container, Enos is able to express and deploy complex scenarios, and to evaluate each service individually.
Moreover, Enos has been designed around pluggable mechanisms that allow researchers and developers to evaluate OpenStack on various infrastructures (testbed platforms, public and private clouds, all-in-one Virtual Machines), and execute any benchmarking suite in ad-dition to Rally [4] and Shaker [5] that are supported by default.
Finally, Enos comes with visualization tools that pro-vide multiple synthetic views of the gathered metrics suitable for explanatory and exploratory experiments.
In this paper, we give a first overview of the Enos sys-tem. The structure of the article is as follows. Section II presents the different technologies we used to build the Enos framework. The framework itself is discussed in Section III. To illustrate the possibility offered by our framework, we discuss a first series of experiments that have been conducted thanks to Enos in Section IV. Fi-nally Section V concludes and discusses future research and development actions.
II. BACKGROUND
OpenStack [3] is an open-source project that aims to develop a complete Cloud Computing software stack though the three expected capabilities of IaaS platforms: Compute (run by Nova), Network (Neutron) and Stor-age (Cinder, Glance and Swift). Services are organized following the Shared Nothing principle. This enables a weak coupling between services, allowing a large number of deployment possibilities.
To limit the effort in terms of development, Enos has been built on top of different technologies that are presented in the following.
A. Kolla and Ansible
Due to the richness and complexity of the OpenStack ecosystem, making the deployment of OpenStack easy has always been an important topic. Among all the deployment solutions that are available, we chose to use Kolla [6]. Kolla provides production ready containers and deployment tools for operating OpenStack infras-tructures. In Kolla, each OpenStack service is encap-sulated with its dependencies in a dedicated container. Container images can be built on demand, stored and used during the deployment. Kolla features many default behaviors, allowing quick prototyping, but they are fully customizable: vanilla or modified versions of OpenStack can be installed, deployment topologies can be adapted to the user’s needs and configuration of all the services can be changed. To perform remote actions such as deploying software components, Kolla uses the Ansible deployment engine [7]. Ansible gathers hosts on groups of machines on which specific tasks are applied. This group mechanism in play is very flexible and thus allows alternative deployment topologies to be specified. B. Rally and Shaker
Measuring the performance of a cloud infrastructure in a rigorous and comparable way is an important challenge for our community. Enos comes with two open source benchmarks by default: Rally and Shaker.
1) Rally: Rally is the official control-plane bench-mark suite for OpenStack; it injects API requests to running services. Extensive benchmarks are allowed by two concepts : the Runner (e.g., the number of times a request is performed or how many parallel threads are used to perform the requests), the Context (e.g., how many users and tenants must be used for the injection)
2) Shaker: Shaker is a framework for data plane test-ing of OpenStack. It currently targets synthetic bench-marks execution (for instance iperf3 [8], flent [9]) on top of instances. Shaker supports the definition and the de-ployment of different instances and network topologies. The possible scenarios include extensive evaluation of network capabilities of an OpenStack cloud.
C. cAdvisor, Collecd and other analysis tools
Analysis of OpenStack is mostly based on metrics generated during the experiments and relies on three components: metrics agents, a metrics collector and a metrics visualization service. Those components are loosely coupled, allowing for alternatives to be plugged in when necessary. In the current implementation, met-ric agents are cAdvisor [10] and collectd [11]. They are responsible for sending metrics from hosts to the collector. Metrics can be enabled or disabled at will through the metrics agents configuration files. The Met-rics collector relies on the InfluxDB timeseries optimized database [12]. Finally, the visualization is delivered by Grafana [13], a dashboard composer.
III. ENOS
Evaluating the OpenStack software suite can be di-vided into four logical phases. The first phase consists in getting raw resources; the second one deploys and ini-tializes the selected version of OpenStack over these re-sources; the third invokes the benchmarks to be executed; finally, the fourth analyzes results of the evaluation. To help in tackling all these phases, we developed Enos3, a
holistic approach for the evaluation of OpenStack. After presenting the resource description language that has been designed to configure Enos, this section describes how each phase has been implemented. In particular, how Enos can address performance evaluations for any infrastructure by abstracting fundamental principles of each phase.
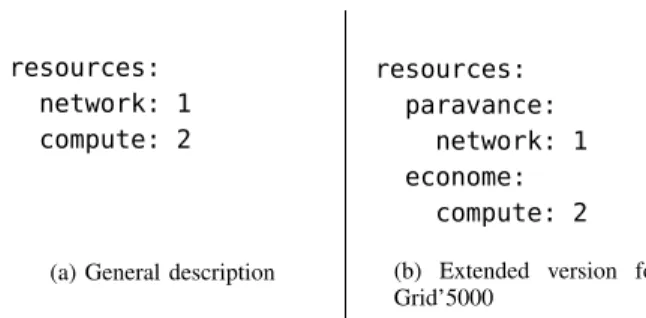
A. Enos Description Language for Flexible Topologies The description of the resources to acquire as well as the mapping of the different services on top of those resources is made with a YAML resource description lan-guage. This language offers a very flexible mechanism that lets Enos end-users specify and evaluate OpenStack performance over a large set of topologies. However, OpenStack is made of numerous services and writing this description is tedious. For this reason, Enos reuses Kolla service groups to gather many OpenStack services under the same logical name, which drastically reduces the description size. For instance, the small description in Figure 1(a) describes a simple deployment topology. This description says: “provide one resource for hosting network services and two others for hosting compute services”.
In the context of Enos, a resource is anything running a Docker daemon and that Enos can SSH to. This could be a bare-metal machine, a virtual machine, or a container resource according to the testbed used for conducting the experiments.
resources: network: 1 compute: 2
(a) General description
resources: paravance:
network: 1 econome:
compute: 2
(b) Extended version for Grid’5000
Figure 1. Enos Resources Description Examples
Moreover, we emphasize that the language is resource provider dependent in order to handle infrastructure specificities. For instance, on Grid’5000 [14], the lan-guage has been extended to specify the name of physical clusters where resources should be acquired, as depicted in Figure 1(b). In this description, the paravance clus-ter (located in Rennes) will provide resources for the network services and the econome cluster (located in Nantes) will provide resources for the compute nodes.
Isolating a service on a dedicated resource is as simple as adding its name to the description. For instance, adding rabbitmq: 1 at the end of the description on Figure 1(a) tells Enos to acquire a dedicated resource for the AMQP bus. Henceforth, the bus will no longer be part of the network resource but deployed on a separate resource at the deployment phase. Obviously, it is possible to do the same for the database,nova-api,
glance,neutron-server. . .
Scaling a service simply requires to increase the num-ber of resources allocated to this service into the descrip-tion. For instance, increasing the value ofrabbitmq: 1
to rabbitmq: 3 tells Enos to acquire three dedicated resources for the AMQP bus. Henceforth, the deploy-ment phase will deploy a cluster composed of three RabbitMQ.
These two characteristics of the language allow a very flexible mechanism to both isolate and scale services. B. Enos Workflow
The following describes the four steps that are achieved by Enos.
1) Getting Resources Phase: Calling enos up
launches the first phase that acquires the resources necessary for the deployment of OpenStack. To get these resources, Enos relies on the aforementioned description and the notion of provider. A provider implements how to get resources on a specific infrastructure and thus makes this job abstract to Enos. With such mechanism, an operator can easily evaluate OpenStack over any kind of infrastructure by implementing the related provider. A provider can also be given by the support team of an infrastructure, independently of any particular
OpenStack evaluation project. In other words for each testbed, an extended version of the Enos DSL and a provider should be available. Currently, Enos supports two kinds of infrastructure; the first one gets bare-metal resources from the Grid’5000 testbed [14]; the second one uses a VM based on Vagrant [15]. We emphasize that additional drivers for any other system can be easily implemented in less than 500 lines of Python code.
The output of the first phase is a list of addresses which reference resources, together with the name of the OpenStack services to deploy over each resource. This way, Enos will be able to initiate a SSH connection to these resources during the next phase and deploy the requested OpenStack services.
2) Deploying and Initializing OpenStack Phase: Call-ing enos init deploys and initializes OpenStack with Kolla. Concretely, Enos uses the list of resources and services provided by the previous phase and writes them into a file called the inventory file. Kolla then uses this file to deploy, in a containerized manner, OpenStack services on the correct resources.
The Kolla tool runs each OpenStack service in an isolated container which presents a huge advantage for collecting metrics such as CPU, memory, and network utilization. Indeed, in addition to isolation, container technologies offer fine-grained resource management and monitoring capabilities [16]. This means it is possi-ble to collect the current resource usage and performance information, whatever the container runs, through a standard API, and hence offers to Enos a generic metrics collection mechanism that stands for every OpenStack service. Under the hood, Enos relies on cAdvisor (II-C) to implement this generic collection mechanism.
3) Running Performance Evaluation Phase: Calling
enos benchinjects workloads to stress the platform. By default, Enos comes with Rally and Shaker frameworks. However, the Enos abstractions allow end-users to plug any custom benchmarks like for instance the recent SPEC Cloud Benchmark [17].
A workload in Enos is composed of scenarios that will be run in sequence. Each scenario description is specific to the underlying benchmarking tool but Enos will know how to run it. In the case of Shaker or Rally parameterized scenarios are possible adding more flexibility to the execution.
4) Analysing the Evaluation Phase: Calling
enos backup generates all components needed for the analyses of the performance evaluation.
Metrics gathering is twofold. First, Enos collects gen-eral metrics (CPU/memory usage, network utilization, opened sockets . . . ). Second, it is able to store specific statistics offered by the benchmarking suite used. The former relies on a set of agents whose role is to send metrics to a collector. The latter is specific to the
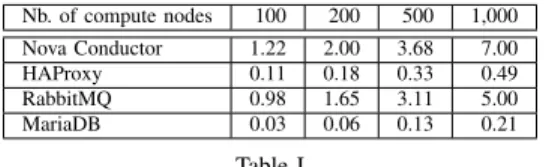
Nb. of compute nodes 100 200 500 1,000 Nova Conductor 1.22 2.00 3.68 7.00 HAProxy 0.11 0.18 0.33 0.49 RabbitMQ 0.98 1.65 3.11 5.00 MariaDB 0.03 0.06 0.13 0.21 Table I
AVERAGECPUUSAGE OFOPENSTACK SERVICES WHILE VARYING
THE NUMBER OF COMPUTE NODES(IN NUMBER OF CORES).
Nb. of compute nodes 100 200 500 1,000 Nova Conductor 2.47 2.47 2.45 2.47 HAProxy 6.27 6.32 7.04 8.71 RabbitMQ 1,628 2,580 5202 11,520 MariaDB 502 546 570 594 Table II
MAXIMUMRAMUSAGE OFOPENSTACK SERVICES WHILE
VARYING THE NUMBER OF COMPUTE NODES IN MEGABYTES.
benchmarking suite that is executed and occurs during the backup phase. Similarly to the previous section, integrating custom benchmarking tools may require ex-tending Enos to retrieve the relevant reports.
Enos allows general metrics to be observed in real-time during the experiment. Preconfigured dashboards are indeed accessible through a Web interface. Enos’s
backupgathers a larger source of information since they include configuration files, logs of OpenStack services, all the collected metrics and all the reports generated by the benchmarking suite used. Enos can then build a virtual machine image embedding all these data and tools to allow post-mortem exploration.
IV. EXPERIMENTS
To illustrate how operators and developers can use Enos to identify limiting services through the explo-ration of general metrics, we conducted a first series of evaluations to study how OpenStack behaves when the number of compute nodes scales up to 1,000. Experi-ments have been executed on the paravance cluster of the Grid’5000 [14] testbed.
We deploy an OpenStack cloud multiple times with Enos and vary the number of compute nodes from 100 to 1,000 between two deployments. The OpenStack code was based on the Mitaka release. The “fake driver” was chosen as virtualisation driver at the compute level to increase the density of compute nodes on a single physical machine. We achieve to deploy 1,000 nova-compute “fake driver” on 20 physical machines. Two other physical machines were used to host Control and Neutron groups respectively. The fake driver is an in-memory hypervisor that performs mostly the same routine tasks to maintain the state of its local –fake– instances except for neutron-server. The latter service is thus out of the scope of the current evaluation.
Nb. of compute nodes 100 200 500 1,000 RabbitMQ 1.5 2.93 6.89 13.5 MariaDB 79 85 120 170
Table III
MAXIMUM NUMBER OF SIMULTANEOUS OPEN CONNECTIONS FOR
OPENSTACK SERVICES WHILE VARYING THE NUMBER OF COMPUTE
NODES(THOUSANDS).
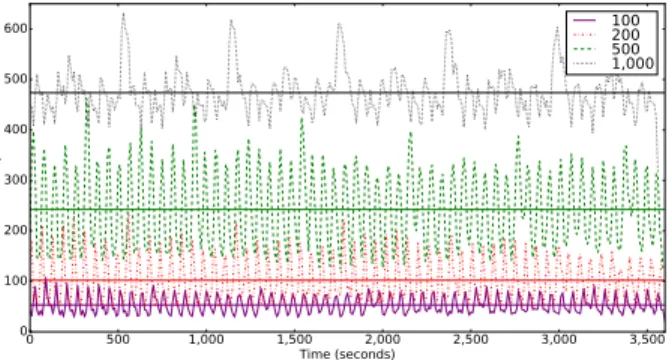
Metrics are collected for one hour without performing any request on the deployed system. Enos enables us to inspect these metrics per service. Table I and II present respectively the CPU and RAM consumption of representative services during this idle period. The observed CPU consumption is very small, except for the Nova Conductor service that interfaces all Nova services with the MariaDB database. This information is valuable for the OpenStack community as it clearly shows that there is room for improvement to reduce the consumption of the nova-conductor service (for 1,000 nodes, the current code requires the equivalent of 7 cores while the compute nodes are idle). For the RAM consumption, an important increase is observed for Rab-bitMQ that is heavily used for communications between services like nova-conductorandnova-compute. Ta-ble III presents the maximum number of connections for RabbitMQ and MariaDB. It clearly shows that the increased RAM usage is linked to network usage: the number of open connections on the RabbitMQ container grows indeed at the same rate as memory usage. More-over, the number of connections opened by RabbitMQ can be explained by the fact that, even in idle state, OpenStack is maintaining several permanent connections with each Nova and Neutron agents. This leads to the conclusion that RabbitMQ will be hard to scale beyond this limit without reviewing the communication patterns in use. To further explain this increase in resource usage, we export from Enos the number of database queries performed each second by MariaDB. The number of SELECT queries performed each second for the one-hour period is plotted in Figure 2. We observe that the average number of queries increases linearly with the number of nodes. More importantly, from the figure, we observe periodic spikes. These spikes are due to periodic tasks run by Nova services and Neutron agents. They are indeed reporting periodically their states in the database. UPDATE queries follow the same pattern but are not plotted here. Note that the reporting interval is configurable and may be decreased in the configuration file at the cost of decreasing the consistency of the state stored in the database.
This evaluation demonstrates how OpenStack can be studied with Enos as a black-box and how complex mechanisms involving multiple services can be explored.
0 500 1,000 1,500 2,000 2,500 3,000 3,500 Time (seconds) 0 100 200 300 400 500 600 SELECT queries 100 200 500 1,000
Figure 2. Number of SQL queries per second executed by MariaDB while varying the number of compute nodes. Horizontal lines show the average for each series.
V. CONCLUSION
With a community that gathers more than 5,000 people twice a year at the single location, the Open-Stack software suite has become the de facto open-source solution to operate, supervise and use Cloud Computing infrastructures. While it has been mainly supported by key companies such as IBM, RedHat and more recently Google, we claim that distributed com-puting scientists should now join the effort to help the OpenStack consortium address the numerous technical and scientific challenges related to its scalability and reliability. Similarly to what our scientific community has been doing for Linux, the OpenStack software suite should benefit from scientific guidance. However, diving into OpenStack and understanding its intricate internal mechanisms is a tedious and sometimes too expensive task for researchers.
To allow academics, and more generally the Open-Stack consortium to identify issues, propose counter-measures, and validate code improvements, we presented in this paper the Enos framework. Thanks to container technologies and the use of “off-the-shelf” benchmarks, Enos is the first holistic approach for evaluating Open-Stack in a controlled and reproducible way. We illus-trated the relevance of Enos by analyzing how Open-Stack behaves at different scales. This experiment helps in identifying services which will become bottlenecks (e.g., RabbitMQ,nova-conductor) with a large number of compute nodes.
We emphasize this work enabled us to exchange with the OpenStack Foundation and take part in different discussions/working groups. As an example, we are using Enos to conduct several experiments in the context of the OpenStack performance working group [18]. First, we are evaluating different message bus solutions that can replace the current RabbitMQ solution that does not scale well. Second, we are performing several experi-ments to identify network requireexperi-ments in the case of WAN infrastructures. Conducting these experiments is a
major concern for telcos that target the deployment of Fog and Edge Computing infrastructures.
As mid-term actions, we plan to extend Enos with the new OpenStack Profiler tool. This will help researchers investigating in details performance issues by analyzing the execution traces of any OpenStack functionality.
Finally, we would like to highlight that OpenStack is only one example of such large software projects that can benefit from the involvement of our scientific community. The approach pursued by Enos can be easily extended to other complex software stacks. The only requirement is to get containerized versions of said software. This trend is expected to grow, looking for instance at the Docker Hub repository [19].
ACKNOWLEDGMENTS
Most of the materials presented in this article are available on the Discovery initiative website. Supported by the Inria Project Lab program, Discovery is an Open-Science Initiative aiming at implementing a fully decen-tralized IaaS manager: http://beyondtheclouds.github.io. Experiments presented in this paper were carried out using the Grid’5000 testbed, supported by a scientific interest group hosted by Inria and including CNRS, RENATER and several Universities as well as other organizations. REFERENCES [1] CloudStack, http://cloudstack.apache.org. [2] OpenNebula, http://www.opennebula.org. [3] OpenStack, http://www.openstack.org. [4] Rally, https://wiki.openstack.org/wiki/Rally. [5] Shaker, https://github.com/openstack/shaker. [6] Kolla, https://wiki.openstack.org/wiki/Kolla. [7] Ansible, https://www.ansible.com. [8] iPerf, https://iperf.fr/. [9] Flent, https://flent.org/. [10] cAdvisor, https://github.com/google/cadvisor. [11] collectd, https://collectd.org/. [12] InfluxDB, https://www.influxdata.com. [13] Grafana, http://grafana.org/.
[14] D. Balouek et al., “Adding Virtualization Capabil-ities to the Grid’5000 Testbed,” in CCSS, 2013. [15] Vagrant, https://www.vagrantup.com/.
[16] M. G. Xavier et al., “Performance evaluation of container-based virtualization for high perfor-mance computing environments,” in PDP, 2013. [17] SPEC CloudTM IaaS 2016, https://www.spec.org/
cloud_iaas2016/.
[18] OpenStack Performance Documentation, http : / / docs.openstack.org/developer/performance-docs/. [19] Docker Hub, https://hub.docker.com/explore/.