Fractionation, Chemical and Toxicological
Characterization of Tobacco Smoke Components
par Navneet Kaur
Département de chimie Faculté des arts et des sciences
Thèse présentée à la Faculté des Études Supérieures et Postdoctorales en vue de l’obtention du grade de Philosophiæ Doctor (Ph. D.)
en Chimie option Analytique
Août, 2010
Faculté des études supérieures et postdoctorales
Cette thèse intitulée :
Fractionation, Chemical and Toxicological Characterization of Tobacco Smoke Components
Présentée par : Navneet Kaur
a été évaluée par un jury composé des personnes suivantes :
Pierre Thibault, président-rapporteur Karen C. Waldron, directeur de recherche
André Morin, co-directeur Jean-François Masson, membre du jury Serban C. Moldoveanu, examinateur externe Michel Anctil, représentant du doyen de la FES
Résumé
La fumée du tabac est un aérosol extrêmement complexe constitué de milliers de composés répartis entre la phase particulaire et la phase vapeur. Il a été démontré que les effets toxicologiques de cette fumée sont associés aux composés appartenant aux deux phases. Plusieurs composés biologiquement actifs ont été identifiés dans la fumée du tabac; cependant, il n’y a pas d’études démontrant la relation entre les réponses biologiques obtenues via les tests in vitro ou in vivo et les composés présents dans la fumée entière du tabac. Le but de la présente recherche est de développer des méthodes fiables et robustes de fractionnement de la fumée à l’aide de techniques de séparation analytique et de techniques de détection combinés à des essais in vitro toxicologiques.
Une étude antérieure réalisée par nos collaborateurs a démontré que, suite à l’étude des produits de combustion de douze principaux composés du tabac, l’acide chlorogénique s’est avéré être le composé le plus cytotoxique selon les test in vitro du micronoyau. Ainsi, dans cette étude, une méthode par chromatographie préparative en phase liquide a été développée dans le but de fractionner les produits de combustion de l’acide chlorogénique. Les fractions des produits de combustion de l’acide chlorogénique ont ensuite été testées et les composés responsables de la toxicité de l’acide chlorogénique ont été identifiés. Le composé de la sous-fraction responsable en majeure partie de la cytoxicité a été identifié comme étant le catéchol, lequel fut confirmé par chromatographie en phase liquide/ spectrométrie de masse à temps de vol.
Des études récentes ont démontré les effets toxicologiques de la fumée entière du tabac et l’implication spécifique de la phase vapeur. C’est pourquoi notre travail a ensuite été focalisé principalement à l’analyse de la fumée entière. La machine à fumer Borgwaldt RM20S® utilisée avec les chambres d’exposition cellulaire de British American Tobacco permettent l’étude in vitro de l’exposition de cellules à différentes concentrations de fumée entière du tabac. Les essais biologiques in vitro ont un degré élevé de variabilité, ainsi, il faut prendre en compte toutes les autres sources de variabilité pour évaluer avec précision la finalité toxicologique de ces essais; toutefois, la fiabilité de la génération de la fumée de la machine n’a jamais été évaluée jusqu’à maintenant. Nous avons donc déterminé la fiabilité de la génération et de la dilution (RSD entre 0,7 et 12 %) de la fumée en quantifiant la présence de deux gaz de référence (le CH4 par détection à ionisation de
flamme et le CO par absorption infrarouge) et d’un composé de la phase particulaire, le solanesol (par chromatographie en phase liquide à haute performance).
Ensuite, la relation entre la dose et la dilution des composés de la phase vapeur retrouvée dans la chambre d’exposition cellulaire a été caractérisée en utilisant une nouvelle technique d’extraction dite par HSSE (Headspace Stir Bar Sorptive Extraction) couplée à la chromatographie en phase liquide/ spectrométrie de masse. La répétabilité de la méthode a donné une valeur de RSD se situant entre 10 et 13 % pour cinq des composés de référence identifiés dans la phase vapeur de la fumée de cigarette. La réponse offrant la surface maximale d’aire sous la courbe a été obtenue en utilisant les conditions expérimentales suivantes : intervalle de temps d’exposition/ désorption de 10 ±0.5 min, température de désorption de 200°C pour 2 min et température de concentration
cryogénique (cryofocussing) de -75°C. La précision de la dilution de la fumée est linéaire et est fonction de l’abondance des analytes ainsi que de la concentration (RSD de 6,2 à 17,2 %) avec des quantités de 6 à 450 ng pour les composés de référence. Ces résultats démontrent que la machine à fumer Borgwaldt RM20S® est un outil fiable pour générer et acheminer de façon répétitive et linéaire la fumée de cigarette aux cultures cellulaires in vitro.
Notre approche consiste en l’élaboration d’une méthodologie permettant de travailler avec un composé unique du tabac, pouvant être appliqué à des échantillons plus complexes par la suite ; ex : la phase vapeur de la fumée de cigarette. La méthodologie ainsi développée peut potentiellement servir de méthode de standardisation pour l’évaluation d’instruments ou de l’identification de produits dans l’industrie de tabac.
Mots-clés: Machine à fumer Borgwaldt RM20S®, acide chlorogénique, chambre d’exposition cellulaire, système d’exposition, fractionnement, chromatographie en phase gazeuse, HSSE, test in vitro du micronoyau, chromatographie en phase liquide, spectrométrie de masse, désorption thermale, phase vapeur, fumée entière de cigarette.
Abstract
Tobacco smoke is an extremely complex aerosol composed of thousands of constituents distributed amongst the particulate and vapor phases. Toxicological effects have been linked to compounds present in both of these phases. Many biologically active compounds have been identified within tobacco smoke; however, there is a lack of studies correlating specific in vitro or in vivo biological responses to components within whole tobacco smoke. The goal of this research was to develop reliable and robust smoke fractionation methods using analytical separation and detection techniques in combination with in vitro toxicological assays.
In a previous study by our collaborators, toxicological assessment of the particulate phase combustion products of twelve individual tobacco components revealed that the combustion products of chlorogenic acid were the most cytotoxic using the in vitro micronucleus test. Therefore, a preparative liquid chromatography method was developed in this work to fractionate the combustion products of chlorogenic acid to assess the bioactivity of these fractions and to identify the compounds responsible for the toxicity observed. The sub-fraction responsible for the most cytotoxic response comprised catechol, which was identified by liquid chromatography/time-of-flight mass spectrometry.
Emerging studies have highlighted the toxicological significance of whole tobacco smoke and specifically the vapor phase, which shifted our focus to whole smoke analyses. The Borgwaldt RM20S® smoking machine in combination with British American
Tobacco’s in vitro cell exposure chamber allow for the generation of fresh cigarette smoke in various doses and delivery to cell cultures. In vitro biological assays have a high degree of variability, thus, all other sources of variability must be accounted for to accurately assess toxicological endpoints; however, the reliability of dose delivery of the instrument had not been assessed until now. We have determined the reliability (RSD from 0.7-12%) of smoke generation and dilution by quantifying two reference standard gases (CH4 by
flame ionization detection and CO by infrared absorption) and the tobacco particulate phase marker, solanesol (by high performance liquid chromatography-ultraviolet absorption detection).
The relationship between dose and diluted vapor phase components found within the exposure chamber was then characterized by developing a headspace stir-bar sorptive extraction-gas chromatography/mass spectrometry method. The method repeatability gave an RSD from 10-13% for five reference compounds identified in the vapor phase of cigarette smoke. The maximal peak area response was obtained using the following experimental conditions: exposure-to-desorption time interval of 10 ± 0.5 min, desorption temperature of 200 °C for 2 min, and a cryofocussing temperature of -75 °C. The dilution precision was found to yield a linear response of analyte abundance and was observed to be a function of concentration (RSD from 6.2-17.2 %) with quantities of 6-450 ng for the reference compounds. The findings obtained suggest the Borgwaldt RM20S® is a reliable tool to generate and deliver repeatable and linear doses of cigarette smoke to in vitro cell cultures.
Our approach began with designing the methodology to work with an individual tobacco component, which could then be applied to a more complex sample, e.g., the vapor phase of cigarette smoke. The methodology developed can potentially serve as standardized methods for the assessment of instrumentation or screening of products for the Tobacco Industry.
Keywords : Borgwaldt RM-20S® smoking machine, chlorogenic acid, exposure chamber, exposure system, fractionation, gas chromatography, headspace stir-bar sorptive extraction, in vitro micronucleus test, liquid chromatography, mass spectrometry, thermal desorption, vapor phase, whole cigarette smoke.
Table of Contents
Résumé ... i
Abstract ... iv
Table of Contents ... vii
List of Tables ... xii
List of Figures ... xiv
List of Abbreviations, Initials and Acronyms ... xxi
Acknowledgements ... xxv
1 General Introduction and Research Objectives ... 1
1.1 Overview ... 2 1.2 Tobacco ... 3 1.2.1 Curing Process ... 4 1.2.2 Aging Process ... 6 1.2.3 Types of Tobacco ... 6 1.2.4 Consumption ... 7
1.3 Composition of Tobacco and Tobacco Smoke ... 7
1.3.1 Leaf Chemistry ... 7
1.3.2 Distillation, Pyrolysis and Combustion ... 9
1.3.3 Cigarette Smoke Chemistry ... 11
1.4 Standard Reference Cigarette Samples ... 14
1.5 Cigarette Smoke Sample Collection ... 15
1.5.1 Smoking Protocol (International Organization for Standardization) ... 15
1.5.2 Particulate Phase Collection ... 16
1.5.3 Vapor Phase Collection ... 16
1.6 Cigarette Smoke Sample Analysis ... 18
1.7 Toxicology of Tobacco Smoke ... 18
1.7.1 Health Implications of Tobacco Use ... 18
1.7.3 Traditional Approaches: in Vitro Assays ... 24
1.7.4 Current Approaches: Whole Smoke Exposure Systems ... 25
1.8 Research Objectives ... 26
2 Experimental Methodology ... 33
2.1 Smoke Generation Techniques ... 34
2.1.1 Generation of Partial Combustion Products from Individual Tobacco Components using the John Payne Tar Combustion Simulator ... 34
2.1.2 Generation and Dilution of Cigarette Smoke by the Borgwaldt RM20S® Smoking Engine in Combination with BAT’s Exposure Chamber for in Vitro Cell Culture Exposures ... 41
2.2 Sample Collection Techniques ... 45
2.2.1 Extraction and Enrichment of Organic Compounds by using Stir-bar Sorptive Extraction (SBSE) or Headspace Stir-bar Sorptive Extraction (HSSE) ... 45
2.3 Description of Techniques used for the Separation and Identification of Smoke Constituents ... 47
2.3.1 Chromatographic techniques: LC, HPLC and GC ... 47
2.3.2 Fractionation by LC ... 48
2.3.3 UV Absorbance Detection ... 49
2.3.4 Mass Spectrometry Detection (MSD) ... 49
2.3.5 Quantification by Flame Ionization Detection (FID) ... 51
2.3.6 Quantification by Infrared Detection (IR) ... 52
2.4 The in Vitro Micronucleus Test (IVMNT) used to Assess the Relative Bioactivity of Chlorogenic Acid Combustion Products ... 52
3 Sequential Fractionation with Concurrent Chemical and Toxicological Characterization of the Combustion Products of Chlorogenic Acid ... 56
3.1 Abstract ... 57
3.2 Introduction ... 57
3.3 Experimental ... 60
3.3.2 Sample preparation ... 61
3.3.3 Partial combustion of CGA and collection/extraction of the particulate phase 61 3.3.4 Mammalian cell cultures ... 63
3.3.5 In Vitro Micronucleus Test (IVMNT) ... 63
3.3.6 Reproducibility study of the CGA combustion ... 65
3.3.7 Reproducibility study of the extraction with DMSO and DCM ... 66
3.3.8 Analytical separation of the DMSO extract ... 67
3.3.9 Preparative fractionation of the DMSO extract ... 68
3.3.10 Chemical characterization and separation of fraction 2 ... 69
3.3.11 Preparative sub-fractionation of fraction 2 ... 70
3.3.12 Chemical characterization of sub-fraction 1 ... 71
3.3.13 Statistical analysis ... 71
3.4 Results and discussion ... 72
3.4.1 Reproducibility study of the CGA partial combustion process ... 73
3.4.2 Effect of extraction solvent ... 78
3.4.3 Reproducibility study of the extraction with DMSO and DCM ... 81
3.4.4 Analytical separation of the DMSO extract ... 83
3.4.5 Preparative fractionation of the DMSO extract ... 85
3.4.6 Chemical characterization and separation of fraction 2 ... 87
3.4.7 Preparative sub-fractionation of fraction 2 and chemical characterization of sub-fraction 1 ... 88
3.5 Conclusion ... 95
3.6 Acknowledgements ... 96
4 Evaluation of Precision and Accuracy of the Borgwaldt RM20S® Smoking Machine Designed for In Vitro Exposure ... 97
4.1 Abstract ... 98
4.2 Introduction ... 99
4.3.1 Whole Smoke Exposure System: the Borgwaldt RM20S® Smoking Machine
and BAT’s Exposure Chamber ... 103
4.3.2 Vapor Phase Measurements-General Procedure ... 104
4.3.3 CH4 Measurements in the Canadian Laboratory ... 105
4.3.4 CH4 Measurements in the UK Laboratory ... 106
4.3.5 CO Measurements ... 106
4.3.6 Particulate Phase Measurements-General Procedure ... 107
4.3.7 Solanesol Measurements Prior to Dilution ... 108
4.3.8 Solanesol Measurements Following Dilutions ... 108
4.3.9 Statistical Analysis ... 109
4.4 Results ... 110
4.4.1 Vapor Phase Measurements ... 110
4.4.2 Particulate Phase Measurements ... 118
4.5 Discussion ... 123
4.6 Conclusions ... 126
4.7 Acknowledgements ... 127
5 Headspace Stir-bar Sorptive Extraction-Gas Chromatography/Mass Spectrometry Characterization of the Diluted Vapor Phase of Cigarette Smoke Delivered to an In Vitro Cell Exposure Chamber. ... 128
5.1 Abstract ... 129
5.2 Introduction ... 130
5.3 Materials and Methods ... 136
5.3.1 Whole Smoke Exposure System: the Borgwaldt RM20S® Smoking Machine and BAT’s Exposure Chamber ... 136
5.3.2 HSSE Sampling and Collection ... 137
5.3.3 Thermal Desorption and GC/MS Analysis ... 139
5.3.4 Reference Compounds ... 139
5.3.5 Preparation of n-Butyl Acetate Internal Standard (IS) ... 140
5.3.7 Stability of Sorbed Compounds on the Stir Bar ... 141
5.3.8 Measurement of Dilution Precision ... 142
5.3.9 Semi-Quantitative Analysis of Diluted Smoke Vapor Phase ... 142
5.4 Results and Discussion ... 143
5.4.1 Vapor Phase Characterization using HSSE, Thermal Desorption and GC/MS Analysis ... 143
5.4.2 Optimization of Desorption Parameters and Statistical Analysis ... 147
5.4.3 Stability of Sorbed Compounds on the Stir Bar ... 152
5.4.4 Measurement of Dilution Precision ... 153
5.4.5 Semi-Quantitative Analysis of Diluted Smoke Vapor Phase ... 155
5.5 Conclusions ... 159
5.6 Acknowledgements ... 160
6 Conclusion ... 161
6.1 General Remarks: Summary of Principle Results ... 162
6.2 Successes and Drawbacks of the Project ... 165
6.3 Future Challenges ... 166
7 Bibliography ... 168
8 Appendix A - Experimental Flow Chart ... i
9 Appendix B - Maximization of the HPLC-MS Separation of a Standard Mixture of Seven Compounds found in the Combustion of Chlorogenic Acid ... i
List of Tables
Table 1-1: Typical composition of cigarette tobaccos: representative analyses of cigarette tobaccos (leaf web after aging, moisture-free basis) (Leffingwell, 1999). ... 5 Table 1-2: Number of compounds identified in tobacco and in smoke (Weeks, 1999) . ... 9 Table 1-3: Approximate chemical composition of whole mainstream smoke (Baker,
1999). ... 12 Table 1-4: Some typical mainstream yield ratios for plain, unfiltered cigarettes of various
types, smoked under standard smoking machine conditions (Baker, 1999). ... 13 Table 1-5: Summary of lists of toxicants by Hoffmann et al. from 1986 to 2001 (Hoffmann
et al., 2001b, Hoffmann et al., 1997, Hoffmann, 1993, Hoffmann et al., 2001a, Hoffmann et al., 1990, Hoffmann et al., 1998b, Rodgman et al., 2003, Rodgman et al., 2009b). ... 21 Table 3-1: Reproducibility of the partial combustion process of CGA: phenolic compounds
identified by HPLC/FD in 1% (v/v) aqueous acetic acid extracts of the TPM from ¼ of each of four Cambridge filters. ... 76 Table 3-2: Normalized phenolic content relative to hydroquinone (from Table 3-1)... 76 Table 3-3: Reproducibility of the extraction by DMSO (n=4), with respect to peak area for
13 phenolic compounds identified by LC/MSD (negative mode). ... 82 Table 4-1: Summary of the Borgwaldt RM20S®’s dilution precision: r, RSD and error
values from measured CH4 for selected levels of dilution for syringes A-D used in the
Canadian laboratory (n=3). ... 111 Table 4-2: Overall precision figures of merit of r, R, RSD and error values from measured
CH4 for three dilution levels for syringes A-D used in the Canadian laboratory (n=3),
syringes 1-8 used in the UK laboratory (n=4). ... 114 Table 4-3: Summary of the Borgwaldt RM20S®’s dilution precision: r, RSD and error
values from measured CO for selected levels of dilutions for syringes A-D used in the Canadian laboratory (n=3). ... 117
Table 4-4: Summary of the Borgwaldt RM20S®’s smoke dilution precision: r and RSD values for measured solanesol for selected dilutions for syringes A-D used in the Canadian laboratory (n=3). ... 122 Table 4-5: Summary of the Borgwaldt RM20S®’s smoke dilution precision: r and RSD
values for measured solanesol for selected dilutions for syringes A-D used in the Canadian laboratory (n=3). ... 126 Table 5-1 : Repeatability data for exposure of a PDMS-coated stir bar (Twister™) to 5%
(v/v) vapor phase in air from 3R4F cigarettes for a 10 min smoking period. Integration results were obtained from the peak areas of the 5 reference compounds and the IS by GC/MS using the XICs. ... 147 Table 5-2: Optimization of the HSSE desorption parameters representing 10 vapor phase
components found on a stir bar following exposure to 5 % (v/v) cigarette vapor phase in air. The 10 compounds identified by GC/MS are listed in order of retention time, tr.
Relative peak areas were calculated from the XIC peak areas for each analyte ... 151 Table 5-3: Semi-quantitative analysis of the five reference vapor phase 1 compounds found
on a stir bar following 10 min exposure to 1, 2 and 5 % (v/v) cigarette vapor phase in air for HSSE experiments. ... 158 In total, four different stationary phases (Table 9-1) and nine different mobile phase
compositions (Fig. 9-1 and 9-2) were tested. Table 9-1: Description of HPLC separation columns used (Phenomenex, Torrance ,CA) ... i
List of Figures
Figure 1-1: Structure of nicotine, a naturally occurring tobacco alkaloid. ... 3 Figure 1-2: The burning cigarette and processes occurring during puffing (top) and during
smoldering (bottom) (Baker, 1999). ... 11 Figure 1-3: Hoffmann analytes, structures of phenolic compounds found primarily in the
particulate phase of cigarette smoke (Rodgman et al., 2003). ... 22 Figure 1-4: Hoffmann analytes, structures of volatile carbonyls (aldehydes and ketones)
and hydrocarbons found primarily in the vapor phase of cigarette smoke (Rodgman et al., 2003). ... 23 Figure 1-5: Cytotoxicity results (IVMNT) from the exposure of cells to the combustion
products of twelve tobacco constituents (Préfontaine et al., 2006). ... 29 Figure 2-1: Schematic of the John Payne Tar Predictor combustion simulator used to
generate partial combustion products of pure tobacco components or other samples. The quartz tube contains the sample to be combusted in the furnace for a fixed duration and temperature at a given air flow rate and the CFP collects the particulate phase as the smoke passes through. ... 36 Figure 2-2: Photograph of the cross-section of the furnace during partial combustion of an
individual tobacco constituent by the John Payne Tar Predictor. ... 37 Figure 2-3: The product of quinic acid and caffeic acid, chlorogenic acids (class of
isomers). ... 38 Figure 2-4: Some of the partial combustion products of chlorogenic acid. ... 40 Figure 2-5: Schematic of the Borgwaldt RM20S® instrument in combination with BAT’s
exposure chamber (on left side of figure) used to generate and dilute cigarette smoke for in vitro cell or tissue culture exposures. Exposure chambers A and B are exposed to whole cigarette smoke versus C and D which are exposed to vapor phase only in the figure. ... 43 Figure 2-6: The BAT exposure chamber (Patent Publication Number WO 03/100417,
Figure 2-7: Schematic of a Twister™ stir-bar used for SBSE and HSSE applications. ... 47 Figure 2-8: Photograph of fluorescently stained cells (binucleated cell with one
micronucleus on left and a mono-nucleated cell on the right) obtained from the IVMNT assay. ... 54 Figure 3-1: The genotoxic activity (% micronuclei), (a), and inhibition of cell proliferation
(b), induced by DMSO extracts from three independent combustions of 0.5 g of CGA, on V79 cells exposed for 3 h without metabolic activation. Dose refers to the quantity of TPM or DPM (µg) per mL of medium. The three extracts were tested in the Duncan’s test (α = 0.05) and no statistically significant difference was found. ( ) combustion 1; ( ) combustion 2; combustion 3. Error bars indicate standard deviation. ... 77 Figure 3-2: The genotoxic activity (% micronuclei), (a), and inhibition of cell proliferation,
(b), induced by DCM, DMSO, water, EA and MeOH extracts generated from combustions of 0.5 g of CGA, on V79 cells exposed for 3 h without metabolic activation. Dose refers to the quantity of TPM (µg) per mL of medium. n = 2 for all the condensates except DCM and DMSO, where n = 4. The dose/extraction solvent interactions were analyzed by the Fisher least significant difference multiple comparison test with a Bonferroni correction to type 1 error to ensure that the overall risk was kept under α = 0.05. Letters A, B and AB designate different statistical groups. Error bars have been removed for clarity. ... 80 Figure 3-3: Total ion chromatogram of the DMSO extract showing the CGA combustion
products, which were analyzed by LC/TOF-MS in negative mode. The dashed lines have been overlaid to represent the compounds isolated in the three main fractions collected. ... 84 Figure 3-4: The genotoxic activity (% micronuclei), (a), and inhibition of cell proliferation
(b), induced by (whole) DMSO extract, fractions 1–3. All other conditions as in Fig. 3-2. Error bars have been removed for clarity. ... 86
Figure 3-5: Preparative LC chromatogram (254 nm UV trace) of fraction 2 of the DMSO extract showing the sub-fractions collected. The dotted lines have been overlaid to represent the four main sub-fractions collected. ... 89 Figure 3-6: The genotoxic activity (% micronuclei), (a), and inhibition of cell proliferation
(b), induced by DMSO extract, fraction 2 and sub-fractions 1–4. All other conditions as in Fig. 3-2. Error bars have been removed for clarity. ... 90 Figure 3-7: Base peak LC/TOF-MS chromatogram (upper most trace) and extracted ion
chromatograms (lower traces) of sub-fraction 1 of fraction 2 of the DMSO extract of CGA combustion products. Separation conditions are given in Section 2. ... 93 Figure 3-8: The genotoxic activity (% micronuclei), (a), and inhibition of cell proliferation
(b), induced by DMSO extract and catechol standards. All other conditions as in Fig. 3-1. ( ) DMSO; ( ) catechol standard. Error bars indicate standard deviation. ... 94 Figure 4-1: Schematic of the exposure of cell or tissue culture to whole cigarette smoke or
vapor phase using the Borgwaldt RM20S® in combination with BAT’s exposure chamber. The RM20S® can smoke up to eight cigarettes simultaneously, which correspond to a specific port, syringe and exposure chamber (A-D). The machine smokes the cigarettes, dilutes the smoke and delivers it into the exposure chambers (chambers were not used in this study). Exposure chambers A & B exposed to whole smoke versus C & D exposed to vapor phase only. ... 102 Figure 4-2: Assessment of the Borgwaldt RM20S® dilution precision and accuracy:
correlation between the FID-based quantification of collected CH4 as a function of the
selected level of dilution for syringes A-D for a 10% CH4 standard reference gas
(Canadian laboratory), i.e., CH4 doses of 0.1, 0.2 and 0.52 % (v/v) in air. Data were
acquired in triplicate for all dilution levels (n=3). Linear fit analysis: y = 35.5 + 0.8557x (R2 = 0.987) with upper and lower confidence intervals (dotted lines) and predicted intervals (dashed lines) calculated at 95% probability. ... 112 Figure 4-3: Assessment of the Borgwaldt RM20S® dilution precision and accuracy:
selected level of dilution by any given syringe for a 10% CH4 reference standard. Data
were acquired for all dilution levels and 12 syringes, i.e., for syringes A-D used in the Canadian laboratory (n = 3/syringe/dilution) and syringes 1-8 used in the UK laboratory (n = 4/syringe/dilution). Calculated slopes were for each laboratory and combined measurements. ... 114 Figure 4-4: Dilution precision for individual syringes as a function of the desired level of
dilution. Graphs showing the concentration of CH4 collected after dilution of a 10%
CH4 gas standard by the syringes in both Borgwaldt RM20S® instruments (used in
laboratories in Canada and the UK). Top, middle and bottom panels represent dilutions to 0.1%, 0.2% and 0.52%, respectively. Mean CH4 concentrations are plotted
with standard deviations (n=3) for each syringe. ... 115 Figure 4-5: Assessment of the Borgwaldt RM20S® dilution precision and accuracy:
correlation between the non-dispersive infrared (NDIR) based quantification of collected CO as a function of the selected level of dilution for syringes A-D for a 9.98% CO standard reference gas, i.e., CO doses of 1, 2, 5 and 10 % (v/v) in air. Data were acquired in triplicate for all dilution levels (n=3). Linear fit analysis: y = 186.3 + 0.9137x (R2 = 0.999) with upper and lower confidence intervals (dotted lines) and predicted intervals (dashed lines) calculated at 95% probability. ... 117 Figure 4-6: Assessment of the smoke delivery of the Borgwaldt RM20S®: Shewhart
control charts showing the HPLC-based quantification of collected solanesol from cigarette filter tips. Data were acquired for the smoke delivery at all syringe ports: A-D (n=10 samples each) for a 30 min period (4 tips were pooled/port/sample). The top panel represents the mean solanesol concentrations (µg/mL) from replicates (n=2 injections) obtained for each pooled sample. The combined mean is shown as a solid line for each port (A-D). The middle panel represents the moving range (MR), or differences between successive samples. The bottom panel represents the range (R) within a measurement and is the difference between replicates with respect to HPLC determinations. Upper (UCL) and lower (LCL) control limits, represented by dotted
lines, correspond to 3σ. The LCL label in the bottom panel was removed for clarity as it corresponds to 0. ... 120 Figure 4-7: Assessment of the dilution precision of whole smoke in the Borgwaldt
RM20S®: LC/MS based quantification of solanesol collected on a CFP as a function of the selected level of dilution of smoke for syringes A-D, i.e., whole smoke doses of 1, 2 and 5% (v/v) in air. Data were acquired in triplicate for all dilution levels (n=3). Linear fit analysis: y = 0.742 + 3.816x (R2 = 0.954) with upper and lower confidence intervals (dotted lines) and predicted intervals (dashed lines) calculated at 95% probability. ... 122 Figure 5-1: a) Schematic of the Borgwaldt RM20S® in combination with the BAT
exposure chamber showing one of the four smoking ports connected to a dilution syringe. The machine smokes the cigarette, dilutes the smoke and delivers it to the exposure chamber (Thorne et al., 2009). Insertion of a CFP to trap particulate matter downstream of the syringe allows exposure of cell or tissue culture to the diluted vapor phase only. b) Cross-section of the exposure chamber (Thorne et al., 2009) showing the location for the TwisterTM stir bar for HSSE experiments. For in vitro cell culture assays, medium flows in and out of the chamber. In this work, no cells and no culture medium were used ... 132 Figure 5-2: HSSE-GC/MS chromatogram showing the identification of 16 compounds
found in the vapor phase sample. Sorption was carried out using a 2 cm PDMS-coated stir bar (Twister™) exposed to 10% (v/v) smoke vapor phase dilution in air for a smoking period of 30 min. The five compounds chosen for reference purposes, shown in bold type, were benzene, 2,5-dimethyl furan, toluene, ethyl benzene and limonene. ... 144 Figure 5-3: Effect of the three optimization factors on the abundances of five reference
compounds exposed to 5 % (v/v) vapor phase in air. a) Peak area as a function of stir bar desorption temperature for a 2 min desorption time and cryofocussing at -75°C; b) Peak area as a function of stir bar desorption time for desorption at 250°C and cryofocussing at -75°C; c) Peak area as a function of cryofocussing temperature when
desorption was held at 250°C for 2 min. Integrated peak areas of the reference compounds were obtained from the GC/MS XICs: Benzene, ; 2,5-Dimethyl furan,
; Toluene (peak area /10 to aid plotting), ; Ethyl benzene, ; Limonene, . Each data point represents an average of three individual runs using three different stir bars and error bars indicate relative standard deviation. ... 149 Figure 5-4: Stability measurements of five vapor phase reference compounds desorbed
from a Twister™ stir bar, following exposure to 5 % (v/v) cigarette vapor phase in air for HSSE experiments. The transfer time intervals (i.e., between exposure and desorption) selected for the analysis were 10, 40, 160 and 1440 min (24 hours). Integration results were obtained from the XIC peak areas of the 5 reference compounds by GC/MS: Benzene, ; 2,5-Dimethyl furan, ; Toluene, ; Ethylbenzene, ; Limonene, . Each data point represents an average of 3 individual runs using 3 different stir bars and error bars indicate standard deviation. ... 153 Figure 5-5: Dilution precision data representing the vapor phase components found on a
PDMS coated stir bar (Twister™), following exposure to 1, 2 and 5 % (v/v) cigarette vapor phase in air from 3R4F cigarettes for HSSE experiments. Integration results were obtained from the peak areas of the 5 reference compounds by GC/MS using the XICs: Benzene, ; 2,5-Dimethyl furan, ; Toluene, (abundance shown on right vertical axis); Ethylbenzene, ; Limonene, . Each data point represents an average of 3 individual runs using 3 different stir bars and error bars indicate standard deviation. ... 155 Figure 8-1: Experimental flow chart of the chlorogenic acid combustion product study.
1Corresponds to LC/UV reversed-phase experimental conditions described in section
3.3.9 2Corresponds to LC/UV reversed-phase experimental conditions described in section 3.3.11 ... i Figure 9-1: Representation of the nine types of mobile phase gradient elutions used. The
solvent consisted of MeOH in 0.1% aqueous formic acid (pH 3-4), with concentrations of MeOH of 10-50 to 75% increasing over 24 min. ... ii
Figure 9-2: Total Ion Chromatograms (m/z 50-1000) of the comparison of the nine types of mobile phase gradient elutions used MeOH of 10-50 to 75% in 0.1 % aqueous formic acid, increasing over 24 min. ... iii Figure 9-3: Total Ion Chromatograms (m/z 50-1000) representing the separations of the
standard mixture using a gradient of 20-75% MeOH in 1% aqueous formic acid. Mixture contained: 2,5-dihydroxybenzoic Acid (1), p-hydroxybenzoic acid (2), caffeic acid (3), p-coumaric acid (4), 4-hydroxy-3-methoxycinnamic acid (5), benzoic acid (6) and trans-cinnamic acid (7). ... iv
List of Abbreviations, Initials and Acronyms
1R4F Kentucky reference cigarette blend with low nicotine, batch from 1983 2R4F Kentucky reference cigarette blend with low nicotine, batch from 2002 3R4F Kentucky reference cigarette blend with low nicotine, batch from 2006 ACN Acetonitrile
ANCOVA Analysis of covariance ANOVA Analysis of variance BAT British American Tobacco
BN Binucleated
CBPI Cytokinesis-block proliferation index CE Capillary electrophoresis
CEL Cellulose
CFP Cambridge filter pad CGA Chlorogenic acid
CHO Chinese Hamster Ovary Cells CIS Cooled injection system
CK36 Canadian reference cigarette blend COPD Chronic obstructive pulmonary disease
CORESTA Cooperation Centre for Scientific Research Relative to Tobacco CSC Cigarette Smoke Condensate
DCM Dichloromethane DMSO Dimethylsulfoxide DNA Deoxyribonucleic acid EA Ethyl acetate
EI Electron ionization ESI Electrospray ionization FD Fluorescence detection FID Flame ionization detection
FTC US Federal Trade Commission GC Gas chromatography
GLU Glucose
GLY Glycine
HPLC High performance liquid chromatography HSSE Headspace stir-bar sorptive extraction IR Infrared
IS Internal standard
ISO International Standard Organization IVMNT In vitro micronucleus test
JPTP John Payne Tar Predictor
LIG Lignin
LC Liquid chromatography MAL Malic acid
MeOH Methanol
MS Mass Spectrometry MSD Mass Selective Detector NAB N-nitrosoanabasine NAT N-nitrosoanatabine
NSERC Natural Sciences and Engineering Council of Canada NNK 4-(methylnitrosamino)-1-(3-pyridyl)-1-butanone. NNN N-Nitrosonornicotine
NRU Neutral red uptake PDMS Polydimethylsiloxane
PEC Pectin
PRO Proline
RSD Relative standard deviation
RUB RUBISCO
SPME Solid phase micro-extraction
STA Starch
TCD Thermal conductivity detection TD Thermal desorption
TDS Thermal desorption system TIC Total ion chromatogram TIOJ Tobacco Institute of Japan TOF Time-of-flight
TPM Total particulate matter
TRY Tryptophan
TSNA Tobacco-specific nitrosamines
TYR Tyrosine
UV Ultraviolet
VIS Visible
To my family & friends, especially Sandra, Lisa and Martine
and to my husband, Ranjit
Life is a laboratory. Experiment. - Pawliszyn
Acknowledgements
First and foremost, I would like to express my gratitude to my research supervisor, Professor Karen C. Waldron and co-supervisor, Dr. Andre Morin. Their constant input, help and advice have guided me through the last five years and helped me reach the light at the end of the tunnel. I would also like to thank two other mentors, Dr. Alexandra Fürtös and Dr. Jean-Louis Cabral for their guidance and effort.
I would like to thank the R&D Group at Imperial Tobacco Canada Ltd., the GR&D Group at British American Tobacco, the Mass Spectrometry Lab at UdM and Professor Waldron’s Laboratory Group at UdM. Thanks to their collaborations, especially those of Martine Lacasse, Mario Gaudreau, Jules Verreault, Nicole Poirier, Jacques Dumont, Dalbir Sekhon, Karine Venne and Mari Bratberg, I was able to achieve my research goals. I would like to thank the following people for their technical support, Jeff Lippert, Mark Barber, Christian Foucault and Sylvain Levesque.
Finally, I would like to thank the Natural Sciences and Engineering Council of Canada (NSERC) and the Cooperation Centre for Scientific Research Relative to Tobacco (CORESTA) for their financial support.
1.1 Overview
Tobacco smoke is a complex mixture composed of thousands of components, distributed between the particulate and vapor phases. Extensive work has been carried out on the identification of compounds present in tobacco and its smoke due to its biological activity. Many biologically active compounds have been identified within tobacco smoke; however, there is a lack of studies correlating specific in vitro or in vivo biological responses to components within whole tobacco smoke due to its complex nature i.e., the number and diverse range of compounds simultaneously distributed in the two phases. The general hypothesis that guided this work was as follows: the development of reliable and robust smoke fractionation methods makes it possible to assign toxicological effects to specific cigarette smoke components by using sophisticated analytical separation and detection techniques in combination with reliable toxicology assays. The novelty in this approach lies in the union of chemical characterization and toxicological studies in parallel. This thesis describes the development of methods for chemical characterization of tobacco smoke components, specifically the combustion products of chlorogenic acid, which is the most abundant tobacco leaf polyphenol (Chapter 3), and the vapor phase of cigarette smoke (Chapters 4 and 5). To prepare those readers who may be unfamiliar with this field of study, an introduction of some aspects to tobacco science is made in Chapter 1, which is concluded with the objectives of the research. The specific techniques used during fractionation and chemical analysis are described in detail in Chapter 2. In vitro toxicological assays have a high degree of variability, thus, all other sources of variability must be reduced or accounted to accurately assess toxicological endpoints. The
methodology developed (Chapters 4-5) can potentially serve as standardized methods for the assessment of instrumentation (Chapter 4) or screening of tobacco products (Chapter 3, 5) for the Tobacco Industry.
1.2 Tobacco
Tobacco used in cigarettes is a product processed from the leaves of the Nicotiana genus, namely Nicotiana tabacum L. (typically used in North America) and Nicotiana rustica subgenera plant species (Tso, 1999). Similar to other types of plants, the chemical constituents (i.e. sugars, alkaloids, N2 and cellulose) vary based on leaf positioning and
environmental factors, such as soil type and nutrient levels (Tso, 1999). Many plants in the Solanaceae family contain nicotine (Fig. 1-1), a powerful neurotoxin; however, Nicotiana tabacum L. contains higher levels of nicotine than most plants. Tobacco plants are grown and cultivated in a similar procedure to other agricultural products. In addition to seeding and cultivation, curing, aging, fermentation, blending and manufacturing processes take place prior to cigarette production.
N
N
1.2.1 Curing Process
Following cultivation, the leaves undergo a “curing” process (air, flue, sun or fire) that involves biochemical and chemical changes. Curing involves three stages which results in hydrolysis of starch and other components. The first is a biochemical process applied to tobacco leaf by controlling temperature and relative humidity, referred to as “yellowing”. The second is a “fixing color” stage, which is followed by the third “drying process” involving dehydration to preserve leaves. Two of the most common types of curing processes are air- and flue-curing. Air-cured tobacco is hung in ambient, well ventilated areas and allowed to dry for a period of four to eight weeks (Palmer et al., 1999). Air-cured tobacco is lower in sugar and higher in nicotine compared to using other types of curing and is typically used for Burley, Maryland and cigar tobaccos (Table 1-1). Flue-curing is a heat-driven process involving the slow ramping of temperature for a period of one week and is used for Virginia tobacco (Peedin, 1999). Flue-cured tobacco is higher in sugar and contains moderate levels of nicotine (Table 1-1).
Table 1-1: Typical composition of cigarette tobaccos: representative analyses of cigarette tobaccos (leaf web after aging, moisture-free basis) (Leffingwell, 1999).1
Component (%)1 Flue-cured Burley Maryland Oriental2
type 13 type 31 type 32
Total volatile bases as ammonia 0.282 0.621 0.366 0.289
Nicotine 1.93 2.91 1.27 1.05
Ammonia 0.019 0.159 0.13 0.105
Glutamine as ammonia 0.033 0.035 0.041 0.02
Asparagine as ammonia 0.025 0.111 0.016 0.058 α-Amino nitrogen as ammonia 0.065 0.203 0.075 0.118 Protein nitrogen as ammonia 0.91 1.77 1.61 1.19
Nitrate nitrogen as NO3 trace 1.7 0.087 trace
Total nitrogen as ammonia 1.97 3.96 2.8 2.65
pH 5.45 5.8 6.6 4.9
Total volatile acids as acetic acid 0.153 0.103 0.09 0.194 Formic acid 0.059 0.027 0.022 0.079 Malic acid 2.83 6.75 2.43 3.87 Citric acid 0.78 8.22 2.98 1.03 Oxalic acid 0.81 3.04 2.79 3.16 Volatile oils 0.148 0.141 0.14 0.248 Alcohol-soluble resins 9.08 9.27 8.94 11.28
Reducing sugars as dextrose 22.09 0.21 0.21 12.39 Pectin as calcium pectate 6.91 9.91 12.41 6.77
Crude fiber 7.88 9.29 21.79 6.63 Ash 10.81 24.53 21.98 14.78 Calcium as CaO 2.22 8.01 4.79 4.22 Potassium as K2O 2.47 5.22 4.4 2.33 Magnesium as MgO 0.36 1.29 1.03 0.69 Chlorine as Cl 0.84 0.71 0.26 0.69 Phosphorus as P2O5 0.51 0.57 0.53 0.47 Sulfur as SO4 1.23 1.98 3.34 1.4
Alkalinity of water-soluble ash3 15.9 36.2 36.9 22.5
1In % except for pH and alkalinity.
2Blend of Macedonia, Smyrna and Samsun types. 3Milliliters of 1 N acid per 100 g tobacco.
1.2.2 Aging Process
Freshly cured tobacco is not immediately processed since its smoke is pungent and irritating (Leffingwell, 1999). During aging, leaf tobacco is stored for days or even months on a farm to improve the aroma and texture of the leaves. In addition, leaves are separated based on physical imperfections, color, thickness, length, stalk position etc. Depending on the specific recipe, the tobacco is blended and cigarettes or other products can be manufactured.
1.2.3 Types of Tobacco
The most common types of tobacco are Burley, Virginia and Oriental. These main types are divided into grades based on where the tobacco is grown, which part of the plant it is taken from and other plant characteristics. Virginia, normally a flue-cured tobacco, is a brighter tobacco because it turns to a yellow/orange color during the curing process. This process causes degradation of chlorophyll and most carbohydrates are converted into simple sugars (Leffingwell, 1999). Virginia tobacco contains between 1-3.5 % nicotine and 5-25 % sugars (Leffingwell, 1999). In Canada, Virginia blends do not contain flavors or additives. Burley tobaccos typically undergo an air-curing process under ambient conditions in which the leaves turn brown with very low sugar levels. This type of tobacco is treated with sugars to replace those lost during the curing process and is combined with other types of tobacco or flavors prior to consumption. Oriental tobacco, also known as Turkish tobacco, is sun-dried, and contains small leaved plants, because it is grown in soil with limited supplies of nitrogen and water.
1.2.4 Consumption
Tobacco is generally consumed in smokable and smokeless forms, such as cigarettes, cigars, chewing tobacco, pipe smoking, snuff (dry smokeless form of tobacco, snorted through the nose) and snus (smokeless form of tobacco consumed by placing sachet under the upper lip). In this study, only smokable forms were analyzed.
1.3 Composition of Tobacco and Tobacco Smoke
Leaf tobacco consists of over 2000 components and upon partial combustion generates a complex aerosol containing more than 5000 components distributed between particulate and vapor phases (Rodgman et al., 2009a, Rodgman et al., 2009b).
1.3.1 Leaf Chemistry
The physical and chemical properties of leaf tobacco vary with genetics, agricultural practices, soil type and nutrients, weather conditions, plant disease, stalk positioning, harvesting and curing procedures (Leffingwell, 1999). The tobacco leaf is comprised of carbohydrates (starch, sugars, sugar esters, glucosides, cellulose, hemicelluloses and pectin), nitrogen containing compounds (proteins, amino acids, ammonia, nitrates and alkaloids including nicotine, cotinine, nornicotine, myosmine, nicotyrine, anabasine and anatabine), plastid pigments (chlorophylls and carotenoid pigments such as β-carotene, violaxanthin, lutein and neoxanthin), isoprenoids (degraded caratenoid products, acyclic isoprenoids and N-demethylated-derivatives such as solanesol and neophytadiene, carbocyclic diterpenoids, cembranoids, labdanoids and their degration
products), phenolics (polyphenols such as chlorogenic acid, rutin, scopoletin and scopolin, lignin and others), sterols (sterols, steryl esters and esterified steryl glucosides) and inorganics (Baker et al., 2003, Leffingwell, 1999). The Krebs cycle is responsible for the metabolic carbon-nitrogen balance in plants, of which, carbon dioxide is provided from the photosynthesis process and inorganic nitrogen is absorbed from the soil. Therefore, where nitrogen supply is abundant, protein, amino acid and nicotine are produced in abundance (i.e. cigar and burley tobaccos). Conversely, where nitrogen supplies are limited (i.e. Oriental Tobacco), there is an accumulation of acetate in the Krebs cycle which results in the formation of terpenoids, carbohydrates, aromatic acids and resins. An intermediate nitrogen level is required for a flue-cured type tobacco (Table 1-1) (Leffingwell, 1999). Many types of compounds are common to leaf tobacco and tobacco smoke (Table 1-2).
Table 1-2: Number of compounds identified in tobacco and in smoke (Weeks, 1999) . Classes of Chemicals in Tobacco in Smoke common to both (#) (#) (#) Carboxylic acids 450 69 140 Amino acids1 95 18 16 Lactones 129 135 39 Esters 529 456 314 Amides and imides 205 227 32 Anhydrides 10 10 4 Aldehydes 111 106 48 Carbohydrates 138 30 12 Nitriles 4 101 4 Ketones 348 461 122 Alcohols 334 157 69 Phenols 58 188 40 Amines 65 150 37 N-Heterocycles: Pyridines 63 324 46 Pyrroles and indoles 9 88 3 Pyrazines 21 55 18 Nonaromatic 13 43 7 Ethers 53 88 15 Hydrocarbons 184 429 114 Inorganics and metals 105 111 69
1 Refers to natural and non-standard amino acids. The latter are constituents of proteins and biologically active peptides.
1.3.2 Distillation, Pyrolysis and Combustion
During a puff, air is drawn into a cigarette through the burning zone and mainstream smoke (produced during the puff) is formed (Fig. 1-2). In addition, sidestream smoke is formed (during smolder) by a natural convection flow of air at the burning zone. Many chemical and physical processes occur while a cigarette is burning since tobacco is in
the presence of varying amounts of oxygen and temperatures (ambient up to 950 °C) (Baker et al., 2003). The burning process can be broken down into heat producing combustion and endothermic pyrolysis/distillation, yielding organic smoke products. Combustion is defined as the sequence of chemical reactions between a fuel and an oxidant and involves the production of heat and conversion of various compounds, whereas, pyrolysis is the chemical decomposition of organic materials by heat in the absence of oxygen. Distillation is the separation of components in mixtures based on differences in their volatilities in a boiling mixture. As a result of the burning process, other processes that may occur are: pyrosynthesis, sublimation and condensation. Pyrosynthesis occurs at high temperatures and is the fusion of simple compounds into complex ones. Sublimation is the phase transition from solid to gas, without becoming a liquid and condensation is the transition from gas to liquid or solid.
Temperature and heating rate of tobacco are extremely important during smoke generation. When air is drawn into the cigarette, oxygen is consumed by combustion with carbon-rich tobacco (at temperatures between 700-950°C), releasing carbon monoxide, carbon dioxide, water and heat. Downstream, pyrolysis occurs at between 200-600 °C with low oxygen levels. As the aerosol is drawn out of the pyrolysis zone, it rapidly cools as the diluted air enters (Baker et al., 2003).
Figure 1-2: The burning cigarette and processes occurring during puffing (top) and during smoldering
(bottom) (Baker, 1999).
1.3.3 Cigarette Smoke Chemistry
Fresh cigarette smoke is extremely complex, dynamic and reactive because of its physical properties and chemical composition. It’s complexity has been compared to other widely studied mixtures, such as air (pollution) and diesel engine emissions (Borgerding et
al., 2005). As an aerosol, tobacco smoke components are distributed between the particulate and vapor phases. The chemical composition of whole mainstream smoke from an American blended cigarette (specific blend details not available, similar in composition to Ky3R4F, which is specified in section 1.4.2), smoked under standard conditions (35 mL puff for a 2 second duration, once every minute) is estimated in Table 1-3 (Dube et al., 1982). Additionally, the yields of various compounds found in mainstream cigarette smoke are listed in Table 1-4.
Table 1-3: Approximate chemical composition of whole mainstream smoke (Baker, 1999).
Constituent individual Air N2 62 O2 13 75.9 Ar 0.9 Vapor Phase Water 1.3 CO2 12.5 CO 4 H2 0.1 CH4 0.3 Hydrocarbons 0.6 Aldehydes 0.3 Ketones 0.2 19.6 Nitriles 0.1 Heterocyclics 0.03 Methanol 0.03 Organic acids 0.02 Esters 0.01 Other compounds 0.1 Particulate Phase Water 0.8 Alkanes 0.2 Terpenoids 0.2 Phenols 0.2 Esters 0.2 4.5 Nicotine 0.3 Other alkaloids 0.1 Alcohols 0.3 Carbonyls 0.5 Organic acids 0.6 Leaf pigments 0.2 Other compounds 0.9
}
by phase % by Weight}
}
Table 1-4: Some typical mainstream yield ratios for plain, unfiltered cigarettes of various types, smoked under standard smoking machine conditions (Baker, 1999).
Substance Yield1 Substance Yield1 Substance Yield1
Small molecules Phenols Aza-arenes
Carbonyl sulphide 18-42 µg Phenol 60-140 µg Quinoline 0.5-2.0 µg HCN 160-500 µg Cresols (o-, m-, p-) 11-37 µg Isoquinoline 1.6-2.0 µg CO 10-23 mg Catechol 100-360 µg Benzo[h]quinoline 10 ng Hydrazine 20-40 µg Hydroquinone 110-300 µg Indole 16-38 µg
Methane 600-1000 µg
Acetylene 20-40 µg Acids Hydrocarbons
Nitrogen oxides 100-600 µg Formic acid 210-490 µg Isoprene 330-1100 µg CO2 20-50 mg Acetic acid 270-810 µg Benzene 36-68 µg H2O (gas phase) 3-14 mg 3-Methylvaleric acid 20-60 µg Toluene 100-200 µg NH3 50-130 µg Lactic acid 60-170 µg Limonene 15-50 µg N2 (generated) <10 µg Benzoic acid 14-28 µg Neophytadiene 66-230 µg
Phenylacetic acid 11-38 µg
Neutral heteroatom organics Succinic acid 70-140 µg Polynuclear aromatic hydrocarbons
Acetonitrile 160-210 µg Glycolic acid 40-130 µg Naphthalene 2.6 µg
Benzonitrile 5-6 µg Pyrene 45-140 ng
Acetamide 70-100 µg Amines, pyridines, alkaloids Benzo[a]pyrene 9-40 ng Methyl chloride 150-600 µg Methylamine 12-29 µg Anthracene 24 ng
n-Propylamine 1.6-3.4 µg Phenanthrene 77 ng
Aldehydes, ketones and alcohols n-Butylamine 0.5-1.5 µg Fluoranthene 60-150 ng
Acetaldehyde 0.5-1.2 mg Aniline 360 ng
Propionaldehyde 175-250 µg Pyridine 16-46 µg Nitrosamines†
Acetone 100-250 µg 3-Ethenylpyridine 11-30 µg N-nitrosodimethylamine 10-40 ng Acrolein 60-100 µg Methylpyrazine 2-5 µg N-nitrosodiethylamine nd-25 ng 2-Butanone ~ 30 µg Pyrrole 16-23 µg N-nitrosopyrrolidine 6-30 ng 2-Furaldehyde 15-43 µg Nicotine 0.8-2.3 mg N-nitrosodiethanolamine 0-70 ng Furfuryl alcohol 18-65 µg Myosmine 13-33 µg N'-nitrosonornicotine 0.2-3 µg
Cyclotene* 3-5 µg Nicotyrine 4-40 µg NNK‡ 0.1-1 µg
Pyranone** 13-150 µg Anatabine 2-20 µg N'-nitrosoanatabine 0.3-5 µg 2,3-'Bipyridyl 16-22 µg
Phytosterols Inorganic constituents
β-Sitosterol 59 µg Cadmium 100 ng
Campesterol 43 µg Nickel 20-80 ng
Cholesterol 22 µg Zinc 60 ng
*2-Hydroxy-3-methyl-2-cyclopentanone.
** 5,6-Dihydro-3,5-dihydroxy-2-methyl-4H-pryan-4-one.
† Data in the literature on levels of volatiles and nitrosamines may be in error, due to artifact formation during the extraction procedure. ‡ 4-(methylnitrosamino)-1-(30pyridyl)-1-butanone. Nd = not detected
There is no definitive way to separate and differentiate the particulate and vapor phases. Some components partition between the two phases, depending on time, temperature and smoke dilution (Baker, 1999). Based on the latter, it is generally accepted that the portion of smoke that passes through a Cambridge filter pad (CFP) at room temperature is defined as the vapor phase (volatile and semi-volatile compounds). The portion that is retained by the CFP is referred to as the particulate phase (semi-volatile and non-volatile compounds) or “total particulate matter” (TPM). Another common term used is “tar”, which is defined as the weight of TPM minus the weight of nicotine and water. The CFP (glass fiber, 44 mm in diameter) retains cigarette smoke particles larger than 0.1 µm in diameter with an efficiency of approximately 99.9 % (Adam et al., 2006, Baker, 1999). This efficiency is based on the nature and quantity of the sample, flow through the filter, temperature and moisture level (Baker, 1999).
1.4 Standard Reference Cigarette Samples
For research purposes, international standard reference cigarettes are manufactured by the Kentucky Tobacco Research & Development Center. The first blend was manufactured in 1974 and is referred to as Ky1R1. Blends vary based on composition of tobacco used, i.e., percentage of Virginia flue-cured, Burley, Maryland, Oriental etc. Other blends include: Ky1R3F (blend used by the National Cancer Institute produced in 1974), Ky1R4F (low nicotine blend produced in 1983), Ky2R4F (similar to Ky1R4F blend but produced in 2002) and Ky1R5F (ultra-low nicotine blend produced in 1989) have been produced. Currently, the batch of cigarettes that is available is referred to as Ky3R4F
(similar to Ky1R4F blend but produced in 2006) and is a blend of Virginia flue-cured (35.41 %), Burley (21.62 %), Oriental (12.07 %), Maryland (1.35 %), Reconstituted (29.55 %), Glycerin (2.67 %) and an “Isosweet” sugar (6.41 %) (University of Kentucky, 2010a). The Ky3R4F was the only references cigarette used throughout this work.
1.5 Cigarette Smoke Sample Collection
1.5.1 Smoking Protocol (International Organization for Standardization)
The cigarette smoking process is highly variable between different smokers as well as between different smoking sessions for the same individual. Factors that influence the smoking behavior include human, social and environmental variables. The yield and composition of smoke compounds depends on the physical dimensions of the cigarette, puff volume (20-80 cm3), the shape of the puff profile (i.e. the pressure/flow relationship), which dictates a puff duration (0.8-3 s), the number and frequency of puffs (typically 20-100 s) and residual butt length (19-28 mm) left at the end of smoking (Baker, 1999, Borgerding et al., 2005). Paper type is an additional variable that may effect smoke composition.
A standard set of smoking procedures was implemented by government and industry and included employing a 35 cm3 puff for a 2 second duration, every minute, while maintaining a butt length of 23 mm (International Organization for Standardization, 1999). These parameters were implemented to promote consistency in research (mainly
product comparisons) using automated smoking machines by the US Federal Trade Commission (FTC), International standard organization (ISO), Cooperation Centre for Scientific Research Relative to Tobacco (CORESTA) and Tobacco Institute of Japan (TIOJ). Due to the variation and higher intensity in smoking behavior between individual smokers, this smoking regime can not be used to predict consumer yields (Côté et al., 2010).
1.5.2 Particulate Phase Collection
Extensive work has been carried out on phenols, terpenes and alkaloids among other particulate phase constituents, based on their biological/toxicological significance. As stated above, the most common technique for collecting the particulate phase of cigarette smoke is by using a CFP to trap total particulate matter (TPM) generated by a smoking machine. The CFP, a glass fiber filter, traps the particles ≥0.1 µm with >99 % efficiency (Baker, 1999). The particulate phase is subsequently extracted from the CFP using a solvent (Misra et al., 2010). Other techniques that are used to trap the particulate phase include: electrostatic precipitation, jet impaction and the use of solid adsorbents (activated charcoal, silica gels, molecular sieves and tenax) (Baker, 1999, Dube et al., 1982, Wynder et al., 1967).
1.5.3 Vapor Phase Collection
Volatile organic compounds, hydrocarbons, carbon monoxide, methane, aldehydes and nitrosamines are among the compounds of biological interest, found in the vapor phase
of cigarette smoke. Collection of the vapor phase is quite challenging and has been achieved by employing sampling bag methods, cryogenic/cold traps, impingers, solvent traps, adsorbent traps, direct injection methods, and solid-phase microextraction (SPME) related techniques (Omori et al., 1999, Ye, 2008, Dube et al., 1982, Wynder et al., 1967, Borgerding et al., 2005). These techniques all have their own specific advantages and limitations. Gas bags allow for the exposure of whole smoke, without preconcentration and can average smoking from a number of cigarettes; however, smoke ageing may occur (which includes degradation of some compounds) and some compounds may deposit on the bag itself (Dong et al., 2000, Omori et al., 1999, Chen et al., 2003). Impingers and traps under the use of cryogenic conditions may provide an alternative that is easy to use an internal standard and average smoking from a number of cigarettes; however, solvents are used and can cause interferences with some analytes and typically have a complex setting and time-consuming experimental work (Dong et al., 2000, Darrall et al., 1998, Byrd et al., 1990). Direct injection methods provide un-aged smoke to be analyzed, where degradation of analytes are minimized; however, reproducibility and quantitation are challenging due to only sampling a fraction of a puff (Takanami et al., 2003, Adam et al., 2009). SPME and related techniques allow for solvent-free method, rapid pre-concentration and sorption in one step, homogeneous sampling and high reproducibility; however sensitivity can be low since these techniques are limited by the volume of the sorptive phase and quantitation may be challenging (Polzin et al., 2007, Ye, 2008, Buszewski et al., 2009).
1.6 Cigarette Smoke Sample Analysis
Tobacco smoke has been extensively characterized using many experimental approaches, including detailed chemical analyses of the smoke using chromatographic instrumentation coupled with a variety of detection techniques, analysis of smoke from precursor “doped” cigarettes, studying aerosols, investigating pyrolysis from fundamental perspectives, studies involving isotopically labeled compounds, fractionation studies, investigating mass transfer inside the cigarette and computer modeling of the formation processes and their interactions (Baker, 1999, Swain et al., 1969, Chen et al., 2003, Dong et al., 2000, Adam et al., 2009, Adam et al., 2006, Baggett et al., 1974, Wynder et al., 1967, Stedman, 1968, IARC, 1986, Borgerding et al., 2005, Polzin et al., 2007).
1.7 Toxicology of Tobacco Smoke
It is important to note that the “toxicology of tobacco smoke” is an extremely broad and complex subject and that the content of this chapter is limited to the literature provided.
1.7.1 Health Implications of Tobacco Use
The use of tobacco has been recorded across the world since the 10th century or earlier (Hoffmann et al., 1998a). It was in the 1920’s that adverse health effects began to be more prevalent and the first paper linking tobacco use and cancer was published in the late 1920s (Lickint, 1929). It was not until 1964 that the United States Surgeon General issued a report on Smoking and Health (US Surgeon General, 1964), suggesting a relationship between smoking and cancer, which was confirmed in the 1980s (US Surgeon General,
1982). At present, some of the known risks associated with tobacco use include: stroke, heart attack, chronic obstructive pulmonary disease (COPD), emphysema and various forms of lung, mouth and pancreatic cancers (Hoffmann et al., 2001b, U.S. Department of Health and Human Services, 1989).
1.7.2 Toxicologically Relevant Constituents Present in Tobacco Smoke
During the smoking process, a complex mixture is inhaled into the respiratory tract and chemical, physical and physiological phenomena occur. There are a few important factors to consider when evaluating cigarette smoke toxicity. Some of these key factors include the complex nature of cigarette smoke, potential changes of the smoke material during collection and the analysis itself.
The toxicity of cigarette smoke is thought to be a function of the concentrations of individual toxicants present in smoke. A set of compounds referred to as the “Hoffmann analytes” were reported by Hoffmann in the 1990s (Hoffmann, 1993, Hoffmann et al., 1998b, Hoffmann et al., 1997). The Hoffmann analytes are summarized in Table 1-4 and the structures of some of these compounds are presented in Fig 1-3 and 1-4 (Hoffmann et al., 2001b, Hoffmann et al., 1997, Hoffmann, 1993, Hoffmann et al., 2001a, Hoffmann et al., 1990, Hoffmann et al., 1998b, Rodgman et al., 2003, Rodgman et al., 2009b).A more recent list of 149 toxicants potentially found in cigarette smoke was published in 2003 (Rodgman et al., 2003). Various tobacco smoke components have been established as tumor promoters, carcinogenic and/or co-carcinogenic (Borgerding et al., 2005). Few toxicological studies have been carried out on specific Hoffmann analytes or other
biologically active smoke constituents that produce in vitro or in vivo biological responses from whole smoke (Borgerding et al., 2005, Rodgman et al., 2003). In fact, toxicological data is available for roughly 5% of the number of components present in tobacco smoke (Rodgman et al., 2003, Rodgman et al., 2009b).
Table 1-5: Summary of lists of toxicants by Hoffmann et al. from 1986 to 2001 (Hoffmann et al., 2001b,
Hoffmann et al., 1997, Hoffmann, 1993, Hoffmann et al., 2001a, Hoffmann et al., 1990, Hoffmann et al., 1998b, Rodgman et al., 2003, Rodgman et al., 2009b).
Group Hoffmann Analyte Group Hoffmann Analyte Group Hoffmann Analyte
Polycyclic Benz[a ]anthracene N-Heterocyclic AαC Phenols Phenol
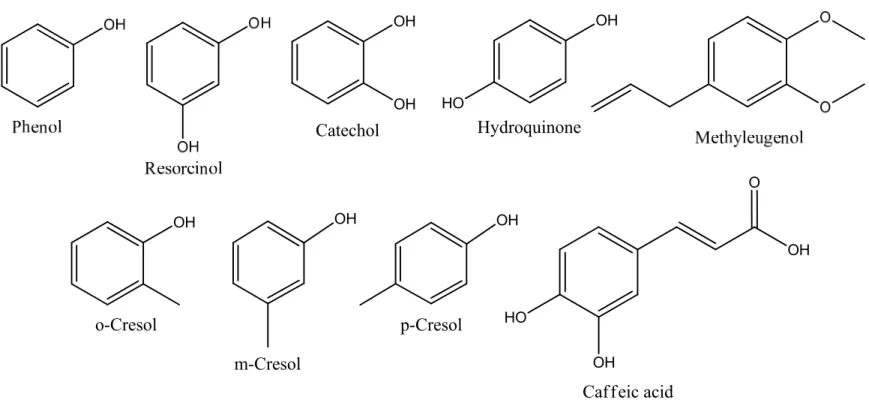
aromatic Benzo[b ]fluoranthene Amines MeAαC m+p+o- Cresol
hydrocarbons Benzo[j]fluoranthene Glu-P-1 Catechol
Benzo[k ]fluoranthene Glu-P-2 Resorcinol
Benzo[a ]pyrene PhIP Hydroquinone
Chrysene IQ Methyleugenol
5-Methyl-chrysene MeIQ Caffeic acid
Dibenz[a,h ]anthracene Trp-P-1 Chloroaromatic DDT
Dibenzo[a,e ]pyrene Trp-P-2 Compounds DDE
Dibenzo[a,h ]pyrene Aldehydes and Formaldehyde Polychlorodibenzo-p -dioxins
Dibenzo[a,i ]pyrene Ketones Acetaldehyde Polychlorodibenzofurans
Dibenzo[a,l ]pyrene Propionaledhyde Inorganic Hydrazine
Indeno[1,2,3-cd ]pyrene Butyraldehyde Compounds Hydrogen sulfide
Aza-arenes Pyridine Crotonaldehyde Arsenic
Quinoline Acrolein Beryllium
Dibenz[a,h ]acridine Acetone Cadmium
Dibenz[a,j]acridine 2-Butanone Chromium (VI)
7H -Dibenzo[c,g ]carbazole Volatile 1,3-Butadiene Cobalt
N-Nitrosamines N -Nitrosodimethylamine Hydrocarbons Isoprene Nickel
N -Nitrosoethylmethylamine Benzene Mercury
N -Nitrosodiethylamine Toluene Lead
N -Nitrosodi-n -propylamine Styrene Polonium-210
N -Nitrosodi-n -butylamine Miscellaneous Acetamide Selenium
N -Nitrosopyrrolidine Organic Acrylonitrile Additional Nicotine
N -Nitrosopiperidine Compounds Acrylamide Compounds Carbon monoxide
N -Nitrosodiethanolamine 1,1-Dimethyl-hydrazine Ammonia
N -Nitrososarcosine Maleic hydrazide Nitrogen oxides
N' -Nitrosonornicotine Methanol Hydrogen cyanide
4-(N -Methylnitrosamino)- Methyl isocyanate 1-(3-pyridyl)-1-butanone Nitromethane
N '-Nitrosoanabasine 2-Nitropropane
N '-Nitrosoanatabine Nitrobenzene
N -Nitrosomorpholine Vinyl chloride
Aromatic Amines Aniline Ethyl carbamate
2-Toluidine Ethylene oxide
2,6-Dimethyl-aniline Propylene oxide
1-Napthylamine Di(2-ethylhexyl)phthalate
2-Napthylamine Furan
3-Amino-biphenyl Benzo[b ]furan
Figure 1-3: Hoffmann analytes, structures of phenolic compounds found primarily in the particulate phase of cigarette smoke (Rodgman et al., 2003). OH o-Cresol OH m-Cresol OH p-Cresol OH OH Catechol OH HO Hydroquinone O OH OH HO Caffeic acid
Formaldehyde O Acetaldehyde O PropionaldehydeO CrotonaldehydeO Butyraldehyde O Acrolein O Acetone O Benzene Styrene Toluene 1,3-butadiene Isoprene
Volatile carbonyls
Volatile hydrocarbons
O
2-Butanone
Figure 1-4: Hoffmann analytes, structures of volatile carbonyls (aldehydes and ketones) and hydrocarbons found primarily in the vapor phase of cigarette smoke (Rodgman et al., 2003).
1.7.3 Traditional Approaches: in Vitro Assays
Historically, biological testing of cigarette smoke has been based on smoke generation procedures intended for product comparisons. Cigarette smoke in vivo studies involve the exposure of cigarette smoke to rodents via inhalation (Baumgartner et al., 1980) or cigarette smoke condensates to rodents by using skin painting carcinogenesis testing (Walaszek et al., 2007). This chapter has been limited to three particular in vitro bioassays used throughout the tobacco industry which have been developed by CORESTA and implemented by Health Canada (Health Canada, 2004a, Health Canada, 2004c, Health Canada, 2004b). These tests are the in vitro micronucleus test (IVMNT), neutral red uptake assay and Ames test and are all based on the exposure of cells to the particulate matter extracted by DMSO from a CFP.
The IVMNT is an in vitro genotoxicity and cytotoxicity assay used to detect compounds that induce the formation of micronuclei (i.e. small membrane bound DNA fragments) in the cytoplasm of mammalian cells at the interphase. Following exposure of cells to a genotoxic agent, the cells are stained with a fluorescent dye and the percentage of observed micronuclei is reported2. The frequency of micronuclei is visually determined and
compared between samples and controls to determine the relative genotoxicities. Furthermore, the cell viability (cytotoxicity) can also be visually determined by comparing samples and controls for relative survivals. In this thesis work, only the IVMNT was used, therefore, this assay is further described in Chapter 2.