HAL Id: dumas-01668380
https://dumas.ccsd.cnrs.fr/dumas-01668380
Submitted on 12 May 2020HAL is a multi-disciplinary open access
archive for the deposit and dissemination of sci-entific research documents, whether they are pub-lished or not. The documents may come from teaching and research institutions in France or abroad, or from public or private research centers.
L’archive ouverte pluridisciplinaire HAL, est destinée au dépôt et à la diffusion de documents scientifiques de niveau recherche, publiés ou non, émanant des établissements d’enseignement et de recherche français ou étrangers, des laboratoires publics ou privés.
management in the Ramotswa transboundary aquifer
area between South Africa and Botswana
Natacha Martin
To cite this version:
Natacha Martin. Assessing wastewater and sanitation conditions and management in the Ramotswa transboundary aquifer area between South Africa and Botswana. Engineering Sciences [physics]. 2017. �dumas-01668380�
Assessing wastewater and sanitation conditions and
management in the Ramotswa Transboundary Aquifer Area
between South Africa and Botswana
MARTIN Natacha
Promotion PARIS
Partenaires:
MEMOIRE DE FIN D’ETUDES
Mémoire présenté pour l’obtention du
Diplôme d’Ingénieur de l’ENGEES
3
Acknowledgement
This study would not have been possible without the financial support from the United States Agency for International Development. This study is conducted as part of CGIAR Research Program on Wa-ter, Land and Ecosystem and the International Water Management Institute in South Africa.
My sincere gratitude goes to Karen Villholth, my supervisor, for allowing me to be part of the project Ramotswa at the International Water Management Institute, and in turn allowing me to be of service to the community and to learn about Southern Africa. I would also like to thank Yvan Altchenko, Bonnie McGill, Manuel Magombeyi, Jonathan Otene and Girma Ebrahim for providing resources to see this project through. This study would not be realized without the support of the Department of Water Af-fairs of Botswana and the Department of Water and Sanitation of South Africa for sharing information and allowing me to visit sanitation sites.
My thanks also go to the ENGEES (Ecole Nationale du Génie de l’Eau et de l’Environnement de Strasbourg), its professors and participants, for their teaching quality. I thank particularly Sylvain Weill, my school supervisor during this internship, which gives a big attention on my work and which always took time to support me.
My family has been truly supportive of me in my pursuit of my studies. I would like to thank my par-ents for the emotional support, guidance and words of encouragement along the way.
4
Abstract
Since the eighties, the sanitation system has developed a lot in the Ramotswa Transboundary Aquifer Area between South Africa and Botswana. It was essential to protect the groundwater from sanitation in a region of water scarcity. At first, pit latrines were promoted in rural and urban areas. The efficien-cy of pit latrines depends on the construction quality and the soil characteristics. In the RTBAA, pit latrines can be considered as a direct source of nitrate pollution in groundwater by wastewater infiltra-tion because of the fractured rock soil and the high groundwater table of the Ramotswa Aquifer [1][2]. Then, between 1985 and 2000, wastewater treatment plants were introduced in urban areas such as Gaborone, Lobatse, Ramostwa and Zeerust. But, with population increase and industrial development [3][4][5], wastewater treatment plants such as oxidation ponds are not efficient to treat wastewater. Discharge of wastewater treatment plant and losses from the sewerage network are indirectly affecting the groundwater quality. A vulnerability map of the aquifer to sanitation from the DRASTIC method delimits a priority area where sanitation facilities have to be improved. In fact, more than 50% of the Ramotswa aquifer is highly vulnerable to sanitation pollution during the wet season compare to 2.5% during the dry season. Climate conditions have an impact on sanitation pollution. Moreover, potential challenges of sanitation were assessed such as industrial wastewater pollutants, water balances and transboundary water pollution issues. To improve the current situation, some recommendations are given for on-site sanitation system, wastewater treatment plant management and the development of a sustainable sanitation system.
Depuis les années 1980, le système d’assainissement s’est beaucoup développé dans la région de l’aquifère transfrontalier de Ramotswa, situé entre le Botswana et l’Afrique du Sud. Il était primordial de protéger les eaux souterraines des potentiels contaminants provenant de l’assainissement dans une région où l’eau est si rare. Tout d’abord, les latrines à fosses ont été implémentées dans les zones ru-rales et urbaines. Or, l’efficacité des latrines à fosses dépend essentiellement des caractéristiques du sol et de leur qualité de construction. Dans la zone d’étude, les latrines a fosses peuvent être considé-rées comme une source de pollution directe de l’aquifère par les nitrates. En effet, ces structures ne sont pas adaptées pour un sol rocheux fissuré et avec un niveau élevé des eaux souterraines [1][2]. Puis, entre 1985 et 2000, les stations d’épuration ont été introduites en zone urbaine, comme par exemple à Gaborone, Lobatse, Ramotswa et Zeerust. Cependant, en considérant l’augmentation de la population et le développement industriel de la région [3][4][5], les stations d’épuration telles que les bassins de lagunage ne sont pas efficaces en termes de traitement des eaux usées. Ainsi, les eaux usées traitées et rejetées en milieu naturel et les pertes sur le réseau d’assainissement sont impliquées indi-rectement dans la dégradation de la qualité des eaux souterraines. Une carte de vulnérabilité de l’aquifère par rapport à l’assainissement a été réalisée selon la méthode DRASTIC et permet de déli-miter une zone prioritaire en termes d’amélioration de l’assainissement. Selon cette étude, plus de 50% de l’aquifère Ramotswa est hautement vulnérable à la pollution issue des eaux usées pendant l’été, contrairement à 2.5% durant l’hiver. Les conditions climatiques ont donc également une influence sur cette pollution. De plus, d’autres potentiels enjeux en matière d’assainissement sont étudiés tels que la pollution des eaux usées industrielles, le bilan hydrique ou encore les enjeux de pollution d’eau trans-frontalière. Afin d’améliorer la situation actuelle, des suggestions en termes d’assainissement sont données, et tout particulièrement pour développer un système d’assainissement durable.
5
Contents
List of Figures ... 7 List of Tables ... 8 Acronyms ... 9 I. Introduction ... 10 1. Study area ... 102. IWMI and Ramotswa project ... 11
3. Methods ... 12
II. Sanitation trends in the RTBAA... 13
1. Sanitation development in Botswana side ... 14
1.1. Gaborone sanitation facilities ... 16
1.2. Kanye sanitation facilities ... 18
1.3. Ramotswa sanitation facilities ... 20
1.4. Otse sanitation facilities ... 22
1.5. Lobatse sanitation facilities ... 23
2. Sanitation development in South African side ... 26
2.1. Motswedi sanitation facilities ... 27
2.2. Lehurutshe sanitation facilities ... 28
2.3. Zeerust sanitation facilities ... 30
2.4. Wastewater treatment plants of the Department of Public Works ... 32
3. Conclusion ... 33
III. Challenges ... 34
1. Vulnerability to pollution of the aquifer and priority areas ... 35
2. Industrial pollution ... 42
3. Surface and groundwater transboundary pollution ... 43
3.1. Surface water pollution ... 44
3.2. Groundwater pollution... 45
4. Water balances ... 47
5. Climate change ... 50
IV. Recommendations and opportunities ... 53
1. On-site sanitation improvement ... 53
1.1. Recommendations for on-site sanitation ... 53
1.2. Grey water management ... 55
2. Wastewater treatment efficiency ... 56
6
2.2. Sludge treatment and reuse ... 58
3. Reuse of wastewater ... 60 3.1. Quality issue ... 61 3.2. Quantity issue ... 62 4. Social involvement ... 64 V. Conclusion ... 66 Bibliography ... 67
Appendix 1: Pictures of Glen Valley WWTP, Gaborone ... 75
1.1. Glen Valley inlet works ... 75
1.2. Comparison of the two phases in Glen Valley WWTP: A) Clarifier in the second phase, B) Clarifier in the first phase ... 75
Appendix 2: Interview of Mr. Lekgaba, manager of Glen Valley WWTP on 2nd February 2017 ... 76
Appendix 3: Report of the interview of Mr. Mareme, manager of Ramotswa WWTP on January 2017 from Bonnie McGill ... 77
Appendix 4: Interview of Mr. Mareme, manager of Ramotswa WWTP on 30th January 2017 ... 78
Appendix 5: Ramotswa WWTP samples analysis ... 79
Appendix 6: Interview of Mr. Khan, manager of Lobatse WWTP on 1st February 2017 ... 80
Appendix 7: Lobatse WWTP samples analysis ... 81
Appendix 8A: Treated wastewater discharge standards ... 82
Appendix 8B: Drinking water standards ... 83
Appendix 8C: Irrigation standards for unrestricted irrigation ... 84
Appendix 9: WWTP in the RTBAA ... 85
Appendix 10: Mass balances between water supply and wastewater treated ... 88
Appendix 11: Conversion method of evaporation to evapotranspiration ... 90
Appendix 12: Conceptual model of a karst aquifer [105] ... 90
Appendix 13: Spatial distribution of sum of nitrate and nitrite in the RTBAA [59] ... 91
Appendix 14: Monthly and annual average calculation of natural recharge ... 92
Appendix 15: Rainfall and evaporation trends ... 92
Appendix 16: Introduction translated in french ... 98
1. Présentation de la zone d’étude ... 98
2. Présentation de la structure d’accueil: l’International Water Management Institute ... 100
3. Méthodes employées ... 100
7
List of Figures
Figure 1: Map of the Ramotswa Transboundary Aquifer Area. ... 11
Figure 2 : Localization map of WWTW in the RTBAA. ... 14
Figure 3: Schematic of the water supply area in Botswana [2]. ... 15
Figure 4: Map of WWTW in Gaborone. ... 16
Figure 5: Glen Valley WWTP map. ... 17
Figure 6: WWTW in Kanye, Southern District, Botswana. ... 19
Figure 7: Sanitation system and pollution in Ramotswa. ... 20
Figure 8: Sewage flow in Ramotswa WWTP. ... 21
Figure 9: Map of Otse sanitation facilities. ... 22
Figure 10: A) Map of Lobatse; B) Zoom on Lobatse WWTP; C) Zoom on BMC pre-treatment. ... 24
Figure 11: Map of the place where samples were collected in Lobatse WWTP. ... 25
Figure 12: Map of Lehurutshe. ... 28
Figure 13: Map of the Lehurutshe Wastewater Treatment Plant. ... 29
Figure 14: Location map of Zeerust WWTP. ... 30
Figure 15: Design of Zeerust WWTP. ... 31
Figure 16: A) Zeerust WWTP compliance in 2012 - 2013 [23], B) E. Coli analysis in Zeerust WWTP discharge [26], C) COD analysis in Zeerust WWTP discharge [26], D) Ammonia analysis in Zeerust WWTP discharge [26], E) Nitrate analysis in Zeerust WWTP discharge [26], F) Suspended Solids analysis in Zeerust WWTP discharge [26]. ... 32
Figure 17: Map of the area with comprehensive knowledge of sanitation conditions. ... 33
Figure 18 : Flow direction in the Ramotswa Transboundary Aquifer. ... 37
Figure 19: Location map of rainfall and evaporation stations. ... 38
Figure 20 : Vulnerability map for groundwater pollution: A. during the rainy season from October to March; B. during the dry season from April to September. ... 41
Figure 21: Map of biggest industrial activities in the RTBAA. ... 42
Figure 22: Simplified scheme of transboundary pollution in the RTBAA. Not to scale. ... 44
Figure 23: A. Identification of surface water pollution in Lobatse area; B. Picture of the stream from Lobatse WWTP discharge; C. Picture of Peleng River. ... 45
Figure 24: Spatial distribution of the total dissolved solids in the TBA [59]. ... 46
Figure 25: The fate of nitrate from sanitation in the environment. ... 46
Figure 26: Spatial distributions of E.Coli and total coliforms, respectively on the left and on the right [59]. ... 47
Figure 27: Scheme of water balances in the RTBAA. ... 48
Figure 28: Scheme of the water consumption and wastewater according to their sanitation facilities in the RTBAA. ... 48
Figure 29: Range of losses on the sewage network in the RTBAA. ... 49
Figure 30: Unmanaged grey water and wastewater infiltrating from on-site sanitation in the RTBAA. ... 50
Figure 31: Annual average natural recharge. ... 51
Figure 32: Rainfall trends from 1988 to 2016 in the RTBAA. ... 52
Figure 33: Evaporation trends from 1988 to 2016 in the RTBAA. ... 52
Figure 34: Scheme of greywater management column [74]... 55
Figure 35: Drying bed scheme [76]. ... 59
Figure 36: Map of wastewater treatment plant and irrigated areas. ... 63
Figure 37: Summary scheme of a sustainable sanitation system in the RTBAA. ... 65
8
List of Tables
Table 1: Sanitation facilities in the Botswana side of the RTBAA in 2001 and 2011 [3]. ... 15
Table 2: Sanitation facilities in Ramotshere Moiloa Local Municipality in the last past 20 years [5, 10, 11, 12]. ... 27
Table 3 : Sanitation facilities in Motswedi, 2011 [5]. ... 27
Table 4: Sanitation facilities in Lehurutshe [5]. ... 29
Table 5: Statement of sanitation in the RTBAA. ... 34
Table 6: Weight of parameters for the DRASTIC method. ... 36
Table 7: DRASTIC classification of the water table depth. ... 36
Table 8: DRASTIC classification of the recharge. ... 38
Table 9 : DRASTIC classification of thickness. ... 39
Table 10: DRASTIC classification of slope. ... 40
Table 11 : DRASTIC classification of the permeability rocks in the vadose zone [38]. ... 41
Table 12: DRASTIC classification of hydraulic conductivity. ... 41
Table 13: Wastewater pollutants from industrial activities. ... 43
Table 14: Details of on-site sanitation improvement [63; 68; 69; 70]. ... 54
Table 15: Recommendations for WWTP with high risk of polluting the environment [25; 26; 76; 77][Appendixes 3; 4; 6; 9]. ... 57
Table 16: Hydraulic retention time and removal in function of type of pond [76]. ... 57
Table 17: Quantity of sludge produced in WWTP per day [83]. ... 58
Table 18: Technical and design details for drying beds [86]. ... 60
Table 19: Design details for Ramotswa faecal sludge management. ... 60
Table 20: Recommendations from the World Health Organization for irrigation with wastewater [93]. ... 61
Table 21: Impacts of pollutants on the irrigation scheme [94]. ... 62
9
Acronyms
BMC
Botswana Meat Commission
BOD
Biochemical Oxygen Demand, unit : mg/L
BOBS
Botswana Bureau of Standards
CBD
Central Business District
COD
Chemical Oxygen Demand, unit : mg/L
DO
Dissolved Oxygen
DWA
Department of Water Affairs, Botswana
DWAF
Department of Water Affairs and Forestry, South Africa
E1
Natural estrogen estrone
E2
Natural estrogen estradiol
E3
Natural estrogen estriol
EC
Electrical Conductivity
E. Coli
Escherichia Coli
EE2
Synthetic estrogen ethinylestradiol
EFR
Environmental Flow Requirement
mamsl
Metres Above Mean Sea Level, unit
NAFTEC
National Food Technology Research Centre, Kanye, Botswana
NDP
National Development Plan
NTU
Nephelometric Turbidity Unit
RBC
Rotating Biological Contractor
RMLM
Ramotshere Moiloa Local Municipality, North West Province, South
Af-rica
RTBAA
Ramotswa Transboundary Aquifer Area
SAT
Soil Aquifer Treatment
SBR
Sequential Batch Reactor
SHHA
Self Help Housing Agency
SS
Suspended Solids, unit : mg/L
TBA
Transboundary Aquifer
TCU
True Color Unit
TDS
Total Dissolved Solids
TOC
Total Organic Carbon
TON
Threshold Odor Number
US EPA
United States Environmental Protection Agency
WAS
Waste Activated Sludge
WHO
World Health Organization
WUC
Water Utilities Corporation, Botswana
WWTP
Waste Water Treatment Plant
10
I.
Introduction
Scarce and seasonal surface water supplies have rendered the population heavily reliant on groundwa-ter resources in the area of the Ramotswa aquifer in the Upper Limpopo. Given the reliance on groundwater, it is critical that the quality of such water be ensured to avoid adverse health impacts. However, evidences sources suggests that conditions in Botswana and South Africa have driven in-creased adoption of on-site sanitation, conditions which have elsewhere led to pollution [6;7]. It is therefore critical to assess current water quality and pollution risks in the Ramotswa Transboundary Aquifer Area.
Despite some investigations into water quality and pollution in the region, an aquifer-oriented assess-ment has not been undertaken. Some hydrogeological investigations have been undertaken in the Ra-motswa and Lobatse wellfields, respectively by Beger [8] and Staudt [9]. These reports give an identi-fication of the Ramotswa Transboundary Aquifer on the Botswana side and assess the groundwater as polluted by nitrate. Studies were limited on the Botswana side compare to this study which is address-ing by givaddress-ing attention to both sides. Ranganai et al. [1] also reported the extremely vulnerability of groundwater in the Ramotswa wellfield to pollution due to various anthropogenic activities as septic tanks, pit latrines, wastewater discharge and dumpsites. These reports indicate that sources of pollution coexist at practically the same depth as the groundwater table. The characteristic of the aquifer and the soil, such as the depth of the water table and nature of the soil matrix, are the key parameters affecting groundwater pollution.
The present study assesses the impacts of sanitation systems on groundwater quality in the Ramotswa Transboundary Aquifer Area between South Africa and Botswana. Sanitation information is collected by document analysis, interviews and wastewater sampling. A GIS map is established to determine vulnerability areas and sources of pollution. Results from this assessment are used to propose achieva-ble recommendations taking into account of social, climate and economy conditions of the two coun-tries. Wastewater is the “new water” for water scarcity areas, some alternatives for the reuse are pro-posed for agriculture, groundwater recharge and domestic reuse.
1. Study area
The study is undertaken in the Ramotswa Transboundary Aquifer Area (RTBAA) between Botswana and South Africa. The RTBAA straddles the border between both countries. The delineation of the RTBAA is the Gaborone dam catchment but this study is focused on the Gaborone dam catchment extended on the district’s boundaries for both sides. The Botswana side is formed of South East Dis-trict, south east part of Southern District. This area of Botswana is the most densely populated. The capital Gaborone and Lobatse lie in this district. This part of the study is dominated by urban devel-opment with high economic growth. Ramotshere Moiloa Local Municipality in the North West Prov-ince composes the South African side of the study area. This local municipality occupies an area of 7193 km² and has a stalling economic growth and a low population density. The main urban area is Zeerust.
11 Figure 1: Map of the Ramotswa Transboundary Aquifer Area.
The RTBAA has a semi-arid climate. There are two seasons in the year. Winter is characterized as the dry season with high evaporation level and lasts from April to September. In contrast, from October to March is the wet season which is called summer. Rainfall happens during this season. Average annual temperatures range between 18 and 20°C.
The Ramotswa aquifer is located in the Ngotwane sub-catchment in the Upper Limpopo River Basin. Geologically, the study area is within the western part of the Transvaal Supergroup in Kraapvaal Cra-ton. The main water-bearing unit of the RTBAA is dolomitic. The Ramotswa Dolomite is intruded by three vertical dikes which create compartments. The Ramotswa Dolomite aquifer is fractured and has karst areas with high transmissivity and storativity. Rainfall recharges the aquifer. The median depth to the groundwater table is 9 meters and there are 0 to 12 meters of surface unconsolidated sediment [2]. The quality of groundwater is critical in the Ramotswa Transboundary Aquifer given its use for agriculture (69%), industry (1%) and especially drinking water purposes (30%) [2].
The RTBAA extends on 10533 km² and has a population of 534788 in 2011. Actually, 50% of the population in the RTBAA is connected to a sewage network. But, more than 50% of the population has on-site sanitation because of the climate conditions. During a drought, people are not able to flush toilets, they use on-site sanitation. In urban areas, on-site sanitation is more or less well maintained and dislodged in the inlet of wastewater treatment plant. In rural areas, on-site sanitation is maintained according to funding of households. Human activities are mostly agricultural in this area. Groundwater is also used for irrigating crops or watering cattle.
2. IWMI and Ramotswa project
The International Water Management Institute leads the Ramotswa Transboundary Aquifer Area pro-ject in partnership with the Department of Water and Sanitation in South Africa, the Department of Water Affairs of Botswana, Limpopo Watercourse Commission, Southern African Development Community, and the universities of the area. The International Water Management Institute is a non-profit and scientific research organization focusing on the sustainable use of water and land resources
12 in developing countries of Africa and Asia. The Ramotswa project was developed in 2015 to support management and cooperation on the shared groundwater resources of the upper Limpopo region in order to reduce poverty, inequality and insecurity. Main objectives of the project are to understand the socio-economic importance of the aquifer area, assess the feasibility for managed aquifer recharge, establish cooperation between both countries, and improve management and monitoring of the re-source. A stakeholder platform, a strategic action plan for the development and management of the aquifer, a transboundary diagnostic analysis, training material on transboundary diagnostic and an information management system (RIMS – IGRAC) are expected as key outputs by the end of the Ra-motswa project.
3. Methods
This research is led by five steps: document analysis, statistics on water balances and population, in-terviews and visits, modelling map and identification of challenges.
i) Document analysis
Most of the documents analyzed are policy documents and environmental reports from Department of Water Affairs in Botswana, Department of Water and Sanitation in South Africa, institutions in the transboundary area and previous work in the area such as hydrogeology reports from Michael Staudt [9] and Katharina Beger [8]. Document analysis is realized in a chronological order and by categories to update and complete information on each sanitation system. Documents are classified at first by country and then in five subcategories such as wastewater treatment plants, on-site sanitation condi-tions, hydrogeology assessment, settlement activities and development plan for the environment.
ii) Statistics on water balances and population
Census of South East district [3] and Southern district [4] of Botswana of 2001 and 2011 and census of North West province of 1996 [10], 2001 [11], 2011 [5] and 2016 [12] were collected. They are used to assess population growth rate, consumption of water per household and development of sanitation system over time.
iii) Interviews and visits
Visits in the field permit to collect interviews of workers in wastewater treatment plants of Lobatse, Ramotswa and Gaborone [Appendixes 2, 3, 4, 6] and wastewater samples [Appendixes 5, 7]. Inter-views are undertaken to assess the capacity and the treatment of wastewater facilities, to assess the potential impact of wastewater discharge on the environment and to know the trends for on-site sanita-tion. Interviews correct or confirm information contained in documents contents. No interview is available from the South African side.
iv) Modelling map
Visits and document analysis help to create a GIS map of the area. The aim of this map is to locate the most vulnerable part of the RTBAA for pollution. A DRASTIC (Depth to groundwater, Recharge, Aquifer media, Soil media, Topography, Impact of the vadose zone, Conductivity) method is used for modelling.
v) Identification of challenges
After these four primary steps were achieved, an assessment of sanitation in Botswana and in South Africa is realized. This assessment compiles every information in a chronological order. Five chal-lenges are identified by combining and comparing information from the different steps:
13 - Priority areas: the modelling map points out priority areas to work on sanitation improvement. These areas are selected according to their vulnerability to pollution depending on climate conditions, settlements, activities and soil characteristics.
- Industrial wastewater: document analysis and visits allow to assess the river quality and the wastewater quality from wastewater treatment plants. High concentration rate of some pollu-tants (heavy metals, oil and grease, and chemical oxygen demand) does not just come from domestic wastewater. Industrial activities are involved in deteriorated wastewater quality. Biggest industrial activities in the study area and their major pollutants are identified.
- Transboundary pollution: quality assessment and modelling map lead to focus on the trans-boundary pollution. Surface water and groundwater pollution are linked based on document analysis.
- Water balances: statistics on water balances and population show water consumption and number of sanitation system increasing which mean leakage and losses increasing. Water bal-ances are quantified based on statistics.
- Climate change: interviews and documents report some variation of quality and quantity of wastewater with seasons. Climate change impact on sanitation is studied based on rainfall and evaporation record from the Department of Water and Sanitation of South Africa and the De-partment of Water Affairs of Botswana.
Once the challenges established, recommendations and opportunities for sanitation improvement are given. Sanitation systems improve with better treatment efficiency or on-site sanitation adapted to the area. Treated wastewater can benefit water bodies by recharge or reuse.
II.
Sanitation trends in the RTBAA
Sanitation trends in the RTBAA are studied in the Botswana side and then, in the South African side. In fact, Botswana and South Africa have not developed water acts and development plans at the same time. The installation of sanitation in the last past years is different between the two countries. How-ever, the main challenge is the same for both: protect groundwater from sanitation pollution. The study area has twenty one wastewater treatment works in operation and 91000 on-site sanitation facilities, presented below in Figure 2.
14 Figure 2 : Localization map of WWTW in the RTBAA.
1. Sanitation development in Botswana side
In Botswana, the Urban Sanitation Research Project promoted the use of pit latrines in urban areas in 1976. This project was extended for rural areas in the eighties with the Environmental Sanitation and Protection Pilot Project. But, the lack of skills in latrine construction and the affordability where, in some cases, the households were not prepared to play their part and complete top structures, caused groundwater pollution in the area.
In fact, in Botswana the construction of pit latrines is controlled as explained below:
- a household wanting to participate in the project would enroll and pay a deposit of P30, - the household would then excavate a pit to dimensions provided. The project team would
as-sist with a jackhammer if the ground was unpickable,
- the council would then construct the substructure together with the concrete slabs at ground level,
- the householder would then build the superstructure with advice from the project team if nec-essary,
- the project team then installs the vent pipe, fly screen and seat.
In 1986, major urban centres of Gaborone and Lobatse reported a sewerage coverage of 38% and on-site sanitation coverage of 55%. In the major rural villages sanitation coverage was around 30-40% and minor villages and locations virtually zero coverage. In 1991, a study was commissioned to assist the government in designing a National Rural Sanitation Programme. In 2001, 77% of the households in Botswana had access to adequate sanitation [13]. In the Botswana side of the RTBAA in 2011, 95% of the households had access to adequate sanitation.
15 2001 2011 Population 390023 474860 Household 84154 139641 Flush toilet 42776 69892 Pit latrine 29014 56481 VIP 25705 5448 Enviro-loo toilet 454 - Dry compost - 444 None 8243 7375 Unknown 50 -
Table 1: Sanitation facilities in the Botswana side of the RTBAA in 2001 and 2011 [3].
In the RTBAA, after 1996, most of the water supply came from water surface, such as Gaborone, Mo-latedi and Nnywane Dams. Ramotswa wellfield was closed because of the high amount of nitrate con-centration which came from pit latrines and caused some cases of blue baby syndrome. But, Botswana knows dry seasons and water usage is increasing for livestock watering and irrigation. Moreover, the distribution network is old and experiences frequent pipe failure, which increases the water losses. Dams are not enough to provide water. In 2014, Ramotswa wellfield was re-opened for pumping as an emergency measure. Nowadays, Ramotswa, Otse, Lobatse, Ranaka, Lekgolobotlo, Magotlhwane, and Molapowabojang receive water from Gaborone waterworks blended with water from the wellfields in the area, such as presented in Figure 3. Because of the groundwater pollution, the wellfield water has to be diluted with water from Gaborone, Molatedi and Nnywane Dams. When there is no water from the dam, the water is restricted in the villages. This phenomenon explains why people have pit latrines even if they use toilets connected to the sewage.
16 Between 2008 and 2013, the government of Botswana launched a program Water Sector Reforms. This program was to redefine and change the roles of institution and major stakeholders. From 2011, WUC takes over the operation of wastewater networks in Botswana. Then, from 2013, the operation of the WUC includes vacuum tanker services to pit latrine and septic tanks.
1.1. Gaborone sanitation facilities
Gaborone is the capital of Botswana with a population of 231 592 in 2011 [3] which represents around 10% of the population of Botswana. The sanitation system is quite impressive in Gaborone compare to the other towns in the country. WWTW are located in the Figure 4.
Figure 4: Map of WWTW in Gaborone.
Seven primary trunk mains allow collection of wastewater from all of the defined Gaborone city area, Tlokweng and Mogoditshane, with all the recently low cost areas connected. Unsewered areas are the SHHA areas in Old Naledi, Bontlend and Broadhurst. They were planned to be sewered in NDP 9, between 2003 and 2009. Problems such as blockages and pipe failures are encountered in the older areas of the city, especially in the Central Gaborone Area [13]. The older areas of the city are still us-ing latrines and tank system.
Glen Valley WWTP treats all wastewater generated in Gaborone and adjacent connected areas. It em-ploys an activated sludge process with polishing of the effluent in the Broadhurst and Phakalane ponds, which are called “Gaborone Ponds” in Figure 5. Effluent discharges into the Ngotwane River
17 from either these pond systems or are reused for irrigation, it depends on the effluent quantity and the needing for irrigation. Most of the effluent is used for irrigation.
Figure 5: Glen Valley WWTP map.
Influent is largely domestic with industrial component. The WWTP is composed of an inlet work with mechanically raked screens, flow measurement and grit chambers, presented in Appendix 1.1.; a pri-mary settlement; an activated sludge reactor with surface aerators and secondary settling tanks; sludge handling with sludge thickening, anaerobic digestion and drying beds; maturation ponds for polishing and disinfection.
The first phase was built in 1996 and designed to treat an average dry weather flow of 40 000 m3.d-1, with current inflow of 34 000 m3.d-1. In 2003, inflow represented 52 % of water supplied to the area. The first phase was designed for influent of 1000 mg.L-1 COD, 500 mg.L-1 BOD, 400 mg.L-1 SS. But the raw sewage exceeded the design and impacted on downstream performance. The possible reason of the impact is coming from higher industrial load or malfunctioning of thickeners. The plant is equipped with a laboratory for monitoring COD, BOD, SS, NH3, PO4.
The second phase in 2001 was designed for a total of 90 000 m3.d-1 of inflow. As it can be seen in Appendix 1.2., the second phase is not fully used but the current inflow has improved because of the immigration to the capital. Septic tanks and pit latrines are also dislodged in the current inflow of the WWTP before the screens. The current inflow is around 65 000 m3.d-1.
Preliminary daily solid balance of waste activated sludge handling system is maintained by sludge from WAS & digested primary applied to drying beds. The stabilized sludge has in the past been
re-18 moved to the local sanitary landfill but since the commissioning of the new plant in 2001, sludge has accumulated around the drying beds.
Final polishing provides for die off of bacteria to levels far lower. No bacteriological and limited PO4
analyses are available for this part of process.
Reuse of treated effluent is for irrigation of golf courses and cultivation of crops. 203 hectares of land are irrigated. The water is pumped by the Department of Agriculture of Botswana. Wastewater are used to irrigate tomatoes, butternut and spinach crops. The discharge has a good compliance for irriga-tion [Appendix 2]. Glen Valley WWTP is used in this report as an example of reuse.
Gaborone has two other WWTW located off-center which are in Mokolodi Nature Reserve and in Saint Joseph’s College. In Mokolodi Nature Reserve, wastewater is treated in a wetland. Wastewater comes from the lodges in the area and treats 10 m3.d-1 with good efficiency. In Saint Joseph’s College, the sanitation treatment system is ponds and treats wastewater of 1260 students and 140 teaching staff since 1996. 100 m3.d-1 of wastewater are treated in septic tank, facultative pond and aerobic ponds. 40 m3.d-1 of effluent is discharged into Gaborone dam with good compliance.
Tlokweng is a village adjacent to Gaborone in the South East District of Botswana. The population was 37 340 in 2011 [3]. It is considered as a part of Gaborone for the sanitation system because almost all of Tlokweng is sewered and treated in Glen Valley WWTW. Just Tlokweng Technical Training Centre has its own WWTP which is a wetland system with a nitrification tower built in 2002. Wastewater treated is reused for watering sport fields.
1.2. Kanye sanitation facilities
Kanye is a town located 83 kilometres south west of the capital Gaborone. It is the administrative cen-tre of the Southern District with a population of 52 323 inhabitants [3]. Kanye water supply boreholes are located in Kgwakgwe wellfield lying to the south west of the village. Majority of households have access to water through a yard and standpipe. But, no sewerage facility is available. CBD and Rural Administration Centre are connected to septic tank and soak away systems. Kanye Development Plan envisaged VIP and pit latrines remained as the most appropriate system for sanitation village but there are polluting the groundwater. Six WWTW exist in the town for industrial and education settlements as shown on the map Figure 6.
19 Figure 6: WWTW in Kanye, Southern District, Botswana.
The Seventh – Day Adventist Hospital WWTW are rotating biological contactors treatment. It serves the hospital which hosts 120 patients and 300 staff members. In the plant, there are an inlet structure with bar screen, septic tank, biodiscs in series, humus tank and disinfection. The plant capacity is 20 m3.d-1 and the system is well managed. All effluent is reused for gardens.
Kanye prison and Sejelo police station WWTP is a wetland system with anaerobic rock filter built in 1997. The wetland was designed for 25 m3.d-1, but the current inflow is about 30 m3.d-1. Effluent is used for irrigation of vegetables garden with a good quality.
Kanye Education Centre Ponds were constructed and completed in September 2001. Eight pump sta-tions transfer the sewage. No effluent is produced because of the operation. System is composed of screens, grit chambers, anaerobic ponds, facultative ponds, aerobic ponds. The plant was oversized because the full capacity is 106 m3.d-1, but the current inflow is 50 m3.d-1.
Ramatea Vocational School WWTP was built in 1998 as a wetland system. The current outflow pro-duced is 14 m3.d-1 and presents a good quality.
No quality data was provided from the NAFTEC. Wetlands were built in 2000 and the current inflow is equivalent to the design capacity such as 10 m3.d-1.
Seepapitso Senior Secondary School WWTW are oxidation ponds designed for 400 students. But, the present number of students is around 1500, plus 200 staff members and around 60 staff houses. Sew-age overflows into natural water course because the ponds capacity is not enough. The plant is com-posed of septic tanks, facultative ponds and aerobic ponds. Ponds are cement lined, and there is no maintenance. Raw sewage is spilled from last manhole before entering primary septic tank and flowed
20 into facultative pond. Spillage results in short circuiting the facultative pond and emanates in very green algae in facultative pond with no flow condition. The treatment is excellent. There is no measure data available, and changes as septic tank being dislodged on a regular basis should be done. Effluent flows eventually into the river when there is not enough evaporation [13].
Kanye pollution is coming from the lack of sewage network in the town. Most of the population is using VIP and pit latrines which are infiltrating the aquifer because of the lack of management and skills in constructing on-site sanitation.
1.3. Ramotswa sanitation facilities
Ramotswa is a town located in South East District of Botswana, southwest of the capital of Gaborone. The population was 30 382 in 2011 census [3] with 6 993 households. Sanitation system in Ramotswa depends on water supply system from Gaborone.
The main sanitation systems in Ramotswa are, first VIP and pit latrines because of water restriction, secondly sewage network. The town is served by 150 km of sewers, two pump stations and a 3000 m3.d-1 WWTW extended on 23 hectares [13]. The sewage network is developed in the new areas of the town, circled in yellow in Figure 7. In the town center, which is the old area, people are gradually connected to sewage network but it depends on the cost. In Ramotswa, every household has latrines system. In brief, 60 % of population use flush toilets connected to the sewage network in the town, 15% use flush toilets connected to septic tank and 20% to 25% use VIP and pit latrines [Appendix 3].
21 Figure 7 shows that most of the boreholes are near the sewage network in the east side of the town. Pollution of the groundwater might come from losses in the sewage network which are infiltrating the aquifer and the concentration level of latrines in the area. The groundwater flows to the north-east, so pollution can be detected in the water from the boreholes of Ramotswa.
Ramotswa WWTP was built in 1981; then, it was upgraded in 2001 because of population increasing. The second phase is used when the first phase is full. The capacity design is 3000 m3.d-1, but the cur-rent inflow is around 1500 m3.d-1. It is increasing during the rainy season. There is no effluent current-ly produced during the dry season. The outflow is estimated around 600 m3.d-1. Vacuum tanker dis-charge bay, manually-raked screens, grit chambers, flume with no flow measurement and ponds form the plant. Flow splits towards the old system from 1981 which is compounded of one anaerobic, two facultative and four maturation ponds, and the new system composed of two primary anaerobic ponds, two secondary anaerobic ponds, one facultative and three maturation ponds. All the ponds are plastic lined. Overflow from final pond is supposed to flow into a woodlot planted with eucalyptus when there is excess, such as presented in Figure 8 [13]. Otherwise, during winter, ponds system is working as an evaporation system [Appendix 4].Wastewater treated runs off to the Ngotwane River and/or infiltrates the aquifer. Because of this, the quality of the wastewater treated has to be monitored. The quality of wastewater is presented in Appendix 5.
Figure 8: Sewage flow in Ramotswa WWTP.
The inflow of Ramotswa WWTP was tested twice. The inflow from 31st January was grey with an important flow, contrary to the inflow of 2nd February which was dark and sandy with a low flow. Moreover, the second inflow is really concentrated in suspended solids, oil and grease and ammonia. This quantity of oil and grease does not come from domestic wastewater. Fat contributes between 3%
22 and 8% of the wet weight of feces [14]. The concentration of oil and grease in an untreated domestic wastewater is not higher than a range between 50 to 100 mg.L-1 compare to Ramotswa wastewater which is more than 1000 mg.L-1 [15]. This high amount of concentration comes from industrial wastewater such as Bolux Milling, Higro feeds, and Ramotswa Glass Works. High amount of oil and grease includes physical blockages in sewers, pumps and screens. It reduces oxygen transfer rate, so the degradation of suspended solids and BOD is not totally efficient in facultative ponds. This phe-nomenon might explain the non-compliance of the outflow to the standards BOBS 93:2012 for COD, BOD and ammonia. Nitrogen is still present under the form of ammonia in the discharge, but with good conditions ammonia is oxidized in nitrate and nitrite, which can contaminate the river and the aquifer. Lastly, these samples were collected during the rainy season when the wastewater is diluted. The quality is considered worst during the dry season.
The main problem of the plant is the evaporation. In fact, the plant was not designed for evaporation but in reality, there is no effluent produced during most of the dry season. The residence time in the ponds is not respected, it is one of the reasons of the poor wastewater quality. Secondly, maintenance is the key to improve the quality such as flow measurement or sludge care mentioned in Appendix 4. Finally, treatment by ponds is not efficient for industrial wastewater. A pre-treatment of the wastewater should be done by the industry.
1.4. Otse sanitation facilities
Otse is located 60 km south of Gaborone in the South East District. The population was 7976 in 2011 census [3]. The main sanitation system in the area is on-site sanitation. But, two wastewater treatment plants in the village are used for the Police College and Moeding College. The sanitation system of the area is presented in Figure 9.
23 Otse Police College WWTP was commissioned in 2001. It is the biggest WWTP using rotating biolog-ical contactors in Botswana and is operating under design capacity, such as 200 m3.d-1 instead of 260 m3.d-1. The primary treatment sewage is achieved by means of septic tank and followed by biological treatment in rotating biodiscs units. Humus tanks downstream of the biodiscs are provided for effluent clarification. The effluent is disinfected before storage in a holding pond. 200 m3.d-1 of effluent pro-duced are reused for college gardens and sport complex. The excess of effluent overflows to an infil-tration field [13].
Moeding College WWTP is similar to the police college WWTP and was built in 1998. Differences between the two WWTW are biodiscs: there are smaller in Moeding College WWTW. This plant serves 1800 students and staffs members, which represents a full inflow capacity of 50 m3.d-1. The pre-treatment operates in septic tank, followed by organic removal in rotating discs. Effluent is clarified in humus tanks followed by disinfection. The excess overflows from the pond to nearby environment where cattle drink from [13].
Lastly, the first concern of the area is the use of on-site sanitation because of the population density and the proximity of tributaries of Ngotwane River. In fact, the poor design of latrines and septic tank, and the lack of maintenance, impact on the water quality. Raw sewage infiltrates the aquifer or is spilled to the tributaries.
1.5. Lobatse sanitation facilities
Lobatse is an administrative town in South East District of Botswana, 70 kilometres south of the capi-tal Gaborone. According to the 2011 census [3], the population of Lobatse is around 29 007 inhabit-ants. Few industries are located in this town such as BMC, Lobatse Tiles, Lobatse Clay Works, sugar packaging industries, brewery and milling.
62% of Lobatse are sewered inclusive of all institutions, government facilities and the town centre. In Peleng, Tsopeng and Woodhall areas, presented in Figure 10A, on-site sanitation technologies are being used. These pits and septic tanks have been sealed to prevent contamination of the aquifers and are emptied by vacuum tanker. All new development is connected to the sewer system, including low cost housing areas. In March 2017, 3642 households connected to the sewage network, 1700 pit la-trines, and 800 septic tanks were identified. To summarize pit latrines are used by 25% of population; flush toilets are used by 75%, but 25% are evacuated in septic tanks and 50% are evacuated in the sewage network.
24 Figure 10: A) Map of Lobatse; B) Zoom on Lobatse WWTP; C) Zoom on BMC pre-treatment.
The plant, presented in Figure 10B, was built in 1989, upgrading in 1995 because of the population increasing. There will be no need to increase the capacity because Lobatse has a slow population de-creasing with the emigration to other economic centres. The plant is composed of 14 ponds which are divided in 3 primary anaerobic ponds, 2 secondary anaerobic ponds, 6 facultative ponds and 3 matura-tion ponds [Appendix 6].The plant was designed for treating 6200 m3.d-1 domestic and industrial wastewater with provision for future flows allowed 9500 m3.d-1. Effluent from ponds were reused on 40 ha Lucerne production by private contractor.
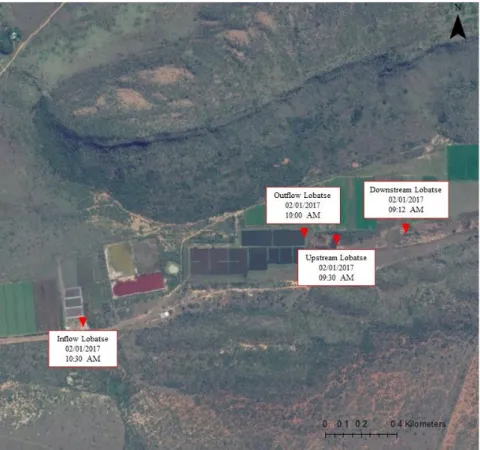
The efficiency of the treatment was tested. Samples of the inflow and outflow of Lobatse WWTW have been collected, as well as samples of upstream and downstream of the river. The place where each sample was collected is presented in Figure 11. Wastewater quality is available in Appendix 7.
25 Figure 11: Map of the place where samples were collected in Lobatse WWTP.
The inflow is high in BOD, COD, SS and ammonia. The treatment removed most of the pollutants but the outflow is not compliant to BOBS 93:2012 for ammonia and COD. Nitrogen is present in the form of organic nitrogen and ammonia because the wastewater is freshly polluted. But, natural biochemical process converts ammonia into nitrite then nitrate, which are flowing to Ngotwane Dam. Moreover, the concentration level of coliforms is quite high (1280/100 mL) even if it is compliant to the stand-ards of BOBS 93:2012. Stricter rules were applied in the standstand-ards BOBS 93:2004. It has to be noticed that these samples have been collected during the rainy season. The quality is normally better during this season because the effluent is diluted. Discharge, upstream and downstream river can be also compared to prove if cattle may have an impact on the water quality. In fact, COD, SS and coliforms are increasing downstream, so cattle defecating and the cemetery near the river are involved in the pollution of Ngotwane Dam, such as mentioned during the interview with the manager of Lobatse WWTP [Appendix 6].
In any case, effluent water quality is in accordance with application criteria BOBS 463:2011 as stipu-lated by DWA for irrigation purposes on fodder crops, nuts and citrus fruit trees [Appendix 8C]. Pollution might come from the BMC pre-treatment, presented in Figure 10C, established in 1978. The BMC plant capacity is 170000 cattles per year, including water used to wash down equipment and 2.3 m3 of water per head of cattle per day. The design capacity is 1700 m3.d-1. The main waste from an abattoir is blood, fats and rumen contents. The BMC WWTP is a wastewater pre-treatment system with anaerobic ponds followed by trickling filter but it is not enough to treat the raw wastewater. After the pre-treatment, wastewater is flowing to Lobatse WWTP. Pollution occurred in Peleng River due to three reasons:
- Pumping of wastewater, sludge and disposal of fats, oil and grease into the sludge pits which are unlined pits in river alluvium,
26 - Spillage from BMC WWTP,
- Surface wash and percolation of rainfall though the screening waste materials [16].
Moreover, the BMC Tanning has an evaporation pond system consists of three ponds totalling an area of 56 740 m2. A stench is emitted from the ponds. Wastewater seepage is going into the ground. An agreement in the end of 2016 has been signed between BMC and WUC, it will be effective by the end of 2017. The BMC will have its own WWTP.
The main problem in this area is the pollution from industrial activities which is polluting Ngotwane River and Ngotwane dam in the North of South Africa. This pollution leads to a transboundary impact between South Africa and Botswana.
2. Sanitation development in South African side
In South Africa, three distinct periods exist to describe the establishment of sanitation facilities. In pre – 1994, South Africa was built in ten homelands managed by tribal authorities. There was no cohesive strategy, guidelines or support structure between homelands. At first, the sanitation service provision was focused on toilet building, sewer system and maintenance. People who had inadequate sanitation were using the bucket system, rudimentary pit toilets or veld. The major concern for the government was the groundwater pollution associated with on-site sanitation.
Between 1994 and 2001, the Department of Water Affairs and Forestry was created and the Communi-ty Water Supply and Sanitation was formed. The objective was to extend the access of basic water supply and sanitation services to all people resident in South Africa. In 1996, the Constitution of Re-public of South Africa has indicated the government has the responsibility of providing water and sanitation services access to all. At first, people were provided with 25 liters of water per day per peo-ple within 200 meters of their home. Moreover, each household was provided with basic sanitation in the form of at least VIP.
In 2001, South Africa census estimated that up 26 % of urban household and 76 % of rural household had inadequate sanitation. Compare to this national estimation, in the Ramotshere Moiloa Local Mu-nicipality, 8.5 % of household had no sanitation facilities. Moreover, in 2001, a cholera outbreak hap-pened in South Africa which showed how important sanitation is. Then, the Department of Water Af-fairs and Forestry launched the National Sanitation Program. The progress of sanitation implementa-tion was monitored and evaluated with performance indicators, such as:
- Programs to clear the backlog,
- Promotion of health and hygiene education,
- Impact of sanitation improvement programs on the health of communities, - Allocation application and management of funds,
- Involvement of communities,
- Development of common norms, standards guideline, and other tool [17].
Nowadays, the Department of Water Affairs and Sanitation is in charge of sanitation. The main chal-lenge in the North West Province is to replace unimproved pit latrines with VIP [18].
Three policies have been launched recently about sanitation in South Africa:
- 2009: Free Basic Sanitation Implementation Strategy [19], which gives the specific steps that can be taken at a local level to implement the free basic water policy.
27 - 2013: National Water Resource Strategy.
- 2016: National Sanitation Policy [20], which is a review of any previous draft sanitation poli-cy. The entire sanitation value chain such as collection, removal, disposal or treatment of hu-man excreta, domestic and industrial wastewater, is considered in this policy.
In the Ramotshere Moiloa Local Municipality, the sanitation facilities are improved since 1996. The sanitation facilities of the RMLM are presented in the Table 2.
1996 2001 2011 2016 Population 15176 137443 150315 157691 Household 3290 31977 16634 47235 Flush toilet to sewerage system 2967 6052 9310 12428 Flush toilet to septic tank 1124 1730 1673 Chemical toilet 332 218 2404 VIP 45 6360 2637 5002 Pit latrine 15415 24261 22536 Bucket latrine 290 335 92 202 Ecological toilet - - - 1115 None - 2740 2387 -
Table 2: Sanitation facilities in Ramotshere Moiloa Local Municipality in the last past 20 years [5, 10, 11, 12]. It can be noticed that the number of flush toilet connected to septic tanks is stable. Every five years, household connected to sewage network is increasing. Moreover, the number of pit latrines is decreas-ing contrary to the number of VIP. It means on-site sanitation is followed and improved. In the South African side of the study area, the majority of sanitation facilities used is VIP and pit latrines. But, four wastewater treatment works are operating in Zeerust, Lehurutshe and in the border posts of Skil-padshek and Swartkopfontein.
2.1. Motswedi sanitation facilities
The Motswedi WWTP is located approximately 2 km from the village of Motswedi, around 71 km north east of Mafikeng. The plant in Motswedi is currently not in operation. The inflow has been cut off for many years. But, the facilities which the plant serves, such as a school, a police station and a number of private houses, are still functioning. Because of this, the wastewater from these buildings is going into the environment. The sanitation facilities of the town are presented in Table 3. It has to be noticed that Motswedi is far from 4.5 km of the Ngotwane river which is flowing in the Ngotwane Dam. Population Household Flush toilet to sewerage network Flush toilet to septic tank Chemical toilet VIP Pit latrine Bucket latrine None Motswedi Consensus 2011 2794 558 80 27 4 66 701 0 15
Table 3 : Sanitation facilities in Motswedi, 2011 [5].
In South Africa, a typical household, with three children and two parents, uses about 250 litres of wa-ter a day [21]. Considering that households with flush toilet connected to the sewerage network are
28 discharging their wastewater in the sewerage system, at least 20 m3 of wastewater per day are dis-charged into the environment in Motswedi.
The only way to know the impact of the lack of sanitation in Motswedi is to assess the quality of water supply in Motswedi. The quality of the boreholes in Motswedi was assessed in the Blue Drop Report [22]. In average, 50 L.person-1.d-1 are consumed from Motswedi water supply. The microbiological compliance is 74.4% and the chemical compliance is 93.7%. So, groundwater is not compliant for nitrate, nitrogen and faecal coliforms. Lack of sanitation in Motswedi has an impact on the aquifer.
2.2. Lehurutshe sanitation facilities
The Lehurutshe WWTP is located approximately 6.4 km north west of Lehurutshe as mentioned in Figure 12, around 54 km north east of Mafikeng. This plant has been built in 1980 and is operated and maintained by the Ramotshere Moiloa Local Municipality.
Figure 12: Map of Lehurutshe.
Lehurutshe is divided in three units for the census of sanitation facilities. The three units of the town are entirely connected to the sewerage system, as presented in Table 4 for the consensus of 2011. There still are septic tanks and latrines for old houses.
29 Lehurutshe Population Household
Flush toilet to sewerage network Flush toilet to septic tank Chemical toilet VIP Pit latrine Bucket latrine None Unit 1 4559 626 1495 39 0 18 14 0 34 Unit 2 1809 190 641 2 0 2 33 0 2 Unit 3 105 1 28 0 0 0 0 0 0
Table 4: Sanitation facilities in Lehurutshe [5].
The WWTP is designed to receive 1 500 m3.d-1 of wastewater but it is actually operating for 900 m3.d-1 from 5993 inhabitants, which means about 60% of its full capacity. The plant comprises an inlet work, three anaerobic and one aerobic oxidation ponds, three maturation ponds, and a set of recycle pumps from the maturation ponds to the anaerobic ponds. The system is presented in Figure 13. The recycle pumps are unserviceable. A chlorination tank was removed. Some maintenance should be done for anaerobic and aerobic oxidation ponds which are overgrown.
Figure 13: Map of the Lehurutshe Wastewater Treatment Plant.
Wastewater treated is discharged in a tributary of the Ngotwane river, flowing until the Ngotwane Dam. The average evaporation for wastewater treatment ponds is around 60%. At least, the WWTP discharges 360 m3.d-1 in the river. According to the Green Drop Report of 2014 [23], the discharge is not compliant to the South African standards. The microbiological determinands, which are Escherich-ia Coli and Faecal Coliforms, are 16.7% complEscherich-iant to the standards. Moreover, chemical determinands as COD, Ammonia and Nitrate, Nitrogen, Ortho – Phosphate, are 5.6% compliant. At last, physical determinands such as pH, Suspended Solids, Electrical Conductivity are 10.4% compliant. The
dis-30 charge represents a real risk for the environment and contaminates irrigation water of the Ngotwane Dam.
The compliance of the WWTW could be improved by cleaning the ponds and installing a new chlorin-ation plant. The pollution is discharged in the Ngotwane river which infiltrates the aquifer and flows to the Ngotwane Dam [24].
2.3. Zeerust sanitation facilities
Zeerust WWTP is located approximately 1.5 km east of Zeerust, around 58 km east and north of Maf-ikeng. This plant has been built in the sixties and was upgrated in 1993. Zeerust WWTP serves the town of Zeerust, Ikageleng township, an abattoir and a few other light industries, presented in Figure 14. It has been designed for a capacity of 3500 m3.d-1 but the WWTP operates for 4000 m3.d-1 of in-flow from 17 708 inhabitants. In this area, wastewater pollution does not come from on-site sanitation. All the population is connected to the sewage network.
Figure 14: Location map of Zeerust WWTP.
The composition of the plant is described in Figure 15. Evaporation losses can be estimated around 45% in an activated sludge treatment. Indeed, around 2200 m3.d-1 of wastewater treated are produced. Moreover, Zeerust plant produces 3.7 dry tons.d-1 of sludge.
31 Figure 15: Design of Zeerust WWTP.
In 2013, an investigation was led on the quality of the Groot Marico River and Kareespruit River due to the mismanagement of the wastewater plants in Groot Marico and Zeerust [25]. Rivers of the area of Zeerust are higly polluted by E. Coli (1000 unit/100 mL) because of the wastewater management. The pollution comes from Zeerust and Marico WWTW. In fact, Marico is populated by townships with no proper sewage. The major threat of pollution is during rainy days. There is no more operation because the municipality feared excessive spillages into the river. But, Zeerust WWTP is identified as one of the priority project and is allocated the highest funding in the North West Province, around 2.8 million of rand. The latest upgrading was in 2012 for materials and maintenance [26], as:
- Replacement of horizontal brush aerators and mixers (4 mixers, 18 aerators), - Replacement of return sludge pump,
- Replacement of waste sludge pump,
- Installation of flow meters in inlet and outlet work, - New mechanical step screen,
- Upgrading bulk electricity supply system.
Because of the upgrading, the discharge quality is improving. There are two reasons of possible pollu-tion from the WWTW. The first one is the fair state of the waste sludge lagoons. In fact, the settled sludge and the debris floating on the lagoon surface have to be removed. The second reason is the discharge from the abattoir. Abattoir’s sewage is composed of high blood content and has an impact on poor effluent quality. The poor quality of WWTP discharge in Figure 16 was presented in the Green Drop Report of 2014.
32 Figure 16: A) Zeerust WWTP compliance in 2012 - 2013 [23], B) E. Coli analysis in Zeerust WWTP discharge [26], C) COD analysis in Zeerust WWTP discharge [26], D) Ammonia analysis in Zeerust WWTP discharge [26], E) Nitrate
analysis in Zeerust WWTP discharge [26], F) Suspended Solids analysis in Zeerust WWTP discharge [26]. Figure 16 shows that the discharge of Zeerust WWTP is not compliant to the standards. But, the quali-ty is improving during the rainy season because the raw sewage is diluted. Zeerust WWTP pollutes Kareespruit River which is flowing to Klein-Maricopoort Dam. The priority for improving the dis-charge quality is the management and the maintenance. Moreover, industries should have their own pre-treatment for sewage.
2.4. Wastewater treatment plants of the Department of Public Works
Two wastewater treatment plants of border posts are located in the RTBAA. These treatment plants depend on the Department of Public Works of South Africa and treat small quantity of wastewater [27].
In Skilpadshek Border Post, the treatment is realized in reed beds. The wastewater treatment plant is effective since 2008 and presents good compliance from the Green Drop Report [27]. Domestic wastewater treated comes from the border post and the military base.
There is also a wastewater treatment plant in Swartkopfontein Border Post. It was designed for domes-tic wastewater coming from the border post and the military base. The treatment process is oxidation ponds and the outflow is compliant between 95 and 100% of the standards [28].
33
3. Conclusion
The settlements not mentioned in the RTBAA are villages with a small population which is using es-sentially pit latrines or VIP. The impact they have on the aquifer pollution is not significant compare to the major settlements. A summary table of the different types of sanitation facilities in the RTBAA and their efficiency can be found in Appendix 9 for further information.
Figure 17 shows a map with the delineation of the area where data on sanitation is reliable. In green is the area with a comprehensive knowledge of sanitation conditions. Wastewater treatment plants are categorised according to their impact on the environment.
Figure 17: Map of the area with comprehensive knowledge of sanitation conditions.
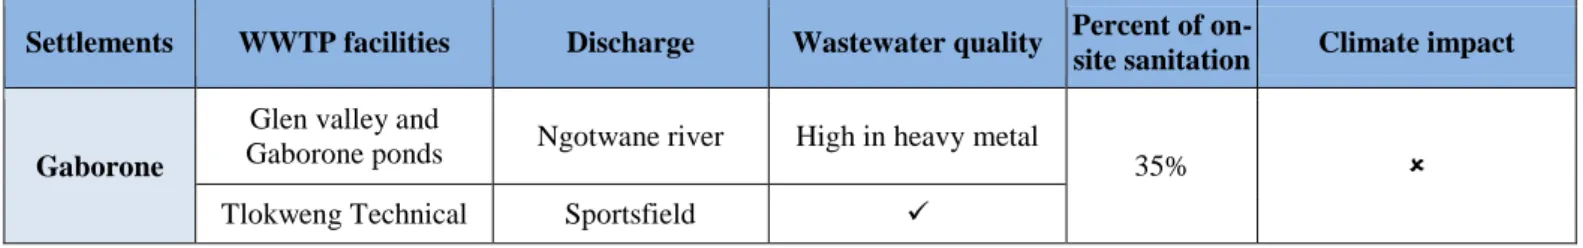
Sanitation facilities are grouped by indicators of pollution in Table 5: place of discharge, wastewater quality, percentage of on-site sanitation and climate impact. It gives an overview of the sanitation chal-lenges in the area extracted from the current status of sanitation.
Settlements WWTP facilities Discharge Wastewater quality Percent of
on-site sanitation Climate impact
Gaborone
Glen valley and
Gaborone ponds Ngotwane river High in heavy metal 35% Tlokweng Technical Sportsfield
34 Training Centre
Saint Joseph’s
Col-lege Gaborone Dam
Mokolodi Game
Reserve Wetland
Kanye
Adventist Hospital Gardens
80%
Kanye Prison Vegetable garden
Kanye Education
Centre Infiltration High in COD
No outflow during dry season
Ramatea College Wetland
NAFTEC Wetland No data
Seepapitso School Kanye river Overflow of raw
sewage Ramotswa Ramotswa Ngotwane river High in COD, SS, nitrate 40%
No outflow during dry season & high groundwater table
during wet season Swartkopfontein
Border
Otse
Otse Police College Gardens Overflow of raw sewage
80% High groundwater table during wet season Otse Moeding
Col-lege Sportsfield Lobatse BMC Spillage in Peleng river Overflow of raw sewage
38% High groundwater table during wet season Lobatse Ngotwane dam High in COD, SS,
nitrate
Skilpadshek Border No outflow
Lehurutshe Lehurutshe Ngotwane dam High in E.Coli,
COD, nitrate 94% (compare to South Afri-can population of the RTBAA) Evaporation of wastewater treated during
dry season
Zeerust Zeerust Klein Maricopoort
dam
High in E.Coli,
COD, SS, nitrate 5%
Table 5: Statement of sanitation in the RTBAA.
III. Challenges
In the sanitation assessment, some challenges are identified. Sanitation pollution depends on the place of discharge and population density, priority areas have to be defined. Moreover, many wastewater treatment plants treat domestic and industrial wastewater. Some are not adapted for industrial wastewater treatment. Then, wastewater treated is not compliant to the standards and pollutes the envi-ronment, particularly the Ngotwane river. In fact, Ngotwane river is mostly supplied by wastewater discharge of Lobatse, Lehurutshe, Ramotswa and Gaborone. This river is a transboundary river and a triggering factor for transboundary pollution.
35 On-site sanitation facilities are also involved in sanitation pollution by infiltration process. The aquifer is recharged by rainfall, wastewater discharge and infiltration from pit latrines. Water balances and climate conditions play a part in sanitation pollution. During wet season, the recharge is higher than during dry season and increases the level of the water table. So, the aquifer is more vulnerable during the wet season.
1. Vulnerability to pollution of the aquifer and priority areas
The potential vulnerability of an aquifer to pollution depends to its characteristics and human activi-ties. Ramotswa Transboundary Aquifer is an unconfined aquifer which does not have a cover of im-permeable material and is susceptible to contamination. The primary protection against groundwater pollution is the soil overlying the water table. Staudt [29] and Alemaw et al. [30] had already studied some parts of the study area by a GIS approach. In this case, to estimate the possible pollution of groundwater, modelling the study area was realized. Saturated zone permeability, aquifer characteris-tics, climate change, topography, human activities and wastewater facilities were included in model-ling [31]. The chosen method is the DRASTIC method with ArcGIS [32].
1.1. DRASTIC Method
The DRASTIC method was developed by US EPA. It provides a basis for evaluating the vulnerability pollution of groundwater resources based on hydrogeological parameters. Moreover, the DRASTIC method can be considered as an approach to evaluate an area based on known conditions without the need for extensive site specific pollution data. By this modelling, an inexpensive method to identify areas that need more investigation was provided.
For using the DRASTIC method, some conditions have to be respected, such as: - Contamination occurs at the ground surface,
- The contaminant enters the water table when rain falls on the surface and percolates into the saturated zone,
- The contaminant travels with water, at the same rate as water, - The method will be applied to no greater than 40 hectares, - The aquifer is unconfined.
The DRASTIC method can be defined by the parameters used in the index [33]. The parameters are presented below:
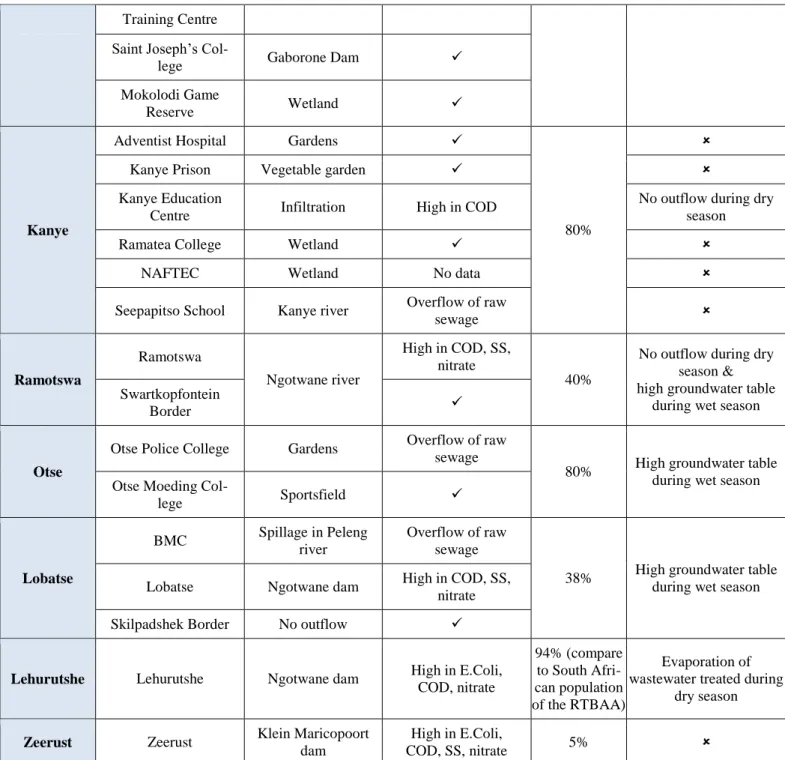
- Depth to groundwater: the depth from the ground surface to the water table in unconfined aq-uifer.
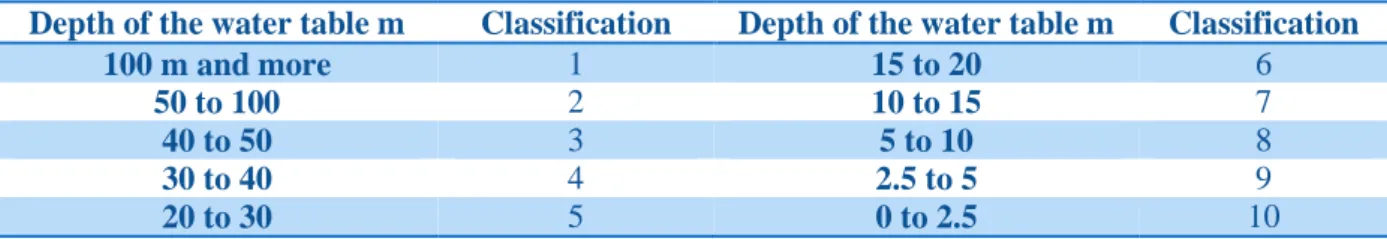
- Recharge: the total quantity of water which is applied to the ground surface and infiltrates to reach the aquifer. It is calculated from the rain and evaporation data in the study area.
- Aquifer media: the thickness of consolidated or unconsolidated rock which characterizes the top of the aquifer.
- Soil media: the uppermost portion of the vadose zone characterized by significant biological activity.
- Topography: the slope of the land surface.
- Impact of the vadose zone: the zone above the water table which is unsaturated or discontinu-ously saturated.
![Table 1: Sanitation facilities in the Botswana side of the RTBAA in 2001 and 2011 [3]](https://thumb-eu.123doks.com/thumbv2/123doknet/5587415.134187/16.892.238.658.108.312/table-sanitation-facilities-botswana-rtbaa.webp)

![Table 2: Sanitation facilities in Ramotshere Moiloa Local Municipality in the last past 20 years [5, 10, 11, 12]](https://thumb-eu.123doks.com/thumbv2/123doknet/5587415.134187/28.892.97.789.254.505/table-sanitation-facilities-ramotshere-moiloa-local-municipality-years.webp)
![Table 4: Sanitation facilities in Lehurutshe [5].](https://thumb-eu.123doks.com/thumbv2/123doknet/5587415.134187/30.892.91.834.112.254/table-sanitation-facilities-in-lehurutshe.webp)