ii Université de Montréal
The role of evolution in the genetic susceptibility of
intracranial aneurysm
Par Sirui Zhou
Programme de Sciences Biomédicales Faculté de Médecine
Thèse présentée à la Faculté des Études Supérieures En vue de l’obtention du grade de Ph.D.
En Sciences Biomédicales
Décembre 2016
iii
RÉSUMÉ
Les Inuits du Nunavik regroupent des peuples autochtones de l'Arctique qui au fil de l’histoire ont formé une petite population isolée dans la région du Nunavik (nord de la province de Québec, Canada). Le profil génétique unique des Inuits du Nunavik est le résultat d’une adaptation à leur milieu de vie et il est considéré comme lié à certaines de leurs susceptibilités pathologiques. Une évolution neutre, ainsi qu’une suite d’événements adaptatifs, ont façonné le génome de ces Inuits et indirectement engendré leur prédisposition accrue à certains troubles cardio-vasculaires et cérébro-vasculaires (ex : hypertension et anévrismes intracrâniens (AI)).
Les AI sont des faiblesses cérébro-vasculaires localisées pouvant mener à des dilatations et renflements localisés de la paroi vasculaire. De telles distorsions sont susceptibles de perturber les vaisseaux et entrainer des hémorragies sous-arachnoïdiennes. Les AI sont un désordre complexe dont la prévalence est élevée (4-8%) et différentes populations (non reliées aux Inuits) ont aussi un risque accru de développer des AI. Le développement des AI est associé à la fois à des facteurs environnementaux et génétiques; plusieurs études génomiques ont identifié des régions associées aux AI. Une grande part de l'héritabilité génétique des AI demeure encore inexpliquée, en particulier dans des populations autres que les finnois et les japonais. Toutefois il est à noter que peu d’études génétiques des AI ont tenu compte de la contribution de variations génétiques spécifiques à la population étudiée.
Pour améliorer nos connaissances sur la part encore inexpliquée de l'héritabilité des AI (qui implique une grande hétérogénéité génétique et des variations peu pénétrantes), nous avons combiné le séquençage à haut débit au génotypage des polymorphismes sur puces afin d’établir la signature génétique des deux populations fondatrices du Québec prédisposées aux AI (Inuits du Nunavik et Canadiens français). Comme ces populations ont des caractéristiques distinctes, nous avons utilisé des approches différentes pour tenter d’identifier des facteurs de risque génétiques. Les Inuits du Nunavik représentent une population autochtone et de nombreux aspects de leur signature génétique diffèrent de celles des principales populations, nous avons choisi d’approfondir leur histoire et profil génomique avant de vérifier si des associations génomiques pouvaient être établies avec les IA. Nous avons tout d'abord examiné les régions codantes du génome et observé de nombreuses composantes génétiques spécifiques aux Inuits
iv du Nunavik qui reflètent que la population s’est adaptée à son environnement (ex: ascendance Inuit homogène, augmentation du déséquilibre de liaison et signature génétique). Des signes de sélection naturelle, jusqu’alors non-identifiés, ont révélé une accumulation de variations génétiques dans des gènes impliqués dans le processus d'adhésion cellulaire et de la réponse immunitaire (ex. CPNE7 et ICAM5). D'autres analyses ont révélé un variant dans le gène CCM2 qui présente une sélection positive et est significativement associé aux AI chez les Inuits du Nunavik. En ce qui concerne l'étiologie génétique des AI dans la population des Canadiens français, nous avons adopté une approche différente et utilisé des variations spécifiques aux Canadiens français, qui ont été identifiées par le séquençage complet de l'exome. Ces variations ont permis de générer une liste de gènes à risque potentiel, qui ont ensuite été priorisés en utilisant un test d'association par gène de type « burden ». RNF213 est apparu comme le meilleur gène candidat; il est vraisemblablement la conséquence d’une dérive génétique. Les mesures génétiques et fonctionnelles subséquentes ont validé la contribution possible de RNF213 au développement des AI chez les Canadiens français. Les résultats présentés dans cette thèse soulignent l'importance de prendre en compte le contexte génétique spécifique apporté par l'évolution lorsqu'une maladie complexe est étudiée. Il a également été montré que les variations d’un gène spécifique (ex. CCM2 et RNF213) peuvent contribuer au développement de différentes pathologies lorsqu'ils sont observés dans des populations distinctes. D'une manière générale, nos découvertes génétiques ont permis d’identifier de nouvelles « pièces » génétiques et pour avancer le « casse-tête » incomplet de l'héritabilité génétique des AI ; la génétique des populations a été un élément clé pour cette avancée.
Mots-clés : Inuits du Nunavik, Canadiens-français, anévrismes intracrâniens, séquençage
v
ABSTRACT
Nunavik Inuit is a group of Arctic indigenous people, who have historically regrouped as a small and isolated population across the Nunavik region of northern Quebec (Canada). The unique genetic profile of Nunavik Inuit is the result of years of adaptation to their living condition, and it is likely responsible for their increased susceptibility to certain pathological conditions. Prior studies have shown that as a consequence of neutral evolution or past adaptive events, today’s Inuit are predisposed to cardio-cerebrovascular disorders, e.g. hypertension and intracranial aneurysm (IA).
IA is defined as localized cerebrovascular weakness which leads to vascular dilation or ballooning, and such distortions are susceptible to disrupt the affected vessels and lead to subarachnoid hemorrhage. It is a complex disorder with a high prevalence (4-8%) and certain populations have been observed to present an increased risk of developing IA. Both environmental and genetic factors are deemed to contribute to the development of IA and in regards to the latter, independent genome-wide association studies (GWAS) have identified multiple loci associated with IA. Nonetheless, there is still a large portion of the genetic heritability of IA, especially in different populations other than Finnish and Japanese that remains unexplained. However, fewer IA genetic studies have taken in consideration the contribution of population specific genetic variants.
To address some of the IA missing heritability that is deemed to be accountable to its genetic heterogeneity and low penetrance, we have combined high throughput sequencing (HTS) with SNP-chip genotyping to examine the genetic signatures of two founder populations from Quebec that are predisposed to IA, including Nunavik Inuit and French-Canadians (FC). Because these populations have distinct genetic characteristics, we used different approaches for the identification of genetic risk factors. Nunavik Inuit is an indigenous population and many aspects of its genetic signatures differ from those of separate world-wide major populations; therefore we chose to conduct extensive population genetic studies in regards to their genetic history and genomic profile before we undertook to test if any association could be established between genomic loci and disease susceptibility. We observed many genetic components that are specific to the Nunavik Inuit population, including its homogeneous Inuit ancestry, increased
vi linkage disequilibrium (LD) and genetic signatures which reflect the population had a long history of adaptations to their environment. Previously unidentified signals of natural selection, which focused on coding regions of the genome revealed an accumulation of genetic variants in genes involved in the processes of cell adhesion and immune responses (e.g. CPNE7 and ICAM5). Further analyses revealed a variant in CCM2 to be under positive selection and significantly associated with IA in Nunavik Inuit. In regard to the genetic etiology of IA in the French-Canadian population, we took a different approach and used French-Canadian specific variants that were identified by whole exome sequencing to generate a list of potential risk genes; which were further prioritized using a gene based burden association test. RNF213 emerged as a prime candidate gene that had undergone possible genetic drift and the follow-up genetic and functional examinations further supported its potential contribution to the development of IA among French-Canadians. The results presented in this thesis highlighted the importance of taking into consideration the specific genetic background brought by natural selection or genetic drift, both are driving forces of evolution, when a complex disease is being studied. It also further confirmed that variants in a specific gene (e.g. RNF213 or CCM2) may contribute to the development of different pathogenesis when examined in distinct populations. Overall as our genetic findings identified new genetic “pieces” that further completed the missing heritability “puzzle” of IA genetics; evidence for these “pieces” were interestingly highlighted through population genetics.
Keywords: Nunavik Inuit, French-Canadians, intracranial aneurysms, whole exome
vii
TABLE OF CONTENTS
RÉSUMÉ ... iii
ABSTRACT ... v
TABLE OF CONTENTS ... vii
LIST OF TABLES ... ix LIST OF FIGURES ... x LIST OF ABBREVIATIONS ... xi ACKNOWLEDGMENTS ... xvi CHAPTER 1: INTRODUCTION ... 1 1.1: PREFACE ... 1
1.2: THE GENOMIC LANDSCAPE AND DISEASE RISKS OF INUIT PEOPLE ... 3
1.3: THE GENETIC ETIOLOGY OF INTRACRANIAL ANEURYSM ... 24
1.4: RATIONALE AND OBJECTIVES ... 39
CHAPTER 2: THE GENETIC SIGNATURES OF NUNAVIK INUIT ... 41
2.1: PREFACE ... 41
2.2: THE GENETIC HISTORY AND SIGNATURES OF NUNAVIK INUIT ... 44
2.3: INCREASED MISSENSE MUTATION BURDEN OF FATTY ACID METABOLISM RELATED GENES IN NUNAVIK INUIT POPULATION ... 81
CHAPTER 3: UNCOVERING MISSING HERITABILITY OF INTRACRANIAL ANEURYSM IN THE FRENCH-CANADIAN FOUNDER POPULATION ... 105
3.1: PREFACE ... 105
3.2: RNF213 IS ASSOCIATED WITH INTRACRANIAL ANEURYSMS IN THE FRENCH-CANADIAN POPULATION ... 107
3.3: GENOME-WIDE ASSOCIATION ANALYSIS IDENTIFIES NEW CANDIDATE RISK LOCI FOR FAMILIAL INTRACRANIAL ANEURYSM IN FRENCH-CANADIANS ... 137
viii
4.1: POPULATION GENETICS: STUDY OF NUNAVIK INUIT ... 154
4.2: NEW RISK GENES FOR INTRACRANIAL ANEURYSM IN FRENCH-CANADIANS ... 164
4.3: PERSPECTIVES: HUMAN EVOLUTION AND COMPLEX DISEASES ... 172
CONCLUSION ... 174
Appendix 1: Genetic Evidence for Cold and Diet Adaption in Canadian Inuit ... 175
Appendix 2: Supplemental material for Chapter 2.2 ... 196
Appendix 3: Supplemental material for Chapter 2.3 ... 208
Appendix 4: Supplemental material for Chapter 3.2 ... 213
Appendix 5: Supplemental material for Chapter 3.3 ... 224
ix
LIST OF TABLES
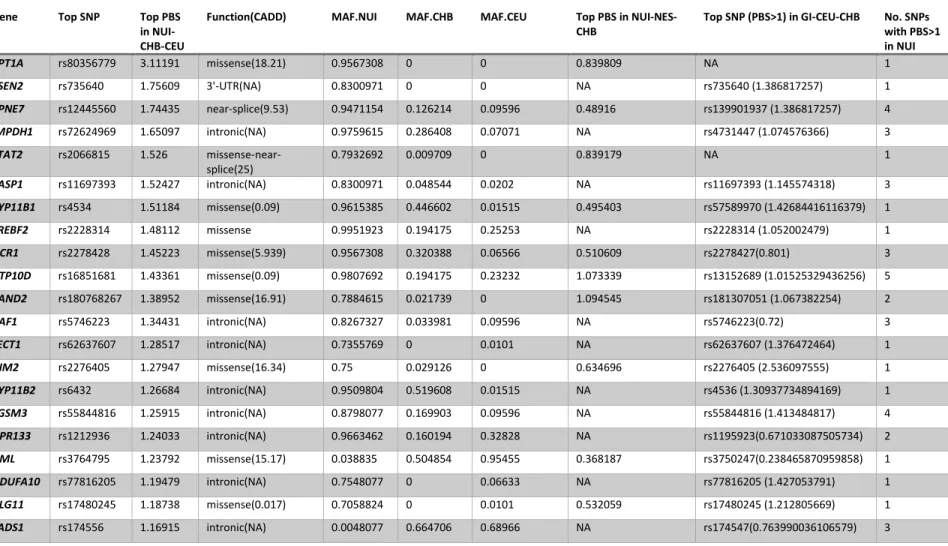
Table I. Candidate genes under positive selection based on top PBS scores in
Nunavik Inuit using WES data ... 79 Table II. Genomic features of carnitine acyltransferase genes. ... 99 Table III. Coding variants of carnitine acyltransferase genes discovered in
Nunavik Inuit ... 100 Table IV. Variant frequencies and deleterious score predictions of carnitine
acyltransferase genes ... 101 Table V. Deleterious scores of all rare missense variants in carnitine acyltransferase genes found in Nunavik Inuit and 1KGP Asians. ... 102 Table VI. Mutation burden scores of identified rare mutations (MAF<0.01) of carnitine acyltransferase genes in Nunavik Inuit and 1KGP Asians. ... 103 Table VII. The FST and FIS value of 13 variants in the population containing
Nunavik Inuit and HapMap Asians ... 104 Table VIII. Exome variant filtration steps and results of initial cohort ... 132 Table IX. Prioritized genes with French-Canadian specific deleterious variants 132 Table X. Mutation burden of 11 prioritized genes between FC IA patients and controls ... 134
Table XI. Patient-only and control-only RNF213 variants which predicted
deleterious ... 134
Table XII. RNF213 variable thresholds of world-wide populations compared to
French-Canadians ... 135 Table XIII. 28 genes with top SNPs reached promising level of association ... 151 Table XIV. Exonic and splicing variants of 23 GWAS suggestive genes in 138 FC cases and controls from WES ... 152 Table XV. CCDC80 exonic and splicing variants in FC cases and controls ... 152 Table XVI. Sample demographics and the clinical information of cases ... 153
x
LIST OF FIGURES
Figure 1. Principal component analysis (PCA) of Nunavik Inuit and other
populations... 71 Figure 2. Estimated admixture proportions for Nunavik Inuit with Arctic and Native American indigenous populations ... 72 Figure 3. Local ancestry inference of an individual from Kangiqsualujjuaq ... 73 Figure 4. LD decay for different populations ... 74 Figure 5. Estimated Runs of Homozygosity (ROH) lengths of different populations ... 75 Figure 6. Maximum-likelihood genetic-drift tree topology relating people from Nunavik Inuit and other Arctic indigenous populations ... 76 Figure 7. Manhattan plot displaying Population Branch Statistics (PBS) of Nunavik Inuit. ... 77
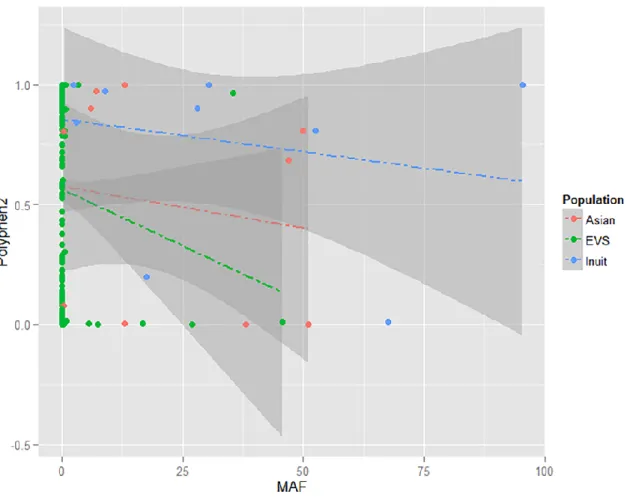
Figure 8. The relative quantification (RQ) scores of genes with significant expression level changes between Nunavik Inuit and FC ... 78 Figure 9. MDS plot showing the distinctive ethnicity relationships of CEU, YRI, JPT-CHB and Nunavik Inuit ... 96 Figure 10. Scatterplot of the frequencies and deleterious scores of CPT1A, CPT1B, CPT1C, CPT2 and CRAT missense variants ... 97 Figure 11. Pairwise linkage disequilibrium (LD) diagram for CPT1B and CPT2 in Inuit
... 98
Figure 12. Six IA pedigrees with 26 affected individuals from the initial cohort ... 127 Figure 13. Matrix of pairwise FST of RNF213 between world-wide populations ... 128 Figure 14. ATPase activity of the wildtypes, variants and LOF controls of the two AAA+ domains of RNF213 ... 129 Figure 15. Meta-analysis of two RNF213 studies in different populations ... 130 Figure 16. RNF213 missense patient-only variants in IA and MMD ... 131 Figure 17. Manhattan plot of case-control association analysis using imputed data . 149 Figure 18. Regional association for 3p14.2 ... 150
xi
LIST OF ABBREVIATIONS
1KGP 1000 genome project
AAA+ ATPases associated with diverse cellular activities ABC approximate bayesian computation
ATPase adenosine triphosphate hydrolase AVM arteriovenous malformation
BCE before Common Era
BP before present
BWA burrows-wheeler aligner
CADD combined annotation dependent depletion CAND2 cullin associated and neddylation dissociated 2 CCDC80 coiled-coil domain containing 80
CCM cerebral cavernous malformation CD/CV common disease/common variants
CDKN2BAS cyclin dependent kinase inhibitor 2B antisense RNA 1
CE Common Era
CEU Utah Residents (CEPH) with Northern and Western Ancestry CHB Han Chinese in Bejing, China
CNV copy number variations
CPNE7 copine vii
CPT1A carnitine palmitoyltransferase 1A CTA computerized tomography angiography CVD cardiovascular disease
EC endothelia cells
ECM extracellular matrix
EDNRA endothelin receptor type A FADS fatty acid desaturase
FBAT family based association test
FC French Canadians
xii FIA familial intracranial aneurysms
FST fixation index
GATK genome analysis tookit
GCTA genome-wide complex trait analysis GEO gene expression omnibus
GI Greenland Inuit
GO gene ontology
GRCh37 genome reference consortium human version 37
GREML genomic-relatedness-matrix restricted maximum-likelihood GRS genetic risk score
GST glutathione S-transferase GTEx genotype-tissue expression GWAS genome-wide association study
HC high-confidence
HEPES 4-(2-hydroxyethyl)-1-piperazineethanesulfonic acid HTS high-throughput sequencing
HUVECs human umbilical vein endothelial cells HWE Hardy–Weinberg equilibrium
IA intracranial aneurysm
IBD identical by descent
ICAM5 intercellular adhesion molecule 5 IGV integrative genomics viewer
JPT Japanese in Tokyo
LCL lymphoblastoid cell lines
LD linkage disequilibrium
MAF minor allele frequency MCA middle cerebral artery
MCMC Markov Chain Monte Carlo
MDS multidimensional scaling
MMD moyamoya disease
xiii MRA magnetic resonance angiography
mtDNA mitochondrial DNA
NAT Native Americans
NHLBI GO-ESP National Heart, Lung, and Blood Institute Grand Opportunity Exome Sequencing Project
NUI Nunavik Inuit
NUIrelate populations have close common ancestors with Nunavik Inuit NWT Northwest Territories
OD optical density
PBS population branch statistics PBS phosphate-buffered saline PCA principal component analysis PMSF phenylmethane sulfonyl fluoride POLR2A RNA polymerase II polypeptide A PUFAs polyunsaturated fatty acids
QC quality control
qRT-PCR quantitative real-time polymerase chain reaction RAF1 Raf-1 proto-oncogene, serine/threonine kinase RNF213 ring finger protein 213
ROH runs of homozygosity
RQ relative quantification
SAH subarachnoid hemorrhage
SD standard deviation
SE standard error
SFS site frequency spectrum
SIA sporadic intracranial aneurysms SKAT sequence kernel association test SNP single-nucleotide polymorphism SNV single-nucleotide variation SOX17 sex determining region Y box 17
xiv STAT2 signal transducer and activator of transcription 2
T2D type 2 diabetes
TBC1D4 TBC1 domain family member 4 UTR untranslated region
VCF variant call format
VSMCs vascular smooth muscle cells
VT variable thresholds
WES whole exome sequencing
WGS whole genome sequencing
WSS wall shear stress
WSSG wall shear stress gradient YRI Yoruba in Ibadan, Nigeria
xv Something ends, something begins.
xvi
ACKNOWLEDGMENTS
First of all, I would like to give my thanks to both of my supervisors, Drs. Guy Rouleau and Lan Xiong, whose mentorship have guided me all these years and allowed me to evolve and become what I am today. Thank you for giving me the opportunities and providing me with the platform for taking this initial step on the path to become a scientific researcher, and also for encouraging me to pursue any project in an unconventional direction. What I gained from you is not only knowledge itself, but the art of thinking, self-learning, and making decisions, which I shall always remember and practice in my future career and life.
I have benefited greatly from this healthy research environment, for which I would like to credit the wonderful team that I am lucky to work with: Dr. Patrick Dion, who has always been there and helped me even with the smallest problems; and to Amirtha for your special companionship and dedicated friendship for the past six years; to Pingxing and Qin for our talks and discussions; to Alex and Dan who helped me a lot in the bioinformatics which brought me closer to this field; to Daniel and Amélie who provided professional, essential helps in my experiments; and to Helene, Pascale, Simon, Cynthia, Claire, Gaby, Ziv, Hussein, Loubna, Sandra, Alanna, Faezeh and to all the present and past lab members from the Rouleau lab, I would like to express my sincere appreciations for your help and accompany throughout my Ph.D. life.
I wish to also thank Dr. Simon Gravel for lending me a hand with his expertise in population genetics and Dr. Akio Koizumi who helped us to validate one of the major findings presented in this thesis. And also to my committee members Drs. Marie-Pierre Dubé, Nicolas
xvii Dupré and Daniel Lajeunesse, thank you all for your support and valuable suggestions toward my research.
The works presented in this thesis would not be possible without the support from the joint scholarship of China-scholarship Council and Université de Montréal and the scholarships from Université de Montréal la Faculté des études supérieures et postdoctorales, and Canadian Institutes of Health Research (CHIR).
Finally, I want to thank all my friends in Montreal and back in China, who have made my life fuller; and my family, to my parents, Ping and Li, without whom I would not be the person I am today, who would always support my decisions and tell me not to worry. And special thanks to David Conroy and his family, for perpetual support and providing inspiration in so many ways. It is nice to have you all for perhaps the most memorable and productive years in my life, and I look forward to the years coming that we would all to accomplish much more.
1
CHAPTER 1: INTRODUCTION
1.1: PREFACE
Gaining an understanding of genetic profiles across the full length of genomes has proved to be critical to our understanding of human genetic history and local adaptation; it has concomitantly helped to delineate the genetic etiology for a number of complex human disorders. The recent advancements made for high-throughput sequencing and genotyping technologies have greatly enhanced our present ability to identify the genome-wide genetic signatures of specific populations, as it eased the unravelling of disease risk factors. The literature reviews presented in the introduction section will cover two seemly unrelated area of studies, nonetheless both areas are essential for the question to be explored in this thesis: 1) recent advances of the population genetic studies about Inuit and related Arctic indigenous populations; and 2) genetic studies of IA, a complex cerebrovascular disorder with increased prevalence in certain populations including French-Canadian and Inuit.
Chapter 1.2 will essentially be dedicated to findings recently published by a number of genetic and genetic anthropological studies of Greenland Inuit and indigenous Siberians. This chapter will provide details about the genetic history, local adaptations and predisposition to diseases of these Arctic indigenous inhabitants. The chapter will also highlight the importance of disease gene discovery through historically small and isolated founder populations.
Chapter 1.3 will review and discuss a number of hypotheses regarding IA etiology by highlighting recent findings from studies that aimed to identify IA predisposing genetic risk factors. In regard to this last element the chapter will emphasize the importance of whole exome
2 sequencing (WES) and genome-wide association studies (GWAS). Interestingly, a number of recent large-scale IA association studies were conducted using IA predisposed populations (e.g. Finnish and Japanese), these raised points that are critical when addressing the relationships between complex diseases and population-wide genetic signatures, which have been introduced throughout the process of human evolution.
3
1.2: THE GENOMIC LANDSCAPE AND DISEASE RISKS OF
INUIT PEOPLE
Manuscript: The genetic history, adaptation and disease predisposition of Inuit and Arctic peoples
Authors and Affiliations:
Sirui Zhou,1,2 Patrick A. Dion,1,3 Lan Xiong 2,4, Guy A. Rouleau1,3,*
1Montreal Neurological Institute and Hospital, McGill University, Montréal (Que), Canada. 2Department of Medicine, Faculty of Medicine, Université de Montréal, Montréal (Que), Canada. 3Department of Neurology and Neurosurgery, McGill University, Montréal (Que) Canada. 4Centre de recherche, Institut universitaire en santé mentale de Montréal, Université de Montréal,
Montréal (Que) Canada
Abstract
The arctic aboriginal peoples, especially Inuit, are interesting for their way of life and for being the last branch in the “Out of Africa” migration. They are also noteworthy for their distinctive genomes, their adaptation to a distinctively harsh environment, and their characteristic disease predispositions. This review will provide the emerging conclusion regarding a series of recent genetic studies that examined Inuit or other present or ancient arctic populations. It will summarize what has been established about the Inuit population, and also highlight critical elements for future research directions based on reconstruction of population history, discoveries of genetic signatures
4 in positive selections, and population specific disease profiles associated with specific founder variations.
Introduction
According to Reich et al.1, three-waves of migration populated the Americas starting 15,000 years
ago through the Bering Land Bridge: First Americans, which most of the Native Americans descended from; second, the Eskimo-Aleuts from the arctic, with half of their ancestries from the second stream of Asian gene-flow; and Saqqaq-NaDene speakers, which partially consists of the third stream of gene-flow.
The arctic circumpolar regions are inhabited by many indigenous people (Fig 1), such as the Siberians, Samis, Indians and Inuit. The Inuit originated from East Asia and crossed the Bering Strait as part of a final wave of migration about 6,000 years ago, with the present population have an approximate 170,000 individuals in the circumpolar region. Arctic Inuit populations, most of the Inuit population, live in Canada, Greenland and Alaska2, namely Greenland and Canadian
Inuit, Alaska's Yupik and Iñupiat, and Siberian Yupik3.
Throughout the years of their inhabitation, especially after 1950s, Inuit populations have undergone changes that led them to abandon their traditional life style. The diet of modern Inuit now contains more carbohydrate than their traditional diet which was based on unsaturated fat and protein to fulfill their energy requirements. In recent history the climate of the Canadian Arctic has been undergoing through drastic changes and these negatively impacted the health of some of its inhabitants4. Indeed a higher incidence of complex diseases has become noticeable (e.g.
5 diseases are now a major public health concern for in the 21st century indigenous Arctic populations5. This review aims to systematically discuss the genetic history of Inuit and related
Arctic peoples, as well as to examine how their distinctive genetic architectures contribute to their special metabolic and physiological traits and disease predispositions.
The Peopling of Arctic Canada and Greenland: the
anthropological story
From Paleo- to Neo-Eskimos
Ancient Arctic peoples in North America, ancestors of present-day Inuit, are commonly believed to comprise two distinct cultures: Paleo-Eskimos and Neo-Eskimos. Early Paleo-Eskimos have peopled Arctic Canada and Greenland in the era of 3,000 to 800 BCE, the source of their food was essentially caribou and musk ox8, and they had a culture which was very similar to the one of
6 1) the pre-Dorset culture and 2) the Independence I-Saqqaq culture in Arctic Canada and Greenland, including a small culture of Groswater in Labrador and Nunavik9. During the cold
period of 800 BCE, the early Paleo-Eskimos developed into late Paleo-Eskimo, namely Independence II-Dorset culture in the eastern Arctic, and it was at this point that they started to mostly consume the products of sea mammals10. The Dorset culture was further divided into four
phases11, although whether they represented genetic continuity or not is controversial, and
eventually ended in around 1,350 CE, replaced by the Neo-Eskimo (Thule) culture, which originated from Bering Strait region at the earliest 200 BCE12, during the terminal phase of the
7 Three cultures have led to the Thule culture: starting with the Old Bering Sea stage from 200 BCE to 500 CE; followed by Punuk and Birnirk stages from 800 to 1,400 CE, which distributed along the major Strait islands to shores of the Chukchi Peninsula, and along coastal northern and western Alaska, respectively13. Starting at 1,100 CE, the classic Thule culture began
their movement eastward, during which they gradually changed from mainly whale hunting to hunting of walrus and seal, making them the ancestors of the present day Alaskan Yupik/Inupiat and Canadian/Greenland Inuit10. There was a coexisting wave of Norse Viking settlement, which
came around 985 CE, and who mainly occupied the Southwest Greenland and part of Newfoundland and Labrador, introducing an ancient admixture to the Inuit peoples in those regions, combined with a recent Danish admixture, resulting an approximate 25% European ancestry in Greenland Inuit14.
The Population History of Greenlandic Inuit
The Greenlandic population is a historically small one, as it currently consists of approximately only 57,000 individuals. The colonization of Greenland followed its route with the peopling of North American Arctic: Paleo-Eskimos entered the Northwest Greenland via Canadian High Arctic Island at 2,500 BCE15, which was eventually replaced by the Thule people in the 12th
century. This hypothesis was further supported by the genome of a 4,000-year-old Saqqaq individual retrieved in Qeqertasussuk, Greenland; this sequencing enabled a link to be made between the Old World Arctic population and the extinct Greenlandic inhabitants16. Past genetic
studies have reported evidence that highlighted how modern-day Inuit in Greenland are direct descendants of the first Inuit pioneers of the Thule culture9. MtDNA analyses also led to conclude
8 and on the east coast of Greenland9; 15, thus suggesting that current Greenland Inuit are the
descendants of both Thule and Dorset cultures17. This hypothesis is however disputed by other
groups14. Afterwards, Norse Vikings settled with Dorset and early Thule people in Greenland from
985 until 1,450 CE18; 19, Thule Inuit started their settlement in the West and Southeast of Greenland
from 14th century. Analyses of the Greenlandic migration events supports the hypothesis proposing
a single wave of Inughuit Polar Eskimos to have moved into Northwest Greenland in the 17th
century20, and then moved southward along the west coast14. In 1721, Greenland became a Danish
colony until 1979, introducing a large number of European settlements on the island for the second time in history21.
Inuit in Canadian High Arctic
Current Canadian Inuit live mainly in the subarctic region of Nunavut and Nunavik regions of Quebec, a small number of them also live in the Nunatsiavut and NunatuKavut regions of Labrador and Arctic Ocean of the Northwest Territories. The Nunavik region is 443,685 km2 in size and is
composed of 14 Inuit communities, with a total population of 12,090. The occupying of Nunavik started 4,500 BP by Paleo -Eskimos, at the east coast of Hudson Bay and Ungava Bay, until 2,500 BP because of the climate changes. During which the Inuit population had gone through several declines and a resurgence from 3,000 to 2,800 BP22, until they were eventually replaced by the
highly cold-adapted Dorset people, who reached Nunavik around 500 BCE. The Dorset people were subsequently replaced by Thule around 1,300 CE, during the Medieval Warm Period that had a devastating impact on their ways of hunting on sea ice. The contact of Nunavik Thule with Europeans, contrary to that of Greenland Inuit, remained near non-existent until the 19th century.
9 number of late pre-contact Innu sites are also found9. Innu were a nomadic people who likely had
spent the colder months hunting caribou inland before visiting coastal areas in the spring and summer to hunt marine animals, and with ancestors likely to be Paleo-Indians and developed into a new culture known as the Maritime Archaic people.
The peopling of Nunavut from the starting of pre-Dorset culture to the Thule occupying was similar to that of Nunavik, but with an earlier inhabitation: when the glaciers in Nunavut melted approximately 10,000 BP, Paleo-Indians from the first wave of migration reached this area and moved northward following the migration of caribou to the tree line. At around 500 BP, with the advancing of Little Ice Age, Nunavut Inuit abandoned most regions of the High Arctic and had their first encounter with Europeans12.
The Links between the Past and the Present
There have been some debates as to whether the Paleo-Eskimos were an offshoot population to the one that gave rise to the Native American population. Ancient mtDNA studies suggested that the first wave of migrations, which colonized the New World Arctic, originated neither from the Native American populations started 14,350 BP nor from the populations that gave rise to the later Neo-Eskimo expansion from Alaska around 1,000 BP23. Several studies also aimed to establish if
there was genetic continuity between Paleo-Eskimo and today’s Inuit. Raghavan et al. pointed out that all Paleo-Eskimos appear to be a continuum of a single-source population9, although gene
flow between the Dorset and the Thule Inuit could not be excluded. A recent mtDNA study reported Alaskan North Slope being the starting point for both Paleo- and Neo- Eskimo migrations further east-ward into Canada and Greenland, and thus there were some degree of genetic continuity between Paleo-Eskimos and contemporary Inuit peoples24. An independent mtDNA
10 analysis showed that Neo-Eskimos were mainly of the Arctic Canada origin, whereas the direct ancestors of Paleo-Eskimos were primarily drawn from Chukotka25. It has also been suggested by
Dulik et al.26 and Olofsson et al.17 that there has been past gene flows between Dorset and Thule
Inuit, at least in Greenland, which bear traces of both Thule and Dorset descent. Therefore, the current populations of the North Circumpolar Region share a common origin with Native American populations.
The Genetic History of New/Old World Arctic Peoples: evidence from DNA
Reconstructing Greenlandic genetic history
The genetic structure of Greenland Inuit has recently been extensively described, through large scale studies using both high density SNP genotyping array and high-throughput sequencing methods14; 27. The Greenlandic Inuit population came from small founder populations and they
encountered a series of bottlenecks in history, consequently they would have had relatively small effective size and are expected to harbor less genetic variations; the latter has been proved by a number of subsequent studies. Pereira et al. focused on X chromosomal markers of 477 males from Greenland (N=312) and Denmark (N=165)27 reported that Greenland Inuit have a reduced
diversity and a higher level of LD by comparison to the Danish and Asian populations. Their study showed a significant difference between Danish with all Greenlandic sub-populations, especially the Ammassalik. Ammassalik and Nanortalik (Fig 1) presented the most significant genetic distances to the reference populations compared with the other Greenlandic populations. Moltke et al.14 further advanced the study of Greenlandic LD by reporting that in the ancestral Inuit
11 recent European admixture has reduced the LD of the Greenlanders. The high level of genetic distinction in Greenlandic populations was also observed in a study from Tomas et al. where the pairwise FST between multiple populations (including Somalis and Danes) showed a clear
displacement of the Greenlandic population versus the others28. Identical by descent (IBD)
analyses suggested that approximately 84% of the genetic differentiation inside the Greenlandic sub-populations may be due to genetic drift, and a different degree of non-Inuit gene flow within the different subgroups14. Admixture analysis also revealed that Greenlanders present a low level
of the European/Danish ancestry and also a low level of Asian ancestry.
Moltke et al. conducted a more extensive modelling in the Greenland Inuit by genotyping 4,674 Greenlandic individuals with a MetaboChip that contained 196,224 SNPs14. Their first
finding was consistent with the previous findings of European ancestry admixture as they observed that there has been gene flow from Europeans into most of Greenland. Over 80% of Greenlanders have European ancestry, but the distribution is not even across Greenland (individuals from Ammassalik, the South Villages and Qaanaaq in the Northwest Thule region have less European ancestry or only Inuit ancestry). The findings could be interpreted with a scenario where Greenland was settled by Inuit who entered North Greenland and migrated to South Greenland along the west coast and later to East Greenland. Nonetheless the Greenlandic gene flow is reported to be sex-biased, which was correlated with an earlier finding of Bosch et al.21. Although as much as 50%
of Greenlanders have European male ancestry, only 1% of the female ancestry were European. There is also population differentiation even within the Greenlandic Inuit population – as the observed FST between Upernavik villages and South villages is smaller than the estimated between
Upernavik villages or other locations, thus suggesting that Upernavik villages are genetically closer to South villages (Fig 1). Ammassalik from Southeastern Greenland are genetically furthest
12 away from Qaanaaq in Northwestern Greenland (FST=0.04), as they are closest to the villages in
South Greenland (FST=0.02). This slight decay of genetic variation following a
north-west-south-east gradient of Greenland further supports the aforementioned hypothesis proposing a single wave migration along the coast.
Additionally, the genetic-drift tree topology and D statistics relating Greenlandic sub-groups also inferred the existence of a single coastal route migration, in which each location sequentially split off along the coastline. On the other hand, the D statistic test also suggested that there had been only limited amount of gene-flow from the Dorset to the modern east Greenlanders, when compared with the ancient Saqqaq genome16. The last question that Moltke et al. addressed
in their study was if there were Norse Viking admixture in the Greenlandic genome by analyzing the length of ancestry tracts, as ancient admixture tends to have shorter tracts. Unfortunately, they reported no significant differences when comparing the tract-length distributions of Northwest villages and South Villages, where little recent European admixture was found and large settlements of Norse Viking once took place.
Beringia peoples lived in cold climate conditions and their diet was rich in fat and protein from fish and marine mammals. It is likely that all Native Americans and related groups like Inuit descent from populations originally have adapted to such conditions, since the migration route into the Americas for all of these groups was through Beringia. Fumagalli et al.29 thus followed up the
previous population structure study of Greenland14 by analyzing the environmental adaptation of
Greenlandic Inuit. Through analyzing the same SNP-chip dataset14; 30, they selected 191
Greenlandic individuals who have less than 5% estimated European ancestry and applied population branch statistic (PBS) for the detection of positive selection signals. As a result, they found the strongest signal of selection on chromosome 11, which comprises multiple genes
13 (TMEM258, MYRF and FADS1, FADS2 and FADS3). They also reported other loci that appeared to be associated with selection signal, e.g. on chromosome 1 (encompassing WARS2 and TBX15) and chromosome 17 (FN3KRP). To supplement the SNP-chip data, they generated WES data on 18 Greenlandic Inuit and observed two additional genes, DSP and ANGPTL6, representing the strongest signals of selection. Although the selection signal for FADS cluster was reduced using the WES dataset (PBS=1.145, FADS2), the report by Fumagalli et al. provided additional evidences that highlighted the selected alleles in genes known to modulate fatty acid composition and affect the regulation of growth hormone, which would have been critical for the adaptations to a diet rich in PUFAs.
The Genetic Structures and Selection Signals in Siberians
Studies of the Old World peoples can also be informative in analyzing contemporary Inuit populations who have adapted to the cold climate before they evolved through their own courses, possibly due to the result from the bottleneck drift that New World peoples experienced during their period of migration. Some Siberians appear to have different cardio-metabolic disease risks than other circumpolar groups31; and other studies observe lower serum lipid levels in indigenous
Siberian peoples32.
Several mtDNA studies examining Siberians preceded the era of genome sequencing and these provided the first genetic evidence supporting archeological findings that led to believe that the High Arctic populations originated in Siberia. These mtDNA studies found the latest inhabitants of Beringia to be genetically linked with the Chukchi-, Eskimo-Aleut- 33, and
Na-Dene-speaking Indians as well as Paleosiberian-Na-Dene-speaking Yukaghir in the high arctic since early Postglacial34. These studies also established the founding population of Eskimo-Aleut to have
14 originated in Beringia/Southwestern Alaskan during the early postglacial period35, and today’s
Greenlandic individuals to essentially be the descendants of Alaskan Neo-Eskimos36.
Studies that included Siberians for the identification of selection signals showed that the most strongly selected signals across worldwide populations are associated with pigmentation, autoimmune diseases and genes related to UV radiation, infection, immunity, cancer and metabolic adaptations37; 38. In 2014, Cardona et al. conducted a study describing the population structures of
indigenous Siberian peoples and their selection signatures39. They used a SNP-chip that contains
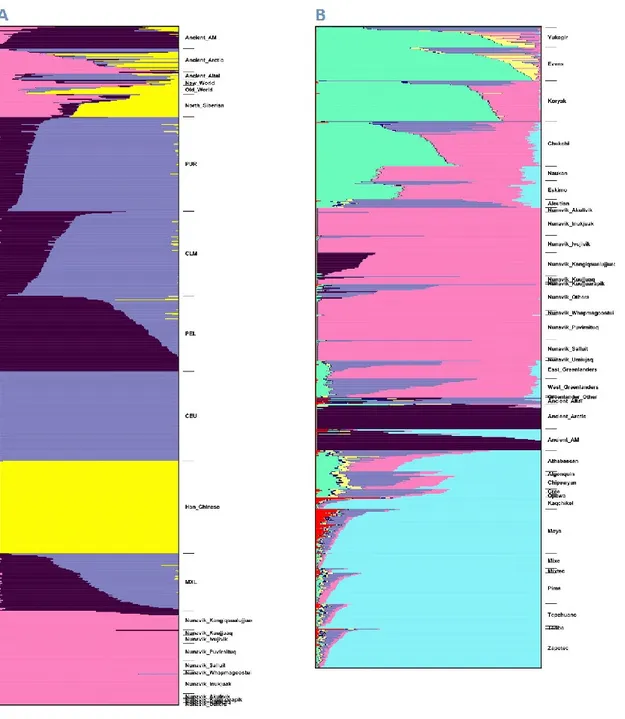
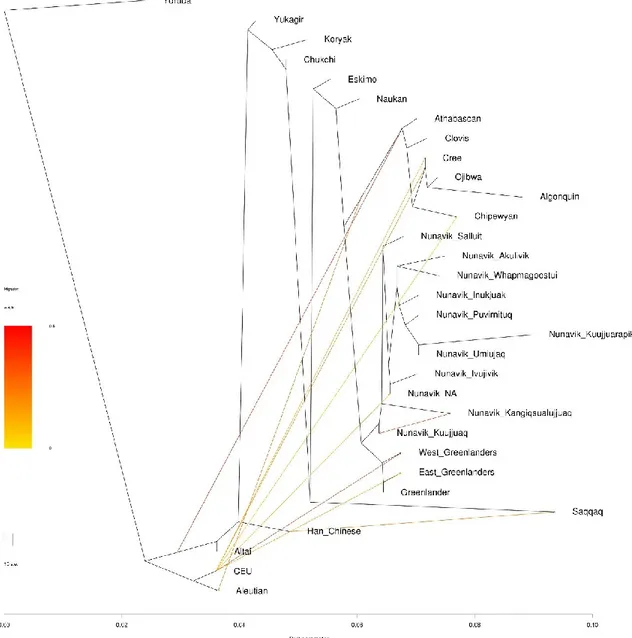
730,525 SNPs in 200 individuals from 10 Siberian groups. The initial assessment using principal component analysis (PCA) and ADMIXTURE showed different ancestry profiles that enabled distinctions to be made across native Siberian populations. Among those distinctions it appears that Chukchi, Eskimo and Koryaks were predominately of Inuit ancestry; also Yakuts, Evens and Evenks came mainly derived from another ancestry; and finally Altai, Teleuts, Shors and Buryats all shared a third. The clustering of different predominant ancestries into different groups was fitting with their respective geographical locations. Subsequently, two haplotype-based tests (iHS and XP-EHH) were used to examine the positive selection, and seven genes (THADA, ITPR3, GNGT1, PRKG1, RELN, CPT1A and LRP5) were observed to be positively selected; furthermore a locus on chromosome 11 containing the last two genes was delineated and shown to be the most significant. Interestingly, this region was close to the region that had been found to be positively selected in the earlier Greenlandic Inuit study by Fumagalli et al.29. Cardona et al. demonstrated
that this region contained the strongest signal in the Northeastern Siberian gene pool39, the ancient
ancestors of today’s Greenland and Canadian Inuit.
A followed-up study by Clemente et al.40 based on the aforementioned chromosome 11
15 Eskimo and Koryaks39. After a careful variant filtration, 148 SNPs with both a >0.5 derived allele
frequency in subjects of the study and a MAF<0.01 in published populations were retained. From which they reported three variants with possible functional consequences to the encoded proteins, which located in two genes, CPT1A and IGHMBP2, within the previously found chr11 region39.
iHS test focused on this region with the inclusion of other populations mapped chr11:66-69 Mb region to be the significantly selected locus only in Northeast Siberians. Tajima’s D scans further narrowed down a region of 68.2-68.6 Mb, which contains genes LRP5, PPP6R3, GAL, MTL5 and CPT1A. This study eventually established that a variant in CPT1A (c.1436C>T) drove this selective sweep, and this will be further discussed in the following section.
Discovering Selection Signals in FADS and CPT1A in Arctic Populations
Fumagalli et al. suggested that in Greenlandic Inuit, the strongest selection signals are in the FADS gene cluster29. The family of FADS genes are known to be associated with long chain
polyunsaturated fatty acids (PUFA) metabolism, type 2 diabetics (T2D) and coronary artery disease41-43. Using the inferred demographic model by Approximate Bayesian Computation
(ABC), the divergence time between Han Chinese and Greenland Inuit was estimated to have occurred 23,250 years ago with an effective population size of 1,550. The chromosome 11 region was thus established to be a strong outlier and the selection starting time of the most significant SNP (rs74771917) from the FADS cluster was occurred approximately 19,751 BP (selection coefficient s=0.0313), when the common ancestors of Inuit and Native Americans still lived around Beringia, and before the first migration wave to the New World started.
A positive selection of the FADS cluster has been reported in many other populations because of its involvement in n-3/n-6 PUFA metabolism, a key component for the diet evolvement
16 of Homo sapiens44, (e.g. in Africans45; 46 and Alaskan Eskimos43). A very recent study reported a
22bp insertion-deletion (rs66698963) in FADS2 that was positively selected in Asian populations, more particularly in South Asians47. FADS2 was positively selected in both vegetarians, such as
South Asians; and meat eaters, such as Greenland Inuit. Interestingly, the ancestral allele of rs174570 in FADS2, which was positively selected in Greenland Inuit, also exhibited positive signals in South Asians. The differences being that the derived allele was under adaptation in Greenland Inuit, while in South Asians, the ancestral allele was better adapted. It is tempting to suggest that the ancestral haplotype of FADS2 variants has been selected towards dairy-vegetable diet while the derived haplotype has contributed to the adaptation to a marine-fat-rich diet.
Another interesting gene is CPT1A for which a missense mutation (c.1436C>T, p.P479L) was reported in multiple studies; most likely because of its high frequency (possibly due to natural selection) across Arctic populations (0.77 in Nunavut and 0.44 in the Northwest Territories)48; 49.
This Arctic-specific variant was initially thought to be associated with CPT1 deficiency, including hypoketotic hypoglycemia50 and sudden infant death syndrome51. A functional characterization of
the CPT1A c.1436C>T mutation revealed that this mutation decreases the process of fatty-acid oxidation and ketogenesis under normal condition. However under conditions of high malonyl-CoA concentration, the activity of CPT1A c.1436C>T mutation was much greater than what could be measured in the cells with the wildtype allele52; which could consequently have a protective
role against the overproduction of ketone bodies53.
In order to study the origin of this mutation at the evolutionary level, Clemente et al.40
performed LD analysis focused on chr11:68-69Mb region that had shown strong selection in their previous study39. They found that CPT1A c.1436C>T mutation seem to be the driving selection
17 in Northern Siberians while the pattern is not significant in East Asians and completely absent in Europeans. The c.1436C>T variant was thought to be absent from the genomes of most individuals worldwide, and to be only presented in Arctic populations. The inferred demographic model of Northeastern Siberians yielded an effective population size of 3,000-5,000; under the assumption that c.1436C>T variant is the result of directional selection from a de novo mutation, they estimated the selection time of this variant to be 3-ka old (selection coefficient s=0.14). The age of selection time of a 58kb haplotype around the c.1436C>T variant is around 6.7-ka, supporting the hypothesis of a strong selection from a selective sweep, possibly due to a recent and rapid adaptation against the cold climate and dietary specialities. To concur with the estimation of the age of this mutation, they examined ancient samples for its surrounding haplotype (comprised of 27 variants in high derived allele frequency in Northeast Siberians). They found that this derived haplotype was absent from the Neandertal and Denisovan genomes, regardless of the fact that CTP1A was also found to be among the lipid-catabolism-associated genes enriched with Neandertal-like sites55. It was also absent from the ancient human genomes more than 10-ka old56,
but starting to appear in the 4-ka old ancient Saqqaq genome16, then also in
Paleo-Eskimo/Neo-Eskimo samples9. Interestingly, this haplotype was partially presented in Aleutians but completely
absent from Na-Dene speaking Athapaskans, perfectly consistent with a previous conclusion that Eskimoan- and Athapaskan-speaking populations are genetically distinct and came from two population expansions that occurred after the initial wave of migration26. It was therefore
postulated that the c.1436C>T variant (and its surrounding haplotype) could have occurred in the Old World Arctic (ancestors to the Northeastern Siberians) and only retained by the selection pressures of cold climate, before it was introduced to the New World Arctic, starting with the first Paleo-Eskimo wave that populated the Canadian High Arctic and Greenland.
18
Founder Mutations and Disease Risks in Inuit Populations
The recent changes of Inuit lifestyle, such as drinking and smoking, calorie-dense foods and less hunting activities, were believed to have increased their risk of cardiovascular diseases (CVD), including atherosclerosis and hypertension, compared to western populations. Parallel studies comparing Inuit living in Greenland and Denmark57 also supported this belief. Considering these
observations it can be hypothesized that variants which neutrally accumulated in the Inuit populations may be starting to show deleterious effects under the new selective pressure. On the other hand, because of the high degree of genetic differentiation following the separation from East Asian or Beringian founder populations58, causal variants that are very rare in other
populations may segregate at a distinctly high frequency in the Inuit population, making it a suitable model for discovering disease susceptible variants.
Metabolic Traits and Diseases
The best example of this scenario would be the p.R684X variant in TBC1D4, which was discovered through a genotyping and WES study examining 2,575 Greenland Inuit, and found to be associated with a higher 2h plasma glucose levels30. The discovery phase of the GWAS found the highest
association to be with an intronic variant (rs7330796) of TBC1D4 and subsequent followed-up WES and further genotyping in general Greenlandic cohort and T2D cohort revealed the causative variant p.R684X in TBC1D4. This nonsense mutation was shown to be strongly associated with mean 2h plasma glucose levels (mainly in homozygous carriers), and with an increased risk of T2D, which elevated circulating glucose and insulin levels after the glucose load. The p.R684X
19 variant has a large population impact, with an estimated frequency of 23% in the Inuit cohort, possibly due to a weak selection or genetic drift; while it is absent from Europeans and only at a frequency of 0.5% in 1KGP Japanese population.
More studies have focused on the association of Inuit specific lipid-metabolic profiles with their genetic background. In the selection study of Greenland Inuit carried out by Fumagalli et al., a strong association was observed for a positively selected FADS SNP with body weight (p=1.1×10⁻⁶; rs7115739) and height (p=0.00012; rs7115739), FADS affects the fatty acid
desaturases by compensating for a high dietary intake of eicosapentaenoic acid29. In
Greenland Inuit, a rare haplotype in the gene encodes adipose triglyceride lipase (ATGL) was found to be associated with increased plasma triglyceride concentrations59. The allele distributions
in several ALDH genes, particularly ALDH1B1 and ADH1C, shown to be associated with drinking patterns, also differed significantly between Inuit and Danes60. The Inuit also harbor distinct
variant distributions in other genes (CYP1A1, CYP1B1 and COMT) and this suggests their susceptibility to environmental contaminants to be increased61, the same variants may also
contribute to their predisposition to diabetes62. Additionally, a study of 553 Nunavik Inuit, focused
on 35 variants across 20 lipid-metabolism related genes pinpointed 7 SNPs as significantly associated with plasma lipid parameters63. And genes such as DOCK1, PTPRE and FABP4, were
highly associated with obesity-related traits and n-3 PUFA interactions in Yup’ik people64; SNPs
in LPL, TNFRSF10B, and APOJ also had strong statistical evidence of functional effects in the fatty acid distributions65. CDKAL1 and HHEX polymorphisms were also reported to be associated
with glucose homeostasis in Alaska Native population with a low prevalence of T2D66.
Disrupted profiles of the metabolic genes sometimes could lead to more severe conditions. In a large cohort that regrouped Inuit from Alaska, Canada and Greenland67, the LDLR p.G116S
20 variant was observed to be strongly associated with dyslipidemia; a condition found in approximately 10% of Inuit and with one of the largest effect sizes (3.02-fold increased risk of hypercholesterolemia). In another Nunavik Inuit study examining glycogen storage disease type III (GSD-III), a founder mutation, AGL c.4456delT68, was reported to cause the disease in
individuals who are homozygous carriers. It should however be noted that the same homozygous variant was also observed in a cohort of GSD-III cases of North African Jewish heritage, albeit it is absent in other present-day populations. The reason why this old variant was somehow preserved only in these two very genetically distinct populations is unclear. Finally, a variant c.273_274delAG located in the gene encodes Sucrase-Isomaltase (SI) was also found common in the Canadian Inuit population (MAF=17.2%) with homozygous carriers develop congenital sucrase-isomaltase deficiency69.
Infection and Allergy
The risk of infectious diseases is another health concern for Inuit populations. For instance, a high risk of HPV infection was observed among Nunavik Inuit women70; HLA-G polymorphisms were
also suggested to affect the host immune recognition and this is supported by the fact that Nunavik Inuit women have a distinctive HLA allele frequencies by comparison to other populations71.
A common Inuit variant IL4RA Ala57Thr, while extremely rare in other populations (MAF≤0.6%), was found associated with the risk of atopy in Inuit living in Denmark, but not in Greenlandic Inuit72. This finding was not an isolated case as in Inuit populations of Greenland and
Denmark the same asthma risk allele expresses opposite magnitude and direction of genetic associations73. The Inuit population separation time between Greenland and Denmark is however
21 too short for the effect of a genetic drift to have taken place, suggesting that environmental changes also play a big part in some of the disease pathogenesis observed in Inuit.
Cancer
Inuit populations have recently observed to present with an elevated risk of cancer. A founder mutation c.2002A>G in PMS2 was observed in a Nunavik Inuit family with constitutive mismatch repair deficiency (CMMRD) syndrome, which leads carriers to eventually develop cancer74. The
intronic variant creates a de novo 5’ splicing site for intron 11 that leads to a frameshift. Nine additional Inuit cancer patients were subsequently discovered to be homozygous carriers of the PMS2 c.2002A>G; this variant is therefore likely to act in a recessive inheritance manner. The variant has an estimated frequency of 0.06 in the Nunavik Inuit populations and is considered to be one of the most common cancer-associated risk allele.
Breast cancer risk is high amongst Greenland Inuit women and reports have highlighted a founder mutation, BRCA1 p.C39G, that is observed in 33% of ovarian cancer patients and 10% breast cancer patients, the overall frequency of this variant is 1.6%75; 76. However the frequency of
this variant differs geographically as it is 0.6% on the West Coast to 9.7% on the East Coast, a difference that likely resulted from bottleneck drift during the migration. Other polymorphisms in CYP1A1 and CYP17A1 can also increase the risk of breast cancer among Inuit women and the risk increases with higher serum levels of Perfluorooctane Sulfonate (PFOS) and Perfluorooctanoic acid (PFOA), which were consistently shown as risk factors of breast cancer as well77.
By opposition, Inuit men from Greenland have lower risk of prostate cancer. Several SRD5A2 SNPs and androgen receptor repeats were shown to differ significantly between
22 Greenland Inuit and Swedish, these differences lead to a lower SRD5A2 enzymatic activity that regulates the turnover of testosterone to 5 alpha-dihydrotestosterone78.
Liver Diseases and Others
An ATP8B1 c.1660 G>A variant was reported to cause cholestasis familiaris groenlandica, a liver disease common in Greenlandic Inuit79, the variant causes the disease in a recessively inherited
manner and it is found in an heterozygote state in 12% of the population80. The observation of a
BLVRA c.214C>A nonsense mutation in unrelated Inuit women with biliary obstruction during cholestasis suggest it might be a founder mutation81. A frameshifting mutation ATP13A2
c.2473C>AA was also found in a Greenland Inuit family affected with Kufor-Rakeb syndrome (KRS)82.
Inuit hearing impairment, a highly prevalent disorder in this arctic population, was reported to be caused by a GJB2 c.35delG mutation, the variant frequency in overall population is found vary between 0.5% in the West Coast to 2.3% in the East Coast83.
Cerebrovascular Diseases
Whether or not related to the high risk of CVD that the Inuit populations recently acquired, there is also an elevated risk of cerebrovascular diseases in Inuit5, the genetic underlying of which may
be combined with heavy alcohol consumption and hypertension, known to increase the CVD risk. A report of CVD prevalence among Nunavik Inuit indicated that 2.5% of adults were diagnosed with a cerebrovascular disease84. In Alaska, cerebrovascular disease is the 5th leading cause of
23 descendants85. Lindgaard et al. reported that Inuit IA patients have a much higher rate of familial
history of subarachnoid hemorrhage (SAH) (23.1%) and IA (9.6%) compared to Danish IA patients (4.3% and 1.6%)86. Moreover the relative risk of SAH of Greenlandic Inuit is 4.4 fold
higher than the one observed for the neighboring Dane population87. The prevalence of IA in
Denmark is similar to that of Sweden and Finland88, individuals from the latter also deemed to
present a high risk of IA89. Finally it is noteworthy that Inuit IA cases also tend to harbor multiple
IAs, the percentage of such cases is two-fold higher than Danes; fitting with a genetic risk factor in Inuit since multiple IAs is a marker for the genetic form of IA. Despite this evidence, the underlying genetic cause of IA in Inuit and the contribution played of founder mutations nonetheless remain to be further elucidated.
Conclusion
Through several waves of migration, ancient groups of humans began populating the Americas nearly 16 millenniums ago. The arctic population is an interesting one as it provides us with an extended picture of how ancient human occupied the New World, it also sheds light on how today’s global populations came into being. Through examinations of their genomes which were adapted to the harsh arctic environment and affected by bottleneck drifts, the arctic indigenous peoples like Inuit might lead us to discover not only the genetics that explain specific human traits but also the underlying mechanism of certain disease etiology. Canadian Inuit are one of the most important residents of the Arctic, but their genetic landscape remained a largely uncharted territory. Further studies focusing on this unique population could therefore efficiently link the studies of Siberians and Greenlandic Inuit and advance our knowledge of the global population genomic profiles.
24
1.3: THE GENETIC ETIOLOGY OF INTRACRANIAL
ANEURYSM
Cerebrovascular diseases, stroke and subarachnoid hemorrhage
Cerebrovascular diseases include a broad spectrum of disorders affecting the blood supply to the brain. Stroke, carotid stenosis, IA, artery malformations, including arteriovenous malformations (AVM) and moyamoya disease, all belong to this heterogeneous disease group.
Stroke is the second most common cause of death after coronary artery diseases in the western contries90, while in China, it is the most frequent cause of death, with incidence more than
five folds that of myocardial infarction. It can be categorized into ischemic (blockage) and hemorrhagic (bleeding), with 87% being ischemic91. Ischemic strokes are commonly due to
thrombosis or embolism while hemorrhagic strokes, which are subdivided to intracerebral and subarachnoid, are usually caused by an arteriovenous malformation or the rupture of an aneurysmal lesion.
SAH is bleeding in the subarachnoid space, an area between the pia mater of the brain and the arachnoid membrane. SAH comprises approximately 5% of all strokes, with an incident rate of 6-7 per 10,000 person/year92 and a fatality rate around 50%93. The prevalence of SAH is higher
in Finnish and Japanese94; 95, and surprisingly this is not due to their prevalence of IA96.
The risk and etiology of intracranial aneurysm
25 An IA is a dilatation of part of the intracranial artery and its shape varies from a localized sac-like pouch to a long enlargement of the vessel diameter97; these two forms are referred to as saccular
or berry aneurysm and fusiform aneurysm, respectively. The worldwide incidence of intracranial aneurysms has been estimated to be approximately 2-3%98, most IAs are saccular (SIA), which
typically occur at the arterial branching sites on the Circle of Willis. Common sites of SIA include the anterior communicating artery, the bifurcation of posterior communicating artery and internal carotid artery, the middle cerebral artery, and the basilar artery bifurcation99. The most common
clinical symptoms of aneurysmal SAH are a sudden onset of severe headache with stiff neck, vomiting, and photophobia100. Unruptured IA (UIA) is usually asymptomatic, however
retrospective studies have estimated the annual risk of rupture among IA patients to be approximately 1-3%101.
Although ruptured IAs are the cause of 85% patients who had subarachnoid haemorrhage, it has been reported that 50% to 80% of all IAs do not rupture during the course of a person's lifetime. A recent examination of the prevalence of UIA estimated it to be around 3.2%96, and can
be as high as 7% in China. The prevalence ratio of UIA is significantly higher in women than men (1.61) and in individuals over 50 years versus less (2.2)96. 1.8% of the people with European
ancestry have SIA102, the incidence usually varies among different populations, with the highest
in Finnish and Japanese. However, recent studies suggested those statistics to be disputable96; 103.
The risk of SIA is also higher in some connective-tissue related genetic disorders. Autosomal dominant polycystic kidney disease (ADPKD) is the most common disease associated with SIA, with a relative risk of 6.9 (95% CI 3.5-14). Approximately 5% to 40% of patients with ADPKD have IA, and 10% to 30% of patients have multiple IA96. Other associated disorders
26 include neurofibromatosis type I104, Ehlers-Danlos syndrome105, Marfan syndrome106, hereditary
hemorrhagic telangiectasia107 and endocrine neoplasia type I108.
The risk of UIA to rupture increases with the aneurysm size, location (particularly in the posterior circulation), irregular shape, and history of previous aneurysmal SAH109. Other studies
suggested smoking and female sex increase the risk of IA rupture, size of the IA lesion, on the other hand, is not a significant risk110. Controversies always follow the size of aneurysm: small
aneurysms have low annual risk of rupture111; however, 85-90% of the ruptured aneurysms are
small112. A more recent study reported the risk of SAH depends predominantly on smoking, sex
and blood pressure113. Excessive alcohol consumption also increases the risk of SAH114.
The exact etiology of IA is still unclear, albeit several hypotheses highlight the contribution of maladaptive vascular remodeling115 triggered by hemodynamic stress116 and inflammatory
response117, such chain of events would ultimately damage the blood vessel wall, which is the key
process in the pathophysiology of IA.
Intracranial arteries and IA pathology
Intracranial arteries have two major differences compared to other arteries: 1) there is no elastic lamina and the adventitia is thinner in the vascular walls118; 2) there are gaps in the muscular media
layer in the bifurcations119. These special characteristics may help to explain the site of the
aneurysm formation.
IAs have different arterial wall types that characterized by their specific histopathology: 1) perturbations of homeostasis in the cerebrovascular wall, characterized by a lack of internal elastic lamina in the IA wall120, which occurs early in the course of the disease; 2) decrease in tissue