Université de Montréal
Understanding the Underlying Biomechanical Mechanisms and Strategies in Dysvascular Lower-Limb Amputees during Gait Initiation: Implications for Gait
Analysis
par Mary Roberts
Département de kinésiologie
Thèse présentée à la Faculté des études supérieures en vue de l’obtention du grade de Philosophae Doctor (Ph.D.) en Sciences de l’activité physique
mars 2018
Résumé
Un grand nombre de paramètres biomécaniques sont disponibles pour quantifier la marche mais aucun consensus n’existe quant aux paramètres les plus pertinents à mesurer lors de l’analyse de la marche chez les sujets sains. Le premier objectif de cette thèse était donc de réaliser une revue systématique afin de déterminer les paramètres les plus pertinents pour l’analyse de la marche chez les adultes sains. Les résultats ont permis de confirmer que les paramètres spatiaux-temporaux, et plus spécifiquement la vitesse de marche, sont les paramètres les plus souvent mesurés par le plus grand nombre d’articles pour l’analyse de la marche chez les adultes sains. De futures études sont nécessaires afin de pouvoir comparer ces résultats chez d’autres populations et déterminer leur pertinence clinique.
Lors de l’initiation à la marche, les ajustements posturaux anticipatoires (APA) permettent le transfert du poids du corps et la propulsion, tout en gardant l’équilibre et, au premier pas, de 75% à 90% de la vitesse de marche moyenne (SSWV) est atteinte. Bien que la population d’amputés transtibiaux pour cause dysvasculaire (DTTA) est importante et grandissante, aucune étude n’a, à ce jour, examiné les APA et le patron du premier pas lors de l’initiation à la marche chez cette population. Les deuxième et troisième objectifs de cette thèse étaient donc de comparer le patron des APA et la cinétique du premier pas chez 10 DTTA et 10 sujets contrôles lors de l’initiation à la marche. Les sujets ont initié la marche avec la jambe droite et gauche jusqu’à ce que la SSWV soit atteinte.
Les résultats de la deuxième étude démontrent une augmentation du temps en phase APA chez les DTTA, une stratégie pour compenser la force réduite en augmentant l’impulsion. Le résultat le plus important chez le DTTA est qu’en A/P, un déplacement total antérieur a
été observé sous la jambe prothétique, une stratégie qui semble être spécifiquement associé à l’amputation dysvasculaire.
Les résultats de la troisième étude démontrent que lors du premier pas, l’impulsion de propulsion de la jambe prothétique était réduite par rapport à la jambe intacte et aux sujets contrôles. Cette réduction d’impulsion de propulsion est directement reliée à la perte des muscles fléchisseurs-plantaires au niveau de la jambe amputée. Curieusement, pour la force verticale maximale lors de la mise en charge et le taux de chargement, aucune différence n’a été observée entre la jambe intacte et la jambe des sujets contrôles ce qui supporte l’idée que les DTTA profitent d’un facteur protecteur contre le risque d’ostéo-arthrite au niveau de la jambe intacte.
Les spécialistes travaillant avec les DTTA devraient promouvoir l’initiation de la marche avec les deux jambes afin de bien préparer le DTTA aux perturbations de la vie quotidienne. Également, l’augmentation de la SSWV ne devrait pas nécessairement être un objectif de la réadaptation. De prochaines études devraient s’intéresser à comparer le patron de marche chez les DTTA aux amputées pour cause traumatique ainsi que s’intéresser au patron de terminaison de la marche.
Mots clés : ajustements posturaux anticipatoires, marche, initiation de la marche,
Abstract
A large number of biomechanical parameters are readily available with which to quantify gait but no consensus on the most relevant parameters for gait analysis in healthy adults exists with which to compare these results. The first objective of this thesis was therefore to complete a systematic review in order to establish those parameters most relevant for gait analysis in healthy adults. Results showed spatio-temporal parameters, specifically walking velocity, to be the most often measured biomechanical parameters and reported by the greatest number of articles for gait analysis in the healthy adult population. Further research should aim to compare these results to those of other populations and determine their clinical relevance.
In gait initiation, anticipatory postural adjustments (APA) allow for body weight to be transferred and propulsion while maintaining balance. As well, the first step accounts for 75% to 90% of the steady-state walking velocity (SSWV). Though the dysvascular transtibial amputee (DTTA) is the most sizeable and growing amputee population, no studies have yet investigated the APA’s and first step gait initiation pattern in this specific population. Thus, the second and third objectives of this thesis were aimed at comparing the APA’s pattern and underlying first step kinetics in 10 DTTA with 10 healthy controls prior during gait initiation. Participants were asked to initiate gait with their right then left limb leading until they reached SSWV.
In the second study, the increased APA time observed in the DTTA support the strategy to improve impulse by increasing time in the presence of diminished force production. The most important result is with regards to A/P total APA, as a total anterior displacement was
observed in the prosthetic limb and would appear to be related to further reductions in propulsion specifically associated with dysvascular amputation.
Lastly, the results of the third study showed that propulsive impulse was significantly reduced in the prosthetic limb when compared to intact and control limbs. The reduction in propulsive impulse testifies of the missing plantarflexor muscles of the prosthetic limb. Interestingly, with regards to maximum vertical force at weight acceptance and loading rate there was no difference between the intact limb and the control limb. Though the DTTA are able to produce less intact limb vertical force, this may also place them at a reduced osteoarthritis risk in the intact limb.
Rehabilitation specialists should focus on both prosthetic and intact leading limb for gait initiation to aid the DTTA with everyday perturbations. As well, increasing SSWV should perhaps not be a goal of rehabilitation. Future research should focus on comparing gait initiation in the DTTA when compared to the traumatic TTA counterpart as well as understanding gait termination in the DTTA.
Key words: anticipatory postural adjustments, gait, gait initiation, biomechanics, transtibial
Table of Contents
Résumé ... i
Abstract ... iii
Table of Contents ...v
List of Tables ... vii
List of Figures ... viii
List of Abbreviations ... ix
CHAPTER 1:INTRODUCTION...1
1. Etiology of the Lower Limb Amputee Population ...2
1.1Incidence of lower limb amputation ...2
1.2Causes of lower limb amputation ...3
1.3Level of amputation ...4
1.4Particularities of lower limb amputees...5
2. Steady-State Walking………..….8
2.1Gait in the Healthy Individual ...8
2.2Gait in the TTA and DTTA ... 22
3. Quiet Standing ... 30
3.1Quiet Standing in Healthy Adults ... 30
3.2 Quiet Standing in the Transtibial Amputee ... 31
4. Gait Initiation ... 33
4.1Gait initiation in Healthy Adults ... 33
4.2Gait Initiation in the Transtibial Amputee ... 41
Objectives & Hypotheses ………... 52
CHAPTER 2:METHODS ... 54
Introduction of articles………... 60
CHAPTER 4:ARTICLE II ... 95
CHAPTER 5:ARTICLE III ... 121
CHAPTER 6:DISCUSSION ... 146
1. Most relevant biomechanical parameters in healthy adults. ... 148
2. APA for gait initiation in the DTTA ... 151
3. Kinetics contribution of the first step in gait initiation ... 156
CHAPTER 7:CONCLUSION ... 160
List of Tables
Table I- Frequency of parameters measured in the 89 articles included in the systematic
List of Figures
Figure 1- Illustration of gait cycle phases.. ... 11
Figure 2- Joint angular kinematics of the lower limb. ... 14
Figure 3- A/P and vertical GRF profiles during SSWV ... 16
Figure 4- Ankle, knee, hip joint and support moments during SSWV ... 19
Figure 5- Power profiles of the ankle, knee and hip joints ... 22
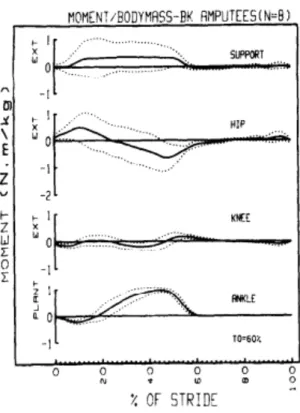
Figure 6- Average sagittal plane ankle, knee, hip joint and support moments in 8 below-knee amputees. ... 24
Figure 7- Average sagittal plane ankle, knee and hip power profiles in 8 below-knee amputees ... 26
Figure 8- CoPnet displacement in the four phases of APA involved in gait initiation…… 35
Figure 9- Sagittal plane joint angles of ankle, knee and hip during gait initiation ... 38
Figure 10- The vertical GRF profile during gait initiation.. ... 40
Figure 11- The A/P GRF profile during gait initiation ... 41
List of Abbreviations
APA Anticipatory postural adjustment
A/P Antero-posterior
BW Body weight
CoM Center of mass
CoPnet Net center of pressure
DTTA Dysvascular transtibial amputee
GRF Ground reaction force
M/L Medio-lateral
RMS Root mean square
SSWV Steady-state walking velocity
TTA Transtibial amputee
Chapter 1: Introduction
Because walking is the most common form of locomotion and is part of almost all activities of daily living [1,2], the ability to walk is an indicator of overall health and autonomy [1]. Although walking is usually learned at a young age, the mechanics of walking are quite complex and they have been the focus of numerous studies since the
beginning of the 18th century.
From the first studies of human walking elaborated through a series of photographic images, by early biomechanics enthusiasts Edweard Muybridge and Étienne-Jules Marey, gait analysis as it is known today has evolved significantly [2]. Numerous studies have specifically investigated the walking pattern in healthy adults, especially as this is a sizeable population, and their walking pattern is today better understood [3,4,5,6,7,8]. The gait mechanics of healthy adults is often compared across ages (i.e. development, maturation and degeneration process) and with of other populations where gait disorders may be associated with deficits and pathologies [9,10,11]. Thus, all aspects of gait in healthy adults must be well understood in order to make appropriate recommendations for rehabilitation, footwear, walking aids, orthosis and prosthesis.
Indeed, the process of the walking activity can be broken down into various phases, from quiet standing to gait initiation, and finally to steady-state walking. Placing a focus on gait initiation and steady-state walking, the current thesis aims at comparing the anticipatory postural adjustment (APA) and the forward movement production during gait initiation up to steady-state walking velocity (SSWV) in both healthy and lower limb amputation populations.
In the following sections, pertinent biomechanical and clinical literatures, on how lower limb amputees and healthy adults are able to initiate walking from a quiet standing position and accelerate to reach SSWV, will be presented. But, first, the epidemiology (i.e. incidence, causes, level of amputation) and particularities of the lower limb amputee population will be presented.
1. Etiology of the Lower Limb Amputee Population 1.1 Incidence of lower limb amputation
In the United States, the incidence of lower limb amputation is 45/100 000 habitants [12]. It is also estimated that over 1.6 million people are living with a lower limb amputation [13]. Lower extremity amputations affect mostly men (i.e. 69%) above the age of 50 to 60 years old [14,15,16].
Trends indicate that the number of amputations will continue to increase, in large part because of the increasing number of individuals affected by dysvascular diseases associated with diabetes [17]. Projections indicate that by 2050, the number of lower limb amputations associated with vascular problems will be over 2.27 million people in the United States [13].
For Canada, the estimation of the total number of lower limb amputees is not available, but Imam and colleagues (2017) have reported that an average of 7405 new amputations are performed every year with an incidence of 28.9/100 000 Canadians with diabetes [15].
Even when adjusted for age and/or sex in individuals with diabetes, important rates of lower limb amputation, as high as 176 and 158/100 000 are reported, respectively for the Republic of Ireland and France [18,19]. These high rates of lower limb amputation are those specifically calculated for the population who are affected by diabetes mellitus and its numerous complications. The next section will address in details the complications experienced by the lower limb amputee population.
1.2 Causes of lower limb amputation
Dysvascularity and diabetes represent the main causes in 76 to 96% of the total number of lower limb amputations in Canada and the United States [12,16]. As introduced above, diabetes and peripheral vascular disease are not only associated to but are also the major causes of lower limb amputations as type II diabetes is a principle cause of vascular problems and associated complications (i.e. hypertension, atherosclerosis, thrombosis, peripheral neuropathy, retinopathy, nephropathy and cataracts) which currently impacts over 30 million individuals in the United States, and this number is said to be increasing. It has also been estimated that over 7.4 million individuals in the United States are living with type II diabetes without knowing of their medical condition [20].
With increasing time since onset of type II diabetes, there is also an increased risk for developing associated complications such as peripheral neuropathy, the most common complication associated to diabetes [21,22]. Peripheral neuropathy results from damage of the nerves responsible for the transport of the information from pressure receptors of the sole of the foot to the brain. These patients lose sensitivity from the sole of their feet and are therefore unable to sense injuries such as blisters. Infections, if left untreated,
can progress rapidly, leading to gangrene which follows suit to a lower limb amputation [23].
Other reasons for lower limb amputations are trauma (i.e. such as car and combat related accidents), cancer and congenital deformity or defects. In the United States, it has been surveyed that cancer and congenital reasons for amputation are continually decreasing. Trauma is responsible for 16% and cancer and congenital reasons merely 1% of all amputations [12,113]. Overall, dysvascularity is the most important and significant reason for amputation.
1.3 Level of amputation
Lower limb amputations can be performed at different levels according to the quality of the biological tissue. Amputation can be achieved by removing the toe, the foot, amputating through the shank (transtibial), the knee (knee disarticulation), the thigh (transfemoral) or by complete removal of the femur and femoral head (hip disarticulation).
In Canada and around the world, the most important level of lower limb amputation is the transtibial level (up to 65%), followed by the foot and transfemoral amputations [16,24]. The level of amputation is directly linked to sensorial and mechanical deficits. As well, the higher the level of amputation, the greater is the physiological demand [25]. Preserving as much biological tissue as possible provides important mechanical and physiological advantages for the transtibial amputee (TTA) when compared to the transfemoral amputee [26,27]. Therefore, when evaluating the level of amputation,
health care professionals consider the level of amputation, which will provide greatest function as well as best health outcomes.
Though advances and improvements in technology, medicine, diagnosis and care have allowed for a lower level amputation (transtibial vs. transfemoral), important bilateral biomechanical differences are experienced by the TTA. The loss of foot and ankle joint function must be compensated for by other strategies (i.e. intact limb, intact joints of prosthetic limb). Thus, this poses additional demand on the intact limb and joints [28].
As well, the results of several studies have indicated that dysvascular and traumatic TTA should be considered as different entities when conducting gait analysis and establishing a rehabilitation plan [27,29,30].
1.4 Particularities of lower limb amputees
The largest TTA population is that of the dysvascular TTA (DTTA). The DTTA have related and concurring conditions or disease and therefore, to some degree, also have dysvascularity in the non-amputated limb [31]. Concurring diseases such as diabetic retinopathy, which affects vision, may also have an impact on gait. Indeed, a decreased capability of the visual system, which provides the CNS with primary afferent information with regards to postural stability, leads to important balance issues [32]. As stated above, this as well poses important demands to stability and gait and posture may therefore be impacted, even in the intact limb. Other concurring risk factors in DTTA are obesity, hypertension and overall reduced physiological function often leading to cardiovascular health risks [29,33].
Being sedentary and overweight/obese are important precursor to type II diabetes. It has been shown that often these two factors are part of a cycle, associated with other important and aggravating health conditions (i.e. cardiovascular disease), in the individual with type II diabetes [33]. Motivation and other like psychological factors play an important role in this vicious cycle, and if walking is to even be envisioned after amputation, these concerns must be addressed.
Indeed, three months after the amputation, only 61% of TTA are reported to be ambulatory and this number decreases to 51% 2 years post-operative, while others never regain full function and necessitate a walking aid [34,35]. As well, two systematic reviews concluded that DTTA have a significantly reduced ambulation rate when compared to their traumatic TTA counterparts though no statistics or numbers were
provided other than the reduced VO2max values observed in the DTTA (i.e. 26-29%
reduced VO2max in DTTA when compared to traumatic TTA) [36,37]. Age is another
factor negatively correlated with ambulation and only about 2% of DTTA older than 85 years old are able to relearn walking [38,39]. Also, without change to hygiene and management of vascular issues (i.e. diabetes management, foot care, etc.), amputation of the contralateral limb is commonplace and further mechanical and physiological limitations are implicated with this second amputation [40]. These factors combined place the DTTA at greater risk of loss of autonomy.
Survival rate and overall life expectancy are lower in the DTTA population when compared to traumatic TTA [30]. Of those who suffer an amputation for vascular reasons, 50% will die within 5 years [114]. Also, over 15% will suffer a contralateral limb amputation within the next year, this number doubling for every year following
the amputation, which causes further reduction in function and increases physical demands and biomechanical deficits [41]. Therefore, though improving life expectancy and reducing morbidity risk are essential, improving the quality of life in the DTTA is also of importance. Preserving walking in the DTTA is imperative to maintain their autonomy.
Additionally, the prosthesis with which is equipped the TTA takes habituation for posture and locomotion as well as pain management. Fitting is very much trial and error, and often, several adjustments must take place before the best fit can be provided to the TTA. A thorough analysis of prosthetic devices is beyond the scope of this thesis, but the main two categories of prosthetic devices are presented here: passive and powered prosthetics. Passive prostheses are non-motorized, simple foot and rod mimicking the likes of the missing human foot and shank. These prostheses often have different composite materials aiding in providing some joint movement at the ankle as well as cosmetic material covering. These materials allow some compliance when body weight is put on the prosthetic, compliance, which is then restored to the TTA during toe-off [122,125]. Still other passive prosthetics called energy-storage-and-return, are designed to further allow for compliance and return of this stored energy to enable toe-off [41]. On the other hand, powered prostheses are designed to mimic the various missing anatomical structures, which provide propulsion to walking [147]. Powered prosthetics research is an area of increasing interest, but many obstacles are ever present in the design of these. Mimicking intact limb structures and power output has been shown to cause falls, and thus, powered prosthetic designers must build prosthetics that propulse during walking, without compromising stability [148].
Unfortunately, less than 43% of the DTTA patients have completed an inpatient rehabilitation program though these protocols have been associated with improvement in survival rate and general health as well as a decreased risk of re-amputation [115]. The following sections will explore walking in the TTA and DTTA when compared to healthy adults, in understanding the specific biomechanics of each population throughout gait. Then, in starting from a position of quiet standing, the initiation of gait will be compared between the DTTA and their healthy counterparts.
2. Steady-State Walking
2.1 Gait in Healthy Adults
Walking is the most common form of human locomotion and it is involved in almost all activities of daily living [28]. As well, walking is a fundamental building block to many more complex movements such as running and other sport and daily movements [79]. The primary goal of walking is to propel the body forward while maintaining posture and balance, all the while resisting gravity [80]. In order to accomplish this, walking is controlled by numerous muscles activated in sequence.
When born, it takes a child approximately 8 months (i.e. 6-12 months) to learn to stand erect using support [81,82,116]. However, on average, an additional 4 months are needed for acquiring autonomous walking. Walking is continually refined up until the age of approximately five years old, as children learn to narrow their stance, activate muscles in a synchronous and efficient manner, increase knee flexion during swing, etc. [83]. After the age of five, changes observed in gait are due to change in size and stature as children grow until 12 to 18 years old, depending on sex and genetics, and thus, gait changes are minor in adolescence [84]. Further differences are only seen in the presence
of important morphological modification, pathology and/or advanced age [85].
Likewise, the absence of walking or gait refinement in children as they age is an important indicator of disorder. Many indices and other like gait analysis tests have been formulated to assess for these developmental delays [86]. Then, in elder adults, important changes in walking are seen starting approximately at the age of 65 years of age [10,87,88]. Health and physical fitness level play an important role with regards to these changes in walking. Again, presence of pathology in the elderly most often impacting the walking pattern.
Because walking is an important indicator of mobility, it also defines independence. Thus, in the presence of pathology and older age, the ability to walk is an important indicator of overall health [1]. Because of the wide variety of disorders and pathologies, the impact on gait takes place in various ways and forms. To understand how pathology and disorder impact gait, gait analysis is therefore essential.
Muybridge and Marey were the first scientists to document on the mechanics of gait in the late 1800’s [2]. Using a series of photographs, Muybridge and Marey captured the various movements and phases involved in various human and animal movements. The images captured by the photographs provided an important basis for today’s gait analysis. This was the first attempt into understanding the mechanics of the complex task of walking [89]. Thereafter, during World War II, there was an increase in the numbers of amputations and with the need to build appropriate prostheses, gait biomechanics was, once again, the area of great interest. Finally, in the 1980’s, biomechanics came into study as a new field of research. Hence, the number of studies,
pertaining not only to biomechanics but also with regards to gait, importantly boomed. For example, a simple PubMed search with the keywords human gait reaches over 41 000 publications (January, 2018).
From this early period in biomechanics, the techniques, the measurement instruments, their precision and the knowledge concerning gait analysis have been developed in overwhelming quantity and variety. Today, in an era of evidence-based medicine, the need for quantitative analysis is imperative and important advancements in this regard have been made. Indeed, such tools as sophisticated motion capture and analysis systems are able to record and provide quantitative kinematic gait information with high precision and three-dimensional (3D) reconstruction of movement and segment modeling are possible. Force platforms, recording CoP and ground reaction forces (GRF), provide precise and minute kinetic data of gait, allowing to understand not only the movement created about various segments and joints, but rather how and through which means this movement is created (CoP and GRF are described below in sections 3.1 and 4.1, respectively). By quantifying the biomechanics of human movement, it is possible to observe differences intra-individually. Comparisons can also be made inter-individually to compare pathology with healthy controls. To quantify these differences and the walking pattern, spatiotemporal, kinematic and kinetic parameters have been investigated.
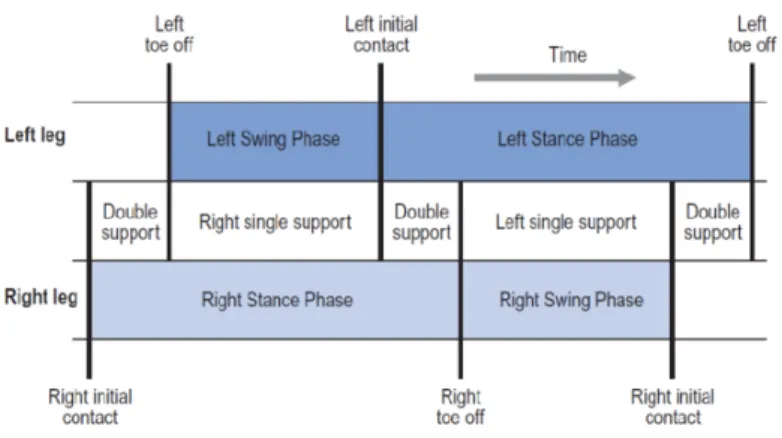
The gait cycle has been extensively studied and outlined and various terms have been used to describe it. The current thesis will describe that provided by Whittle and is illustrated below in Figure 1 [90]. One complete gait cycle is defined from the heelstrike of the right or left foot to the subsequent heelstrike of the same foot. During this gait
cycle, the limb goes through a support and swing phase. During the support phase, the foot is in contact with the ground, from heelstrike through toe-off. During the swing phase, the foot leaves the ground and the leg swings forward, with the knee flexed, and ends at the next heelstrike. In healthy adults, support phase is approximately 60% of the gait cycle and swing phase accounts for approximately 40% of the gait cycle. The support phase can be divided into a single support phase (40% of gait cycle), when only one limb is in contact with the ground, and two double support phases (each of 10% of the gait cycle) when both feet are in contact with the ground [90].
Figure 1- Illustration of gait cycle phases. One complete gait cycle of both the right
and left limbs is illustrated with respect to time (Adapted from Whittle (1996) [90]). Within each support and swing phases, the limb goes through various sub-phases. Again, the following sub-phases of the gait cycle described below are an excerpt from Whittle (1996). As soon as the first heelstrike takes place, both feet are simultaneously in contact with the ground (i.e. first double support period). There is then a loading response in which the knee flexes, in order to cope with the large amount of body weight that is placed on the limb. At this point, the lowest height of the center of mass (CoM) is reached. Next, during midstance, the knee extends to a straight leg as the body travels over the standing limb. The maximum height of the CoM is reached at full knee
extension. During terminal stance, the heel rises from the ground as the opposite heelstrike occurs, initiating the second double-support period. The ankle plantarflexors are actively involved in pushing the limb into swing, creating the second single limb support phase. Finally, during swing, the knee flexes in order to help in swinging the limb forward, and the knee then extends for the next heelstrike. As this subsequent heelstrike occurs, the gait cycle is repeated once again. The gait cycle described above is also known as the stride cycle, when referring to each limb.
Spatiotemporal parameters are those parameters which quantify both time and distance of the different phases during gait. As such, walking velocity is the defining parameter for steady-state gait [91]. As stated, average SSWV is 1.3 to 1.5 m/s in healthy adults, and this SSWV has been shown to be dependent on stature, weight and other non-anthropometric or morphological characteristics (i.e. maximum oxygen consumption) [57,92]. When walking at SSWV, studies have shown that energy efficiency is optimized for an individual, as walking at a slightly reduced or faster walking velocity will result in increased metabolic demands [93]. Other common spatiotemporal parameters include, and are not limited to, cadence, stride/step length, stride/step width, stride/step time and single/double support and swing times.
Interestingly, most spatiotemporal parameters are related to walking velocity. By increasing either cadence or stride length for example, walking velocity can be augmented. As well, stride length is a limiting factor to increasing walking velocity as it is a function of stature and functional range of motion (i.e. length of limb, flexibility, etc.) [94]. Because walking velocity is an encompassing variable, its measurement is significant and allows insight into the other parameters which it modulates.
Numerous studies have outlined a reduction in SSWV in older adults, with the onset of this reduction appearing around 55 to 65 years old, dependent on physical fitness levels, health and other such factors [93,95]. Additionally, there is a significantly greater reduction of SSWV in the elderly affected by different pathologies [78,96].
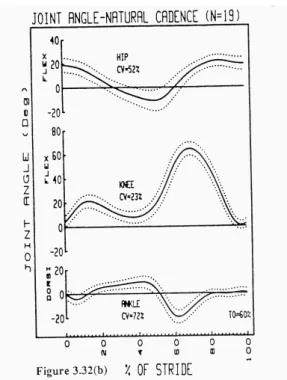
Along with the spatiotemporal parameters which describe gait, the joint kinematic parameters during SSWV follow a specific pattern in healthy adults. The average sagittal plane joint angular kinematics of the ankle, knee and hip are outlined below in Figure 2 in 19 healthy adults walking at SSWV and will be discussed in the following paragraphs with respect to SSWV in healthy adults [10].
At heelstrike, there is hip flexion of the amplitude of about 20°. Then, as the body travels over the leg to final push-off, the hip progresses from flexion to a maximum extension of approximately 12°. Finally, at heel-off through to swing, there is a flexion of the hip, maximum flexion (i.e. approximately 20°) observed during late swing.
The foot contacts the ground with the knee fully extended. Then, with weight acceptance, the knee flexes to about 20°. As the body travels over the foot during midstance, there is then an extension of the knee to about 5° of flexion, and this is as well associated with the lightening phase discussed further below with regards to the vertical GRF (i.e. minima value in midstance). Finally, with final push-off and swing, the knee flexes to a maximum of about 60° reducing its radius of gyration to allow the leg to successfully swing forward, then extending at the end of swing for the next heelstrike.
Finally, with regards to the ankle, there is a small plantarflexion of about 3° after initial heelstrike to flatfoot. With the phases of weight acceptance and midstance, there is progressive dorsiflexion to a maximum of about 10°. Perhaps the most important joint movement, as well discussed further below with regards to moment and power, comes with the maximum ankle plantarflexion amplitude of approximately 20°, at the push-off phase just prior to toe-push-off. There is then rapid dorsiflexion during early and midswing to help foot clearance. Then, the ankle is kept approximately in neutral position (i.e. 0° plantarflexion/ dorsiflexion) until the next heelstrike.
Figure 2- Joint angular kinematics of the lower limb. Average (solid line) and
coefficient of deviation (dotted lines) joint angles of the ankle, knee and hip in 19 healthy adults for one stride cycle. Positive values display flexion, flexion and dorsiflexion at the hip, knee and ankle, respectively (Adapted from Winter, 1991 [10]). Though the movement of the lower limbs (i.e. kinematics) during the gait cycle has been discussed, with the accompanying spatiotemporal parameters, the underlying
forces which produce these movements are also of importance. Thus, the interaction of the CoP and CoM as well as the underlying kinetics during SSWV in healthy adults will be discussed in the following paragraphs.
Walking is a unique example of the regulation by the CoM by the CoP. When walking, the CoM is projected beyond its base of support and caught again within the base of support with the heelstrike of the next step. This pattern is repeated as the CoM is pushed along, being caught and pushed again from step to subsequent step [97].
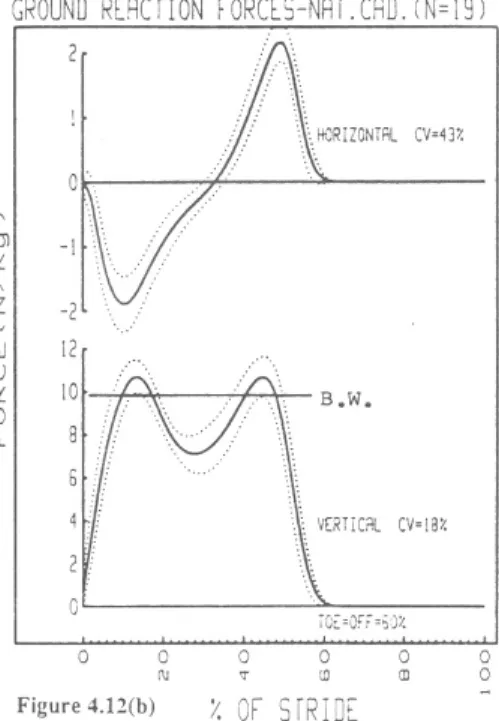
At a SSWV, the vertical GRF pattern beneath each foot is that of double hills with a valley. The first peak represents initial loading of the limb after heel contact and the magnitude of the force rises to 11 N/kg (i.e. 1.1 times body weight (BW)). The slope of the vertical force from heel contact until maximum weight acceptance (first peak of vertical GRF pattern in Figure 8) is referred to as the loading rate (N/s). Hence, the steeper the vertical force time profile, the greater the loading rate [147]. The valley, between both vertical GRF peaks, represents a lightening phase during midstance (described above) with a force of approximately 7.5 N/kg (i.e. 0.75 times BW). This is caused by the ipsilateral knee extension and the contralateral toe-off and knee flexion, which aids in moving the leg upward into swing. The second peak represents push-off from the plantarflexors through to toe-off, the magnitude of which is approximately 11 N/kg (i.e. 1.1 times BW). This vertical GRF pattern is outlined in Figure 3 below.
During SSWV, the typical GRF pattern in the antero-posterior (A/P) direction is an initial braking force followed by a propulsive force. The braking GRF are represented as negative values and the propulsive GRF are represented as positive values in Figure
3. At SSWV, the braking and propulsion GRF are equal. If the force applied in the anterior and posterior directions are not equal, there will be an increase or decrease in walking velocity, depending on whether braking or propulsion force is greater [68]. In SSWV, the peak magnitude of both the braking and propulsive forces are approximately 2 N/kg (i.e. 0.2 times BW). The midpoint, at which the braking force switches to a propulsive force, is at 50% of the stance phase, or 30% of the total stride cycle, as outlined in Figure 8.
The medio-lateral (M/L) GRF applied during SSWV are omitted from the current thesis as they did not contribute to forward propulsion of walking.
Figure 3- A/P and vertical GRF profiles during SSWV (top to bottom). Average
GRF pattern in 19 healthy adults during walking at SSWV expressed in N/kg and over 100% stride cycle. Positive values describe propulsive A/P and vertical GRF. BW is outlined by the straight line B.W. on the vertical GRF profile (Adapted from Winter, 1991 [10]).
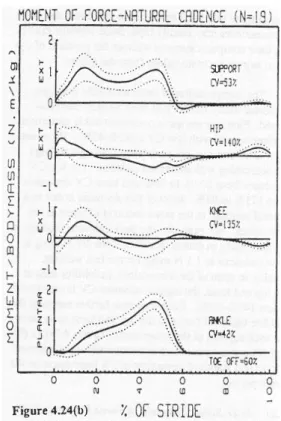
combination of anthropometrical data, kinematic and kinetic parameters with an inverse dynamic approach [28,66,98]. Thus, the net moment at the ankle, knee and hip can be estimated. Moments at the joint provide insight into the net muscle effect on the joint. For the current analysis, moment at the ankle, knee and hip will be considered positive moments if they produce net moment about the joint in resistance to gravity and forward motion. That is, the extensor moment produced at all three lower limb joints. The average sagittal plane moment at the ankle, knee and hip joints and total support moment for 19 healthy adults is outlined in Figure 4 and are discussed hereafter with regards to the net muscle moment active about each lower limb joint [10].
A small net dorsiflexor moment, created by the tibialis anterior contraction, is first present at the ankle during heelstrike to help in lowering the foot to the ground (i.e. from heel contact to foot flat in weight acceptance) [99]. Then, there is a plantarflexor moment created by the gastrocnemius- soleus muscle complex which starts after weight acceptance and grows to about 2.0 Nm/kg prior to push-off. This muscle moment is the most important propulsive contribution to walking. That is, approximately 80% of propulsion can be accounted for by the moment created at the ankle during push-off [10]. Thus, the absence of the ankle joint produces important deleterious effects to forward propulsion. The important contribution of this plantarflexor moment to walking is discussed further with regards to power.
At the knee, there is an extensor moment produced by the quadriceps muscles in early stance to control the knee flexion during the weight acceptance (i.e. about 0.5 Nm/kg). There is then a net knee flexor moment during midstance created by the hamstrings (i.e. about 0.2 Nm/kg). Just prior to and after toe-off, there is a small net knee extensor
moment again produced by the quadriceps, which acts in controlling the knee flexion caused by the strong ankle push-off (i.e. about 0.1 Nm/kg). Just prior to next heel contact, during late swing, there is a net knee flexor moment by the hamstrings which helps in decelerating the leg and foot (i.e. about 0.15 Nm/kg).
At heelstrike, there is an initial net hip extensor moment (i.e. about 0.4 Nm/kg) by the gluteal muscles which aids in preventing the knee from collapsing at heelstrike and weight acceptance phases. This is followed by a net hip flexor moment created by the iliopsoas muscles, from mid-stance to early swing (i.e. maximum net moment of about 0.4 Nm/kg). Finally, during the latter half of the swing phase, the net extensor moment observed at the hip by the gluteal muscles helps in decelerating the thigh and leg as it swings forward for the subsequent heelstrike, with a small moment of about 0.3 Nm/kg.
As stated, positive moments describe the extensor moment at all three joints which resist gravity and produce forward progression. The summation of these three moment profiles is termed the support moment, defined by:
Msupport = Mankle + Mknee + Mhip (Equation 1) [99]
The magnitude of this support moment peaks at approximately 1.0 Nm/kg during weight acceptance and terminal stance. Finally, it has been noted that the pattern of support moment resembles that of the vertical GRF as the support moment is a clear reflection of the forces applied to the ground [98].
Figure 4- Ankle, knee, hip joint and support moments during SSWV (bottom to
top, respectively). Positive moment is defined as extension for the support, hip and knee moment and as plantarflexion at the ankle joint. Average sagittal plane joint kinematics for 19 individuals walking at natural cadence (Adapted from Winter, 1991 [10]). Power is an additional parameter which can be obtained by combining kinematic and
kinetic data [28]. Power (in Watts) at a given joint (Pj) is obtained by combining the net
joint moment (Mj) with angular joint velocity (wj).
Pj = Mj x wj (Equation 2)
When the moment and angular joint velocity have the same polarity, this is defined as power generation created by a concentric contraction of the muscle group involve. Power absorption is defined as when the joint moment and angular joint velocity have opposite polarities and the muscle group is acting in an eccentric contraction [28].
Figure 5 below outlines the average sagittal plane power profiles at the ankle, knee and hip during SSWV in 19 healthy adults. The various peaks throughout the respective power profiles have been identified at the ankle (A1, A2), the knee (K1, K2, K3, K4) and finally at the hip (H1, H2, H3). These specific bursts will be discussed below with regards to each joint for the data displayed in Figure 5 [10].
At the hip, the three bursts of power can be defined by two power generation (H1 and H3) bursts and one power absorption burst (H2). H1, present after heelstrike and throughout weight acceptance, is marked by power a generation created by the extending hip angle and the net extensor moment about the hip (i.e. about 0.2 W/kg). Then, during midstance to late stance (20-50% of stride), there is the H2 power absorption burst created by the extending hip angle and the net hip flexor moment. The H2 peak power absorption burst has been documented at about -0.2 W/kg. Finally, during push-off through to initial swing, there is a final H3 power generation burst of approximately 0.6 W/kg peak, the most important power burst at the hip in terms of magnitude, associated with the action of the flexing hip and the net flexor moment created at the hip.
At the knee, the K1 burst is the first power absorption during weight acceptance as the knee is flexing and a knee extensor moment is present (i.e. approximately of -0.5W/kg). Then, the K2 burst (0.2W/kg) occurs during midstance as the knee is extending and an extensor moment is present producing power generation. This is the sole power generation produced by the knee. From just prior to toe-off through mid-swing, as the knee is flexing under a net knee extensor moment, there is again a power absorption burst with a peak of about -0.5W/kg, identified as K3. Finally, during the latter half of
the swing, the knee joint starts to extend as the knee moment also reverses to a flexor moment, thus creating the last K4 power absorption burst of approximately -0.5 W/kg. Thus, the overall power output of the knee is absorption, rather than generation [28].
After initial heelstrike there is a net dorsiflexion moment as the ankle is plantarflexing, causing the first ankle absorption burst, A1. A1 continues as the ankle is dorsiflexing in weight acceptance and a net plantarflexion moment is created about the ankle. The maximum magnitude of A1 is approximately -0.5 W/kg. The most important power generation is then produced at the A2 power burst, present from about 40 to 60% of the stride cycle. The large A2 power burst coincides with the second peak of the vertical GRF and the peak propulsive A/P GRF, making A2 the primordial contributor to biomechanical energy in walking [28]. This A2 power generation peak is of the magnitude of approximately 3.5 W/kg and coincides with the maximum plantarflexor moment as the ankle is plantarflexing, created by the gastrocnemius-soleus contraction and the important amplitude of ankle plantarflexion movement displayed at the ankle producing an important push-off.
Figure 5- Power profiles of the ankle, knee and hip joints (from bottom to top,
respectively). The average sagittal plane power profiles of 19 individuals during SSWV are expressed in W/kg (Adapted from Winter, 1991 [10]).
Thus, in the absence of plantarflexor muscles (i.e. gastrocnemius-soleus muscle complex) and with the amplitude reduction of ankle range of motion (i.e. prosthetic foot), gait is inevitably impacted. The following section will therefore characterize the gait pattern in such a situation, that of the TTA and DTTA.
2.2 Gait in the TTA and DTTA
As will be seen with quiet standing and gait initiation, important biomechanical differences are present in the TTA and DTTA when compared to healthy adults during SSWV. Moreover, important differences are also denoted between the traumatic TTA and DTTA. These differences will be compared with regards to spatiotemporal,
kinematic and kinetic parameters. Finally, the relevance of these parameters for gait analysis will be discussed.
First, with regards to spatiotemporal parameters, it is known that the TTA walk at a reduced SSWV when compared to able-bodied individuals. This velocity has been shown to be approximately 1.0 m/s [77] when compared to about 1.3 to 1.5 m/s in healthy adults [118,119,120,121].
The stride length and cadence during SSWV in the TTA are also reduced when compared to controls [109,117]. This is to be expected as both stride length and cadence contribute to the calculation of walking velocity (i.e. Equation 1).
Important differences are also present between the intact and prosthetic limb throughout SSWV in the TTA [109,129]. There is an increased contribution of the intact limb to forward motion (i.e. examined below with regards to GRF), as there is also increased loading on the intact limb when compared to the prosthetic limb throughout gait [144]. As well, TTA spend less time on their prosthetic limb when compared to their intact limb when walking. Total stance time is increased, especially in the intact limb, and double support time is also increased [145,146].
As with gait initiation, the most important change to kinematics during SSWV in the TTA is due to the missing ankle joint. That is, when examining the sagittal plane ankle angle kinematics, the 20° plantarflexion angle observed during push-off in healthy adults is approximately 5° in the prosthetic limb [122].
In studies observing kinetic gait differences in TTA, it was found that TTA exhibit a decreased knee moment and increased hip moment contribution at SSWV. In addition, TTA exhibit a passive moment at the prosthetic ankle [11,123,124,125]. Figure 6 below outlines the average support, hip, knee and ankle moment profile in eight below-knee amputees (adapted from Winter & Sienko, 1988 [11]).
Figure 6- Average sagittal plane ankle, knee, hip joint and support moments in 8 below-knee amputees (Top to bottom, respectively). Moments are expressed as a
percentage of total stride cycle and in Nm/kg (Adapted from Winter & Sienko, 1988 [11]).
The most important changes to gait in the TTA are due to the loss of the ankle plantarflexors, which permit propulsion, whole body support and initiation of limb swing [6,11,126,127]. The prosthetic foot provides a passive ankle moment, as the force and moment created at the prosthetic ankle are generated by the BW applied to the prosthesis (i.e. compliance). This compliance of the prosthesis has been shown to provide some energy storage and return as it bends under the BW and energy is returned
as BW is unloaded. That is, as the ankle dorsiflexes during early stance phase and through to flat foot, energy is stored to the prosthesis which is then released during late stance push-off phase. However, this mechanical energy released by the prosthesis has been documented to be less than half release of that usually produced by the ankle plantarflexor muscles [100,122,128]. Most studies investigating the compliance and energy return of the prosthetic feet have done so in comparing various types of prosthetics. The comparison of various prosthetic devices is, however, beyond the scope of this thesis.
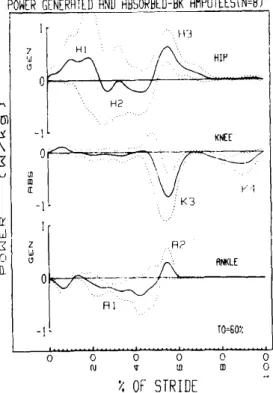
Finally, due to the loss of ankle joint at the prosthetic limb, there are compensatory biomechanics produced. As observed in Figure 7 below, a reduced A2 power generation phase is accounted for by the loss of the plantarflexors in the prosthetic limb (i.e. about 0.2 W/kg vs. 3.0 W/kg in TTA vs. controls, respectively). At H1 in Figure 7, there is considerably more power generated by the hip extensors when compared to controls (i.e. about 0.5 W/kg vs. 0.2 W/kg in TTA vs. controls, respectively). Winter and Sienko (1988) have proposed that the extensor gluteus maximus muscle of the hip somewhat compensates for the missing plantarflexors, aiding the below-knee amputee to propel the body forward [11]. Figure 7 below outlines the average sagittal plane power profiles in 8 below-knee amputees for the hip, knee and ankle joints.
Figure 7- Average sagittal plane ankle, knee and hip power profiles in 8 below-knee amputees (top to bottom, respectively). Expressed as a function of stride cycle
and in W/kg (Adapted from Winter & Sienko, 1988 [11]).
The many spatiotemporal, kinematic and kinetic parameters presented in the above section on gait at SSWV as well as will be presented in the below sections on quiet standing and gait initiation, make proof of the wide array of parameters available for gait analysis, both in healthy adults and amputee populations. Thus, when selecting parameters to observe during gait analysis, scientific rigor is necessary in establishing the best parameters with which to conduct gait analysis. The following paragraphs will therefore explore the topic of parameter relevance for gait analysis.
The differences denoted in the TTA and DTTA testify of the importance of gait analysis as a mean to diagnose pathology, set a prognosis and establish and evaluate a treatment plan [101,132]. A wide diversity of parameters of various types exists and are readily used to examine and explain human gait [128,130,131,134]. Also, though the variety
of equipment available today in clinical settings, gait analysis is often carried out solely through clinician observation [102]. Although clinicians have developed good expertise through many years of practice and training, clinician observations (i.e. most often with regards to angular kinematics and differences between the limbs) remain subjective [103,133]. Principal reason for main, and perhaps sole use of clinician observation as means of gait analysis, is ease of measurement and cost efficiency [131,133,135].
Motion capture and analysis systems, force transducers and transmitters are but examples of the wide variety of tools which exist and have been developed for gait analysis. Additionally, a wide selection of specific products and brands exist within each category of gait analysis tools. Therefore, the variety and amount of quantitative data possible is seemingly infinite and selecting which data, gait analysis method and tools for data collection can be a challenge in itself. Indeed, selection of method, measures and tools of measurement for gait analysis is of primordial interest. Moreover, before and after data collection, decision with regards to appropriate gait parameter for gait analysis is even more important.
In accordance with evidence-based-medicine, the biomechanical parameters chosen are important to rigorous gait analysis [104]. Because of the large number of parameters available, it seems reasonable that certain parameters would be best suited for gait analysis in specific populations.
Thus, systematic reviews are realized in an attempt to organize and add understanding to the practice of gait analysis in various populations. Sagawa and colleagues conducted a systematic review of all applicable studies, to determine the most relevant
biomechanical and physiological parameters for gait analysis in the lower limb amputees. The term relevant was defined as those parameters commonly used, able to discriminate and/or have specific clinical relevance for the gait analysis of lower-limb amputees. These studies were selected based on inclusion and exclusion criteria, constituting a review of homogeneous studies with regards to lower-limb amputee gait analysis. In this unique systematic review, by pooling such studies and tabulating the measured biomechanical parameters, a certain valuation of the biomechanical parameters for lower-limb amputees was carried out. Physiological and other parameters explored by Sagawa et al. are beyond the scope of this study and will thus be omitted from this current thesis.
As well, a Level of Evidence score (out of 13) was given to each of the 89 articles included in the Sagawa systematic review based on: 1) selection of participants, 2) intervention and assessment, and 3) statistical validity. The Level of Evidence score was then compared to the Impact Factor of the journal in which each included article was published.
No relation was found between the established Level of Evidence and the Impact Factor. As well, most articles (i.e. 73%) did not have sufficient participants for statistical validity and thus, in interpreting the results, Sagawa and colleagues recommended the reader to be cautionary. The authors concluded that a wide variety of parameters were pertinent to gait analysis in lower-limb amputees, namely walking velocity, and other like spatiotemporal parameters (i.e. cadence, step length and stride length), joint angular position of the lower limb joints and kinetics recorded from force platforms below the feet providing GRF and impulse parameters. However, the authors
concluded that there was a lack of consensus among the included studies, and other systematic reviews should be carried out in the hopes of providing a more evidence-based approach to gait analysis [105]. The measured parameters in the 89 included articles are outlined below in Table 1.
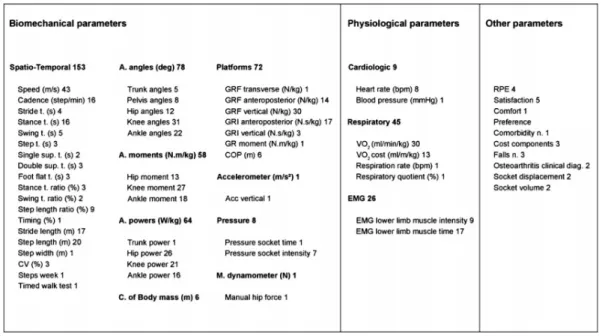
Table 1- Frequency of parameters measured in the 89 articles included in the systematic review of lower limb amputee gait by Sagawa et al. 2011. Type of
parameters (frequency of measurement) are listed as headings and individual parameters (frequency of measurement) of same type are listed beneath (Adapted from Sagawa et al. 2011 [105]).
Sagawa and colleagues’ approach in tackling the tough question of parameter relevance included a very broad population, that of lower limb amputees. Knowing that the unilateral and bilateral, the transtibial and transfemoral and finally, the traumatic and dysvascular amputee pose very specific constraints in gait, the most relevant parameters for gait analysis are perhaps varied throughout these numerous specific populations (i.e. DTTA vs. traumatic bilateral transfemoral amputee).
also important. The numerous parameters identified by Sagawa et al. are perhaps not time and cost efficient in the clinical setting. However, the various spatiotemporal parameters, such as walking velocity, are cost efficient and can be measured with ease.
The results obtained by Sagawa and colleagues leads to question whether the same biomechanical parameters are most relevant for gait analysis in healthy adults. Indeed, knowing the most relevant parameters for gait analysis in healthy adults would allow for comparison with pathologic populations and serve as reference for gait analysis. Thus, a systematic review evaluating the most relevant parameters for gait analysis in healthy adults is warranted to compare with the lower limb amputee population.
3. Quiet Standing
3.1 Quiet Standing in Healthy Adults
When standing upright, and seemingly immobile, an individual is constantly making minor adjustments in response to external and internal stimuli. Thus, the term quiet standing is used to describe this state [8].
In healthy adults, quiet standing has been explained via the theory of the inverted pendulum [42]. Two important variables with regards to biomechanics are here discussed, first introduced in section of SSWV above: total body CoM and net center
of pressure (CoPnet). CoM is a point at which the total body mass can be averaged. The
CoM is a passive variable whose position is expressed in metres within the 3D space
[43]. The CoPnet is a point which represents the position of application of the resultant
forces under the foot/feet during standing and walking. The CoPnet can be calculated
right and left CoP can be measured beneath each foot with two separate force platforms.
The CoPnet is the weighted average of both the CoPright and CoPleft [43].
In an effort to keep the CoM within the base of support, the CoPnet is continually moving
in such a way as to catch up and regulate the CoM (i.e. maintain balance). That is, the
CoPnet is the independent variable which modulates the CoM position. In quiet standing,
the goal is to keep the CoM within the base of support. If the CoM moves beyond the base of support, important action must take place to avoid falling. Most often a step is taken in the direction of the excursion of the CoM to catch the CoM and bring it back within the new base of support [8]. Such calculations as the CoP-CoM parameter, which represents the distance between the CoP and the CoM in terms of the root mean square (RMS), have been used to reflect postural sway, and thus postural control [149].
Control of the inverted pendulum is made possible by the visual, vestibular and somatosensory systems. Thus, if one or more of these systems is absent or impaired (i.e. eyes closed or sensory loss with amputation), control of the inverted pendulum is challenged [44]. Signs of reduced balance control is associated with an increased risk of fall and postural sway provides an objective measure of balance control [45,46,47].
Postural sway has been defined as the A/P and M/L amplitudes of the CoPnet
displacements during quiet standing [8].
3.2 Quiet Standing in the Transtibial Amputee
In a systematic review of quiet standing studies conducted among lower limb amputees, it was concluded that greater imbalance is observed in this population when compared to healthy adults. Postural stability was observed as a function of the sway amplitude,
sway velocity, total sway area as well as RMS amplitude of CoPnet in both A/P and M/L
directions [48]. The A/P and M/L CoPnet amplitude is defined by the distance between
the maximum excursion points of the CoPnet in opposite directions (i.e. measured in
mm). A/P and M/L CoPnet velocity is defined as the distance travelled by the CoPnet
over time (i.e. measured in mm/s). The CoPnet RMS is used to quantify the deviations
from the mean of CoPnet velocity or amplitude displacement. The overall increase in
the amplitude and velocity of CoPnet observed in the review of TTA posture by Ku et
al. can be explained by asymmetrical and greater loading placed onto the intact limb [48,49,50,51].
Balance has also been investigated in the DTTA and traumatic TTA. Hermodsson and colleagues (1994) assessed quiet standing and one limb stance in the DTTA, the TTA and healthy adults. When quiet standing was measured, the DTTA demonstrated increased sway in the M/L direction when compared to the traumatic TTA and control
subjects (i.e. measured as the standard deviation of the M/L CoPnet amplitude).
Interestingly, no increased A/P sway was observed in the DTTA when compared to controls, and the traumatic TTA group demonstrated significantly decreased A/P sway when compared to controls. It has been theorized that this may be due to the stiff ankle created by the prosthesis in all TTA, as a prior study had suggested [52]. Thus, the
traumatic TTA would appear to better maintain control in the A/P CoPnet direction as
well. Hermodsson and colleagues conclude that postural stability measures discriminate between the DTTA and traumatic TTA [29]. Such a study warrants the need to differentiate between cause of amputation when conducting postural analysis, as reason for amputation creates unique underlying biomechanics [48].
In quiet standing, the CoM projection is maintained within the base of support by the
movement of the CoPnet. Locomotion requires unbalancing of the CoM to produce
forward progression [8]. The following sections will therefore address the biomechanics of gait initiation in healthy adults, TTA and DTTA populations.
4. Gait Initiation
4.1 Gait initiation in Healthy Adults
Along with quiet standing, gait initiation is involved in each walking bout. Gait initiation has been defined as the transitory state from quiet standing to steady-state walking [53]. The goal in gait initiation is to go from a state of static balance, with the CoM safely within the boundaries of the base of support, to a state of dynamic balance (i.e. controlled imbalance) [54]. For the purpose of the current thesis, gait initiation will be analyzed from the APA prior to gait initiation through to the forces produced by the first step to accelerate the CoM and until the SSWV is reached. As well, for the current analysis, the limb which initiates the first step will be termed the leading limb. The trailing limb will define the limb which is loaded as the leading limb initiates the first step.
Gait initiation can be described with various biomechanical variables such as the CoPnet
movements beneath the feet in both A/P and M/L directions, known as the APA’s, the kinematics of segments and the kinetics exerted under the activity of muscle contraction. This section will first explore the APA’s which precede, and take place during, gait initiation.
each limb contributes approximately in the same manner to forward progression. Conversely, in gait initiation, the roles of each limb are quite distinct and under different command [55]. Indeed, in quiet standing, prior to the APA’s and gait initiation, each limb is initially loaded to about 50% of the BW. When initiating gait, all BW must be placed onto one limb, (i.e. trailing limb) freeing the other limb (i.e. leading limb) and allowing it to swing forward for the first step to be made. In doing so, important challenges to balance are posed. In fact, placing the entirety of the BW on one limb necessitates sufficient strength and control in the trailing limb. As described above, to produce a forward movement of the body CoM, in keeping with the model of the
inverted pendulum outlined above, the CoPnet must move posteriorly in order to
destabilize and push the CoM forward via the APA’s [42].
Gait initiation has been well described in healthy adults and numerous studies have
investigated the APA’s of the CoPnet and CoM interaction [41,52,55,56]. The APA’s in
gait initiation have been defined by four distinct phases [106]. These APA’s are related
to the displacement of the CoPnet in both the A/P and M/L directions and take place in
the following sequence: 1) APA1 is a displacement of the CoPnet posteriorly and
laterally toward the leading limb; 2) APA2 is a medial and slightly anterior
displacement of the CoPnet towards the trailing limb, as BW is loaded to the trailing
limb. The end of the second phase occurs when the CoPnet is approximately centered
between both limbs and there is heel-off of the leading limb; 3) APA3 is a posterior and lateral displacement towards and beneath the trailing limb, which takes place as there is leading limb toe-off; and finally, 4) APA4 is a rapid forward displacement of the
CoPnet with the trailing limb toe-off, the CoPnet travelling from heel to toe-off. Indeed,
through to toe-off of the trailing limb [56]. A sketch of the APA’s CoPnet trajectory is
outlined below in Figure 8.
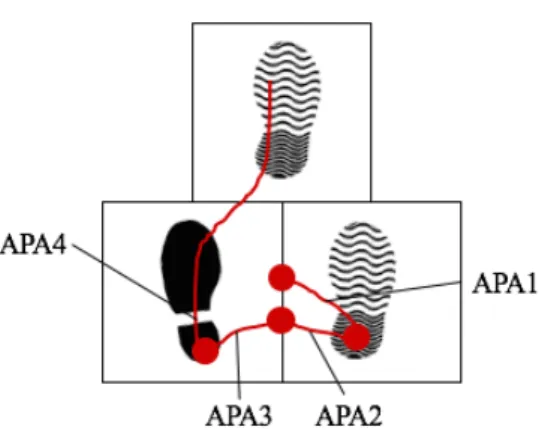
Figure 8- CoPnet displacement in the four phases of APA’s involved in gait
initiation. Left foot (solid black) is the trailing limb while the right foot (gray outline)
is the leading limb, initiating the first step. Four distinct APA phases (APA1-APA4)
and associated CoPnet displacement (red line) are shown. APA1 is a displacement of the
CoPnet posteriorly and laterally toward the leading limb; APA2 is a medial and anterior
displacement of the CoPnet towards the trailing limb; APA3 is a posterior and lateral
displacement towards and beneath the trailing limb and finally, APA4 is a rapid forward
displacement of the CoPnet on the trailing limb.
During the sequential APA phases described above, the lateral displacement of the
CoPnet allows the leading limb to be unloaded and total BW is transferred to the trailing
limb (i.e. displayed as left on Figure 8). Simultaneously, the backward CoPnet
displacement pushes the CoM forward as the leading limb leaves the ground. The
efficacy of this CoM push is related to the body configuration and the CoPnet position.
When standing upright, approximately 2/3 of total BW is carried by the head, arm and trunk segments and the associated CoM is also located at approximately 2/3 of the height of the individual. This geometry makes the inverted pendulum inherently unstable [42]. During gait initiation, the subjects take advantage of this biomechanics,
moving the COPnet backward which pushes the CoM in a forward progression [42].
After the initial APA phase, gait initiation is also produced by the application of forces on the ground generated by movements of the lower limb segments. Thus, the
spatiotemporal, kinematic and kinetic parameters during gait initiation will be presented in the following paragraphs.
During quiet standing, the CoM velocity is negligible, and through gait initiation, CoM accelerates and reaches SSWV. This SSWV is specific to each individual in order to minimize the energy expenditure [15,27], and reach a SSWV of approximately 1.3 to 1.5 m/s with a very low intra-individual variability in healthy adults [57,58,59,60]. That is, greater physiological and energetic demands are present at slower or faster walking velocity than that of SSWV [61,62].
Spatiotemporal parameters, such as cadence (number of step per minutes), step and stride length have seldom been studied with regards to gait initiation [56,63,64]. Most spatiotemporal parameters arise from SSWV as is seen in equation 3.
walking velocity (m/s) = cadence (step/min) x stride length (m) (Equation 3)
120
SSWV is thus an important encompassing parameter. Therefore, the spatiotemporal parameters of the first step of gait initiation are modulated according to the speed at which gait initiation is performed [65]. Most studies investigating gait initiation have focused solely from the APA through to toe-off of the trailing limb, without interest for the underlying biomechanics of the first step of gait initiation, thus omitting spatiotemporal parameters other than SSWV [42,53]. Hence, fewer studies have evaluated the biomechanics of the whole process of gait initiation, providing data with regards to the spatiotemporal parameters of the first step(s) in gait initiation [56,63,64].
Park et al. found that the step and stride length, along with walking velocity, gradually increased from gait initiation until SSWV was reached, the main difference occurring between quiet standing position and the first step. For example, they reported that the step length was 0.40 to 0.60 m in the first step made with the leading limb as opposed to a step length of 0.70 m reached during SSWV. After the first step, all spatiotemporal parameters were said to approach and resemble that of SSWV [110].
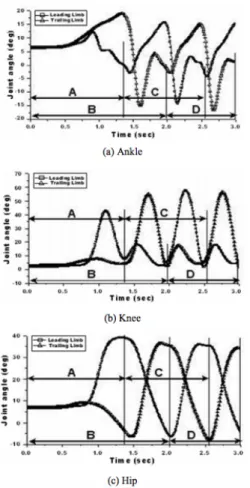
Kinematics are those biomechanical parameters which describe movement, without concern for the forces which produce it [43]. In gait analysis, kinematics typically describes the position, velocity and the acceleration of segments and joints when they are moving in both linear and angular 3D space. Park and colleagues documented joint angle kinematics in 20 healthy male adults [110]. Figure 9 below outlines the average sagittal joint angles throughout 15 gait initiation trials, from the APA through to SSWV. The results of the ankle joint kinematics of the leading limb showed a plantarflexion of 12.7° (compared to about 20° in healthy adults during SSWV) and the trailing limb showed 19.8° at heel-off [66]. For the leading limb, from quiet standing, through APA, to step 1 (Interval A in Figure 9), the maximum knee flexion was reduced and the maximum hip flexion was increased when compared to SSWV.
As with the spatiotemporal parameters, the joint kinematics progressively resembles that of SSWV with each additional step from gait initiation. Moreover, the first step is involved with the most important changes in producing joint kinematics which resemble that of SSWV, each additional step thereafter producing minor adjustments until SSWV.
Figure 9- Sagittal plane joint angles of the (a) ankle, (b) knee and (c) hip during gait initiation. Average profiles for 15 gait initiation trials in 20 healthy male adults.
Interval A represents the gait initiation to heelstrike in the leading limb and interval C is the second step in the same limb. Interval B represents gait initiation to trailing limb heelstrike and interval D represents the second step of the trailing limb. (Adapted from Park et al. 2009 [110])
Kinetics are those biomechanical parameters which describe the forces that produce movement [43]. Of many various kinds, these parameters are most often divided between CoP and forces. The GRF are those forces equal and opposite to the forces applied to the ground[43]. GRF are inputs for CoP calculation and are typically measured via force plates in all three directions: A/P, M/L and vertical. These provide important insights into how BW is loaded and unloaded (via vertical forces) and how the CoM is accelerated in the horizontal plane via A/P and M/L forces. GRF can also be quantified with regards to the peak force applied, loading rate (speed of force applied) and their associated temporalities. In order to compare between individuals,