A phylogenomics approach to resolving fungal evolution,
and phylogenetic method development
par Yu Liu
Département de Biochimie Faculté de Médecine
Thèse présentée à la Faculté des études supérieures en vue de l‟obtention du grade de Doctorat
en Bio-informatique
December, 2009
Faculté des études supérieures et postdoctorales
Cette thèse intitulée :
A phylogenomics approach to resolving fungal evolution,
and phylogenetic method development
Présentée par : Yu Liu
a été évaluée par un jury composé des personnes suivantes :
Nicolas Lartillot, président-rapporteur B Franz Lang, directeur de recherche Miklós Csűrös, membre du jury Christian Blouin, examinateur externe
Résumé
Bien que les champignons soient régulièrement utilisés comme modèle d'étude des systèmes eucaryotes, leurs relations phylogénétiques soulèvent encore des questions controversées. Parmi celles-ci, la classification des zygomycètes reste inconsistante. Ils sont potentiellement paraphylétiques, i.e. regroupent de lignées fongiques non directement affiliées. La position phylogénétique du genre Schizosaccharomyces est aussi controversée: appartient-il aux Taphrinomycotina (précédemment connus comme archiascomycetes) comme prédit par l'analyse de gènes nucléaires, ou est-il plutôt relié aux Saccharomycotina (levures bourgeonnantes) tel que le suggère la phylogénie mitochondriale? Une autre question concerne la position phylogénétique des nucléariides, un groupe d'eucaryotes amiboïdes que l'on suppose étroitement relié aux champignons. Des analyses multi-gènes réalisées antérieurement n'ont pu conclure, étant donné le choix d'un nombre réduit de taxons et l'utilisation de six gènes nucléaires seulement.
Nous avons abordé ces questions par le biais d'inférences phylogénétiques et tests statistiques appliqués à des assemblages de données phylogénomiques nucléaires et mitochondriales. D'après nos résultats, les zygomycètes sont paraphylétiques (Chapitre 2) bien que le signal phylogénétique issu du jeu de données mitochondriales disponibles est insuffisant pour résoudre l'ordre de cet embranchement avec une confiance statistique significative. Dans le Chapitre 3, nous montrons à l'aide d'un jeu de données nucléaires important (plus de cent protéines) et avec supports statistiques concluants, que le genre
l'attraction des longues branches (ALB), un artéfact menant au regroupement d'espèces dont le taux d'évolution rapide n'est pas représentatif de leur véritable position dans l'arbre phylogénétique. Dans le Chapitre 4, en utilisant encore un important jeu de données nucléaires, nous démontrons avec support statistique significatif que les nucleariides constituent le groupe lié de plus près aux champignons. Nous confirmons aussi la paraphylie des zygomycètes traditionnels tel que suggéré précédemment, avec support statistique significatif, bien que ne pouvant placer tous les membres du groupe avec confiance. Nos résultats remettent en cause des aspects d'une récente reclassification taxonomique des zygomycètes et de leurs voisins, les chytridiomycètes.
Contrer ou minimiser les artéfacts phylogénétiques telle l'attraction des longues branches (ALB) constitue une question récurrente majeure. Dans ce sens, nous avons développé une nouvelle méthode (Chapitre 5) qui identifie et élimine dans une séquence les sites présentant une grande variation du taux d'évolution (sites fortement hétérotaches - sites HH); ces sites sont connus comme contribuant significativement au phénomène d'ALB. Notre méthode est basée sur un test de rapport de vraisemblance (likelihood ratio test, LRT). Deux jeux de données publiés précédemment sont utilisés pour démontrer que le retrait graduel des sites HH chez les espèces à évolution accélérée (sensibles à l'ALB) augmente significativement le support pour la topologie « vraie » attendue, et ce, de façon plus efficace comparée à d'autres méthodes publiées de retrait de sites de séquences. Néanmoins, et de façon générale, la manipulation de données préalable à l'analyse est loin
d‟être idéale. Les développements futurs devront viser l'intégration de l'identification et la pondération des sites HH au processus d'inférence phylogénétique lui-même.
Mots-clés : phylogénomique, Taphrinomycotina, zygomycètes, attraction des longues branches, mitochondrial, nucleariides, hétérotache, likelihood ratio test.
Abstract
Despite the popularity of fungi as eukaryotic model systems, several questions on their phylogenetic relationships continue to be controversial. These include the classification of zygomycetes that are potentially paraphyletic, i.e. a combination of several not directly related fungal lineages. The phylogenetic position of Schizosaccharomyces species has also been controversial: do they belong to Taphrinomycotina (previously known as archiascomycetes) as predicted by analyses with nuclear genes, or are they instead related to Saccharomycotina (budding yeast) as in mitochondrial phylogenies? Another question concerns the precise phylogenetic position of nucleariids, a group of amoeboid eukaryotes that are believed to be close relatives of Fungi. Previously conducted multi-gene analyses have been inconclusive, because of limited taxon sampling and the use of only six nuclear genes.
We have addressed these issues by assembling phylogenomic nuclear and mitochondrial datasets for phylogenetic inference and statistical testing. According to our results zygomycetes appear to be paraphyletic (Chapter 2), but the phylogenetic signal in the available mitochondrial dataset is insufficient for resolving their branching order with statistical confidence. In Chapter 3 we show with a large nuclear dataset (more than 100 proteins) and conclusive supports that Schizosaccharomyces species are part of Taphrinomycotina. We further demonstrate that the conflicting grouping of
Schizosaccharomyces with budding yeasts, obtained with mitochondrial sequences, results
leads to the regrouping of species with high evolutionary rates irrespective of their true phylogenetic positions). In Chapter 4, using again a large nuclear dataset we demonstrate with significant statistical support that nucleariids are the closest known relatives of Fungi. We also confirm paraphyly of traditional zygomycetes as previously suggested, with significant support, but without placing all members of this group with confidence. Our results question aspects of a recent taxonomical reclassification of zygomycetes and their chytridiomycete neighbors (a group of zoospore-producing Fungi).
Overcoming or minimizing phylogenetic artifacts such as LBA has been among our most recurring questions. We have therefore developed a new method (Chapter 5) that identifies and eliminates sequence sites with highly uneven evolutionary rates (highly heterotachous sites, or HH sites) that are known to contribute significantly to LBA. Our method is based on a likelihood ratio test (LRT). Two previously published datasets are used to demonstrate that gradual removal of HH sites in fast-evolving species (suspected for LBA) significantly increases the support for the expected „true‟ topology, in a more effective way than comparable, published methods of sequence site removal. Yet in general, data manipulation prior to analysis is far from ideal. Future development should aim at integration of HH site identification and weighting into the phylogenetic inference process itself.
Table of contents
Resume --- i
Abstract --- iv
List of tables --- xi
List of figures --- xii
Acknowledgements --- xv
Chapter 1 Introduction --- 1 1 Fungal classification
1.1 Relationship of Fungi with other eukaryotic groups. 1.2 Fungal subgroups.
2 Unresolved issues in fungal phylogeny
2.1 Monophyly of Taphrinomycotina and relationships among major fungal lineages
2.2 Unresolved phylogenetic relationship between protists and Fungi 3 Evolutionary models for amino acid sequence change
3.1 Markov process models
3.2 Instantaneous rate and probability matrices 3.3 Rate heterogeneity among sites
3.4 CAT model
4 Likelihood-based methods for phylogenetic inference 4.1 Likelihood function.
4.2 Maximum likelihood (ML) method. 4.3 Bayesian inference (BI) method. 5 Challenges in phylogenetic analysis.
5.1 The LBA artifact and methods to detect and avoid it 5.1.1 LBA is widespread.
5.1.3 LBA caused by compositional heterogeneity. 5.2 Rapid radiation and incomplete lineage sorting. 6 Objectives of this study.
7 References
Chapter 2 Comparative mitochondrial genomics in zygomycetes --- 41 1 Abstract
2 Introduction
3 Materials and methods
3.1 Strains and culture conditions
3.2 Cloning and sequencing of complete mtDNAs 3.3 PCR amplification of rnpB genes
3.4 RNA circularization by ligation and RT–PCR 3.5 RT–PCR of mtP-RNA from R.oryzae
3.6 S1 mapping
3.7 Phylogenetic inference 4 Result and discussion
4.1 Genes in addition to the standard fungal set, rnpB and rps3 4.2 First steps toward a derived genetic code in zygomycetes 4.3 Eubacteria-like mtP-RNAs in zygomycete mitochondria 4.4 Conserved C-rich motifs in mRNAs and SSU-rRNA 4.5 More instances of mobile endonuclease elements?
4.6 Lateral transfer of a group I intron from zygomycete to angiosperm mitochondria
4.7 Phylogenetic analysis with standard mitochondrial proteins: are zygomycetes paraphyletic?
7 Supplemental material
Chapter 3 Monophyly of Taphrinomycotina --- 81 1 Introduction
2 Material and Methods
2.1 Construction of cDNA libraries and EST sequencing 2.2 Mitochondrial sequencing
2.3 Dataset construction
2.4 Phylogenetic analysis of the nuclear dataset
2.5 Phylogenetic analysis of the mitochondrial dataset with the SF method 3 Results
3.1 Phylogenetic analysis of the nuclear dataset 3.2 Likelihood test of competing topologies 3.3 Phylogenetic analysis of mitochondrial datasets 4 Discussion
4.1The nuclear dataset significantly supports the monophyly of Taphrinomycotina
4.2 The mitochondrial tree topology is sensitive to phylogenetic artifacts 4.3 Limitations of mitochondrial sequence data in phylogenetic analysis 5 Conclusion
6 References 7 Tables and figures 8 Supplemental material
Chapter 4 Relationship of nucleariids and Fungi --- 117 1 Background
2 Result and discussion
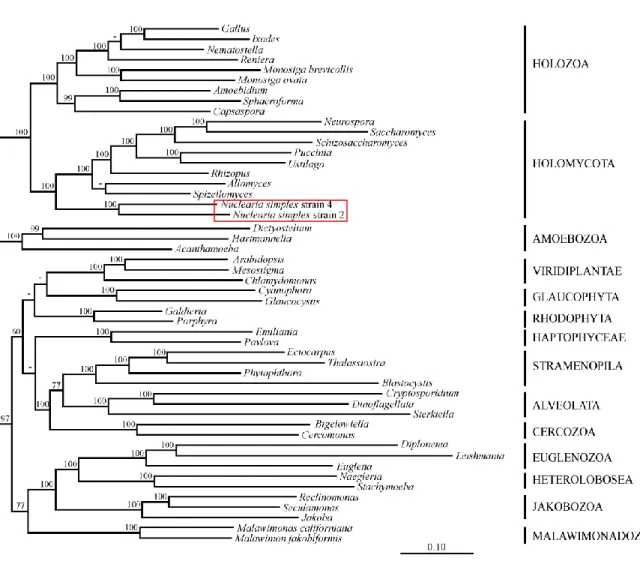
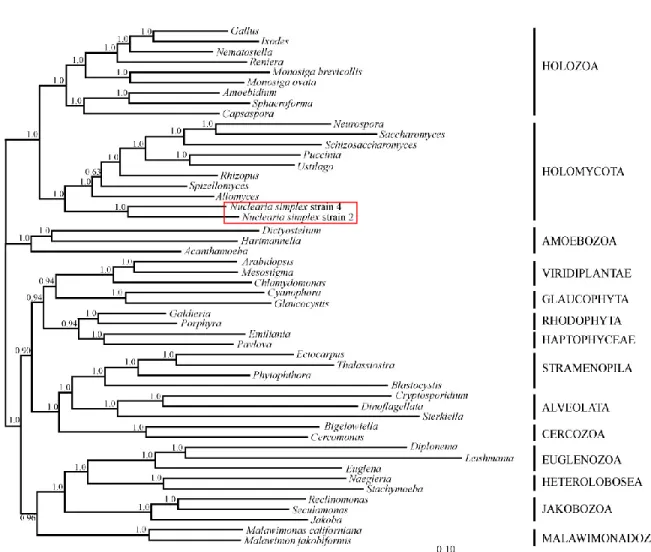
2.1 Phylogenomic analysis with the Eukaryotic Dataset supports Nucleariida as sister to Fungi.
Holomycota.
2.3 Fungal phylogeny with Nucleariida as outgroup. 3 Conclusions
4 Materials and Methods
4.1 Construction of cDNA libraries and EST sequencing 4.2 Mitochondrial sequencing and genome annotation 4.3 Dataset construction
4.4 Phylogenetic analysis
4.5 Variable Length Bootstrap analysis 5 Tables and Figures
6 Reference
7 Supplemental material
Chapter 5 Likelihood ratio test to identify heterotachous sites --- 161 1 Introduction
2 Materials and Methods 2.1 Datasets
2.2 Phylogenetic analysis of Animal Dataset 2.3 Phylogenetic analysis of Eukaryotic Dataset 2.4 Procedure for HH site filtering
2.5 Likelihood ratio test 2.6 Removal of HH sites
2.7 Effect of the guide tree on the identifying HH sites 3 Results and Discussion
3.1 Animal phylogeny and LBA
3.2 Heterotachous sites in nematodes and platyhelminths 3.3 HH site removal effectively overcomes LBA artifacts 3.4 Position of Microsporidia in the eukaryotic tree
4 Tables and Figures 5 Reference
Chapter 6 Discussion --- 186 6.1 Are Zygomycota and Chytridiomycota monophyletic?
6.2 Taphrinomycotina are monophyletic
6.3 Phylogenetic position of protists related to Fungi
6.4 Advantages and limitations of mitochondrial phylogeny
6.5 Removing HH sites improves the accuracy of phylogenetic inference 6.6 Reference
Chapter 7 Conclusions and future directions --- 200 Reference
List of tables
Chapter 1
Table 1 Fungal Systematics.
Table 2 Unicellular protists that are believed to diverge close to Fungi/Metazoa. Chapter 2
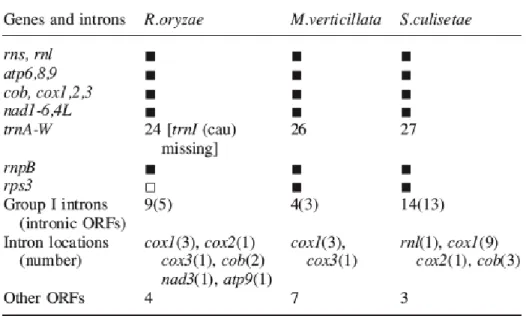
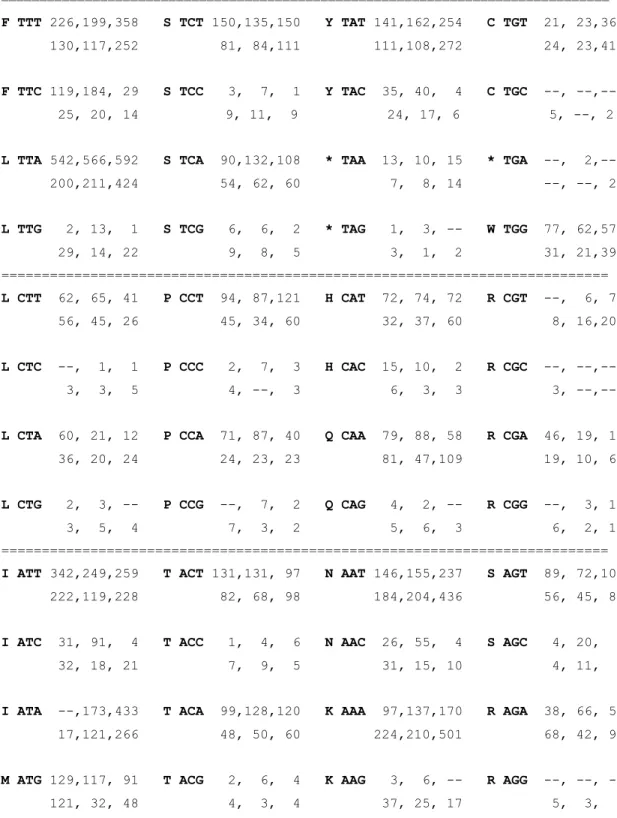
Table 1 Overview of gene, ORF and intron content in zygomycete mtDNAs. Table 1S Codon usage in the mtDNAs of R. oryzae, M. verticillata, S. culisetae. Chapter 3
Table 1 Likelihood tests of alternative tree topologies. Table S1 Proportion of missing positions in nuclear data set. Chapter 4
Table 1 Comparison of alternative tree topologies with AU and wSH tests. Table S1 Proteins in the Eukaryotic Dataset.
Table S2 Proteins in the Fungal Dataset. Chapter 5
Table 1 Correlation of tree topology and the degree of HH site removal in nematoda and/or platyhelminths (Animal Dataset).
Table 2 Variation of bootstrap support for Nematoda + Arthropoda with HH site removal in Nematoda and/or Platyhelminths.
List of Figures
Chapter 2
Figure 1 Genomic maps of the mtDNAs of R.oryzae, M.verticillata and S.culisetae.
Figure 2 Secondary structure models for mtP-RNAs from R.oryzae, R.stolonifer 194667,
R.oligosporus, R.spectabilis, M.mucedo, S.culisetae and M.verticillata.
Figure 3 3' RNA processing motifs in zygomycetes, basidiomycetes and fission yeasts. Figure 4 Schematic view of atp6 regions of A.macrogynus and A.arbusculus, atp9 of
R.oryzae and cox2 of M.verticillata.
Figure 5 (A) Fungal phylogeny based on multiple proteins; (B) Phylogeny of intronic ORFs.
Figure 1S Strict consensus of tree topologies examined under separate analysis and likelihood ratio tests.
Chapter 3
Figure 1 Phylogeny based on nucleus-encoded protein sequences.
Figure 2 Phylogeny based on concatenated proteins encoded by mtDNA.
Figure 3 Phylogenetic analysis of mitochondrial dataset after removing Saccharomycotina. Figure 4 Impact of fast-evolving positions on the inferred phylogeny from proteins encoded by mtDNA.
Figure S1 Phylogeny based on nucleus-encoded proteins with less missing data.
Figure S2 Phylogenetic analysis of mitochondrial dataset containing only Ascomycota and four fast-evolving Chytridiomycota.
Figure S3 Bootstrap supports for two alternative positions of Schizosaccharomyces (one is grouping with other Taphrinomycotina, the other grouping with Saccharomy-cotina) using SF method.
Figure 1 Tree of eukaryotes based on Eukaryotic Dataset. Figure 2 Phylogeny inferred from the mitochondrial dataset. Figure 3 VLB analysis.
Figure 4 Fungal phylogeny with nuclear data, using Nucleariida as the outgroup. Figure S1 Tree of eukaryotes with the Eukaryotic Dataset and ML inference. Figure S2 Phylogeny with Eukaryotic Dataset after removing fast-evolving species. Figure S3 Phylogeny with Eukaryotic Dataset after recoding amino acids into six groups. Figure S4 Complete mitochondrial DNA (mtDNA) of Nuclearia simplex strain 1552/2. Figure S5 Phylogenetic relationship of the 29 species used for VLB analyses.
Chapter 5
Figure 1 Illustration of LRT to identify heterotachous sites.
Figure 2 Procedure to identify heterotachous sites of a target group, and to rank them by LRT.
Figure 3 Trees of Animal Dataset.
Acknowledgements
My first thank you goes to my supervisor Dr B. Franz Lang. First, I would like to thank him for giving me the opportunity to work with him. His approach to supervision has forced me to be independent and to work my way through problems, and for that I am especially grateful. I also appreciate his patience and teaching, like sitting through all the painful practice talks and improving my writing skills.
A huge thank you goes further to Dr Herve Philippe for his most useful programs, papers, datasets and critical comments to my work. Basically, I learned phylogenetics from his papers and talks. I also thank Dr Gertraud Burger for her help in many aspects; her comments and suggestions during group meetings are greatly appreciated. I also want to thank Dr Nicolas Lartillot for the development of PhyloBayes that implements the CAT model, and for his help to use it.
I would also like to thank all the past and current members of our group and the Robert Cedergren Centre, including Jessica Leigh, Nicolas Rodrigue, and Rachel Bevan for their help in writing papers; Henner Brinkmann for his help in phylenetics analysis; Amy Hauth, Lise Forget, Veronique Marie, David To, Allan Sun, Eric Wang for advice and suggestions in programming; Yan Zhou and Yaoqing Shen for the wonderful discussions about phylogeny inference and molecular biology.
I thank my thesis committee members, Dr Nicolas Lartillot, Dr Miklós Csűrös, and Dr Christian Blouin, for their insightful comments to improve this thesis. Elaine Meunier deserves my special thanks. Her kind help makes things much easier for a student who cannot speak French in a francophone university.
Last but not least, I would like to thank my parents and family for supporting me spiritually throughout my life.
Chapter 1 Introduction
Fungi are widely used as model systems in molecular and cellular biology. In this context, it is crucial to understand and evaluate their respective evolutionary relationships and how their genes and genomes change over time. Yet, after decades of research, numerous questions related to fungal evolution remain unresolved. In this thesis, we will focus on three topics of general interest:
are the Taphrinomycotina (including Schizosaccharomyces species) monophyletic or paraphyletic (for a current view of fungal taxonomy see Table 1)?
what are the relationship among the major fungal groups, especially the less well known zygomycetes and chytrids?
what are the exact phylogenetic positions of protists that are believed to diverge close to the metazoan-fungal boundary, such as Nucleariida, Capsaspora,
Amoebidium and Sphaeroforma (for taxonomic details see Table 2)?
To do so, we analyzed nuclear and mitochondrial genomic datasets with various phylogenetic methods. We also developed a new method to improve the accuracy of phylogenetic inference.
In the first chapter of this dissertation we will present an overview of current fungal taxonomy and the status of molecular phylogenetic inference. The models and methods used in phylogenetic analyses are also described in this chapter, along with a discussion of analytical challenges that are related to common phylogenetic artifacts. Chapters two to
The first publication (Chapter 2) presents comparative mitochondrial genomic analyses of zygomycetes and tests the monophyly of zygomycetes. We find that the mitochondrial dataset alone is insufficient to resolve with confidence whether Zygomycota is a monophyletic or paraphyletic group, and members of this group as well as Fungi in general evolve at a wide range of evolutionary rates. These rate differences may cause Long-Branch Attraction artifact (LBA, causing grouping of fast-evolving lineages irrespective of their true evolutionary relationships, sometimes even with strong statistical support), a theme that is addressed in detail in the following publications. The second publication (Chapter 3) presents phylogenomic analyses that aim to the issue of Taphrinomycotina. Our results suggest that Taphrinomycotina is a monophyletic group, a sister group of Saccharomycotina plus Pezizomycotina, and that a LBA artifact plagues the analyses of mitochondrial data and leads to a paraphyletic Taphrinomycotina. In the third publication (Chapter 4), our analyses with both nuclear and mitochondrial genes confirm that nucleariids are the closest unicellular relatives of Fungi; that Capsaspora, Amoebidium plus
Sphaeroforma form a monophyletic sister group of Metazoa plus Choanoflagellata; and
that Zygomycota and Chytridiomycota as defined in traditional taxonomy are most likely paraphyletic.
Table 1: Fungal Systematics (according to Hibbett et al. 2007)
Taxon Examples of member species
Phylum Ascomycota
Subphylum Taphrinomycotina Schizosaccharomyces pombe
Subphylum Saccharomycotina Saccharomyces cerevisiae
Subphylum Pezizomycotina Neurospora crassa
Phylum Basidiomycota
Subphylum Urediniomycotina Puccinia graminis
Subphylum Ustilaginomycotina Ustilago maydis
Subphylum Hymenomycotina Cryptococcus neoformans
Phylum Chytridiomycota1 Spizellomyces punctatus
Phylum Neocallimastigomycota1 Neocallimastix frontalis
Phylum Blastocladiomycota1 Allomyces macrogynus
Phylum Glomeromycota2 Glomus intraradices
Subphylum* Mucoromycotina2 Rhizopus oryzae
Subphylum* Kickxellomycotina2 Smittium culisetae
Subphylum* Zoopagomycotina2 Zoophagus insidians
Subphylum* Entomophthoromycotina2 Conidiobolus coronatus
* currently not assigned to a phylum
1 Chytridiomycota in traditional taxonomy 2 Zygomycota in traditional taxonomy
Table 2: Unicellular protists that are believed to diverge close to Fungi/Metazoa
Taxon Examples of member species Reference
Choanoflagellida Monosiga brevicollis (King et al. 2008) Corallochytrium Corallochytrium limacisporum (Sumathi et al. 2006) Eccrinales Alacrinella limnoriae (Cafaro 2005) Ichthyosporea
Capsaspora Capsaspora owczarzaki (Ruiz-Trillo et al. 2008) Dermocystida Dermocystidium salmonis (Marshall et al. 2008) Ichthyophonida
Amoebidiaceae Amoebidium parasiticum (Ruiz-Trillo et al. 2008) Sphaeroforma Sphaeroforma arctica (Ruiz-Trillo et al. 2006) Microsporida Encephalitozoon cuniculi (Keeling 2009)
Ministeria Ministeria vibrans (Shalchian-Tabrizi et al. 2008) Nucleariidae Nuclearia simplex (Steenkamp et al. 2006) Rozellida Rozella allomycis (Lara et al. 2009)
The fifth chapter deals with method development, addressing limitations of current approaches in phylogenetic analysis due to model violations. Here we describe a new method that improves the information/background noise ratio in datasets by progressive elimination of positions that likely contribute to LBA. The method is based on a Likelihood Ratio Test (LRT; a comparison of likelihood values under two models), which is used to identify and eliminate sequence positions that contain little if any phylogenetic signal. Sequence elimination occurs specifically in fast evolving species (or groups) as they are most affected by LBA. Two previously published datasets are used to demonstrate the
potential of this method. The result shows that it can effectively overcome LBA. Finally, in the sixth chapter we summarize the most important findings of this dissertation, compare them with previous work, and comment on future orientations of our research.
1. Fungal classification
Based on morphology, ultra-structural characteristics, and lifestyle, Fungi include more than one million extremely diverse species, a major challenge for morphology-based fungal taxonomy (Hawksworth 2001). Today, sequence-based, molecular taxonomy clearly defines Fungi as a monophyletic group, further revealing their close relationship to animals (Metazoa) rather than to plants as previously believed. The following section will provide an overview of the current molecular taxonomy of Fungi.
1.1 Relationship of Fungi with other eukaryotic groups.
Eukaryotes include organisms with an almost inconceivable morphological diversity. Not surprisingly, their classification has changed dramatically over the decades, from four major groups or kingdoms (plants, animals, fungi, and protists) to the current system of six “super-groups”: Amoebozoa, Chromalveolata, Excavata, Opisthokonta, Plantae, Rhizaria (Parfrey et al. 2006; Rodriguez-Ezpeleta et al. 2007a; Baldauf 2008; Yoon et al. 2008). The supergroup “Plantae” contains three lineages with primary plastids: green algae (including land plants), rhodophytes, and glaucophytes (the term primary plastids refers to the original
more details see (Rodriguez-Ezpeleta et al. 2005; Kim and Graham 2008)). Fungi have traditionally been considered a subgroup of plants, but phylogenetic analyses of both nuclear small subunit rRNA (SSU-rRNA) and protein-coding genes clearly reject this association. These analyses provide instead significant support for a sister group relationship of Fungi with Metazoa (Opistokonta), now also including a number protists (Baldauf et al. 2000; Moreira, Le Guyader, and Philippe 2000; Lang et al. 2002b; Cavalier-Smith 2004; Parfrey et al. 2006; Yoon et al. 2008). In addition, some groups previously classified as Fungi (such as Myxomycota, Dictyosteliomycota, and Oomycota) are now excluded from the kingdom (Gunderson et al. 1987; Paquin et al. 1997).
Protists are a taxonomically inconsistent group uniting diverse eukaryotic organisms that have not been associated with animals, fungi or plants. Based on morphologic markers, protists were traditionally subdivided into animal-like, plant-like, and fungus-like groups, a classification that does not reflect the protists‟ true evolutionary relationships (Cavalier-Smith and Chao 2003b; Adl et al. 2005). Molecular phylogenetic analyses have revealed that some protists are indeed Fungi (e.g., Pneumocystis carinii (Edman et al. 1988a)), and that others such as Microsporidia (Keeling 2003) and Nucleariida (Steenkamp, Wright, and Baldauf 2006) are related to them. Yet, the exact phylogenetic position of Microsporidia is uncertain due to their extremely fast evolutionary rate, (Hibbett et al. 2007) and that Nucleariida are likely a sister group of Fungi - awaiting confirmation by additional, statistically more compelling analyses (Steenkamp, Wright, and Baldauf 2006). The phylogenetic positions of other potential opisthokont relatives (e.g.,
Apusozoa and potentially Malawimonadozoa) remains currently uncertain, even with phylogenomic datasets (Philippe 2000; Parfrey et al. 2006) (Lang and Philippe, unpublished results).
1.2 Fungal subgroups.
Based on their sexual reproductive structures, Fungi have been traditionally divided into Ascomycota, Basidiomycota, Zygomycota, and Chytridiomycota (Taylor et al. 2004; McLaughlin et al. 2009). However, the classification has changed dramatically in recent years (Seif et al. 2005; James et al. 2006a; Liu, Hodson, and Hall 2006; Spatafora et al. 2006; Hibbett 2007), especially for the Zygomycota and Chytridiomycota. In the most recent classification, Chytridiomycota remains a phylum but in a restricted sense, now only including Chytridiomycetes and Monoblepharidomycetes. Other traditional members such as Blastocladiomycota and Neocallimastigales are elevated to separate phyla, and the phylum Zygomycota is completely abandoned. Its member are divided into the phylum Glomeromycota plus four subphyla incertae sedis (not assigned to any phylum): Mucoromycotina, Kickxellomycotina, Zoopagomycotina and Entomophthoromycotina. To some extent, this classification is consistent with phylogenetic analyses based on single rRNA and protein-coding genes, on combinations of few genes, and most reliably, on nuclear and mitochondrial multi-gene datasets (e.g., (Edman et al. 1988a; Lang et al. 2002a; Bullerwell, Forget, and Lang 2003b; Leigh et al. 2003; Thomarat, Vivares, and Gouy 2004; Fitzpatrick et al. 2006; James et al. 2006a; Liu, Hodson, and Hall 2006;
Hibbett et al. 2007)). Yet, only Ascomycota and Basidiomycota are clearly monophyletic sister clades, and several higher-order relationships among other fungal lineages remain uncertain. The lack of phylogenetic comprehension renders naming of new and abandoning of previously established taxonomic groups challenging, if not controversial (e.g., Blastocladiomycota and Glomeromycota; Zygomycota; Hibbett et al. 2007).
2. Unresolved issues in fungal phylogeny
2.1 Monophyly of Taphrinomycotina and relationships among major fungal lineages Molecular taxonomies based on SSU-rRNA sequences divide Ascomycota into three major lineages: Saccharomycotina, Pezizomycotina and Taphrinomycotina (Archiascomycota) (Nishida and Sugiyama 1993). In this analysis, Taphrinomycotina is the sister group of Saccharomycotina plus Pezizomycotina. However, significant support for this topology is lacking, and results from several multi-protein phylogenies using mitochondrial and nuclear protein sequences are incongruent (e.g., (Bullerwell et al. 2003; Taylor et al. 2004)). The reason for this incongruence appears to be a LBA attraction artifact. It is observed both, with certain nuclear (Baldauf et al. 2000) and mitochondrial datasets (Leigh et al. 2004). In both cited cases, LBA leads to an incorrect, yet statistically well-supported grouping of Saccharomycotina plus Schizosaccharomyces (a key member of Taphrinomycotina and widely used model system). Adding more Taphrinomycotina (Taphrina, Saitoella, Pneumocystis and Neolecta) and more sequences from this species has potential to overcome this phylogenetic artifact.
Besides unresolved issues within Ascomycota, other higher-order relationships among other fungal lineages also remain uncertain, such as zygomycetes (Keeling, Luker, and Palmer 2000; Schwarzott, Walker, and Schussler 2001; Forget et al. 2002; Tehler, Little, and Farris 2003; Leigh et al. 2004; Seif et al. 2005; Tanabe, Watanabe, and Sugiyama 2005b; James et al. 2006a; Liu, Hodson, and Hall 2006; Hibbett 2007). One reason for this uncertainty is missing sequence, in particular in the large phylogenomic datasets: complete genome sequences are available from only few lineages in zygomycetes and chytridiomycetes. Another reason is the presence of short internal branches that separate them and their sub-groups. More (and more complete) genomic data, and the development of increasingly sophisticated evolutionary models and phylogenetic algorithms that are better in extracting „phylogenetic signal‟ are hoped to resolve these issues.
2.2 Unresolved phylogenetic relationship between protists and Fungi
Some protists such as the choanoflagellates (Choanoflagellata), the ichthyosporeans (Ichthyosporea), the nucleariids (Nucleariidae) and the genera Capsaspora and Ministeria are believed to branch close to the fungal-animal divergence. In some instances, their exact phylogenetic positions are still debated (Cavalier-Smith and Chao 2003b; Adl et al. 2005; Steenkamp, Wright, and Baldauf 2006; Carr et al. 2008; King et al. 2008; Ruiz-Trillo et al. 2008). Among them, nucleariids is of particular interest, the only group that appears to be closely related to Fungi. The few molecular phylogenies including nucleariids are based on
single gene sequences (except (Steenkamp, Wright, and Baldauf 2006), see below), and come with contradicting results and unconvincing statistical support. For instance, nucleariids are the sister of Fungi in an analysis of SSU plus LSU data, yet with limited species sampling (Medina et al. 2003). In contrast, in analyses with SSU data and rich taxa sampling, nucleariids are the sister of Metazoa/Choanoflagellata/Mesomycetozoa (Zettler et al. 2001). In a more recent multi-gene analysis (including EF-1α, actin, HSP70 and α- and β-tubulin) they are the sister group of Fungi, yet despite the use of multiple gene sequences, competing tree topologies cannot be rejected with confidence (Steenkamp, Wright, and Baldauf 2006). Evidently, much larger datasets are required to resolve this question.
3. Evolutionary models for amino acid sequence change
Nucleotide and amino acid sequences are two of the principle types of molecular data used in phylogenetic analyses. The third codon positions of nucleotide sequences of protein-coding genes have higher evolutionary rates and a more pronounced compositional sequence bias (Li 1997), which may lead to incorrect phylogenetic inferences as described in the next sections. Thus, our phylogenomic datasets contain exclusively derived protein-coding sequences. Models that describe evolutionary amino acids change are an essential component of phylogenetic inference. This section summarizes the statistical basis and properties of the evolutionary models for amino acid sequences.
The aim of this section is to introduce the common assumptions made to model the process of molecular evolution.
One of the primary assumptions is that future evolution (at time T = t+1) is only dependent on its current state (at time T = t) and not on previous states (T < t). The processes with this property are called Markov processes in statistics. This assumption is reasonable, as mutation and substitution can only act upon the present molecules in an organism.
To reduce the complexity of evolutionary models and the computational burden, another common assumption is that sequence sites of molecules evolve independently, although this does not always hold in real sequence. Yet, studies show that models with this assumption perform reasonably well. Recently, models that relax this assumption have been developed (Galtier 2001; Penny et al. 2001), but due to their heavy computational cost they are not widely used and tested for performance.
Based on these assumptions, various global amino acid substitutions models have been developed during the last four decades (Dayhoff 1978; Gonnet, Cohen, and Benner 1992; Jones, Taylor, and Thornton 1992; Whelan and Goldman 2001; Le and Gascuel 2008). In the following section, we will describe their common principles and also explain a more recently developed model that describes site-specific change: CAT.
3.2 Instantaneous rate and probability matrices
ancestor by a series of independent substitutions. For protein sequences, the continuous-time Markov process is defined by its instantaneous 20×20 rate matrix:
Q = (qij), i,j=1,..20
The matrix entry qij, j ≠ i, represents the instantaneous rate of change from amino acid i to
amino acid j, independently at each site. The qii entry of the matrix is set to be the minus of
the sum of all other entries in that row, representing the rate at which changes leave amino acid i and making the row sums being zero:
However, protein sequence data consist of actual amino acid characters at a given time, not the rate at which they are evolving. The quantity needed for calculations is the probability of observing a given character after time t has elapsed. Let Pij(t) be the
probability of a site in state j after time t, given that the process started in state i at that site at time 0. Since there are 20 amino acid states, the probability Pij(t) can be written as a
20×20 matrix, which denoted as P(t). It is necessary to compute the probability matrix P(t) for any real evolutionary time t ≥ 0. This is achieved using the instantaneous rate matrix Q, which is related to P(t) via P(t) = etQ. The exponential of a matrix is defined by the following power series, with I being the identity matrix:
In practice, this power series can be calculated numerically using eigendecomposition and other methods.
A Markov process model has three important properties: homogeneity, stationarity, and reversibility. Homogeneity means that the rate matrix Q is independent on time T, which means that the patterns of amino acid substitution remain the same during evolutionary history. A homogeneous process has an equilibrium distribution that is the distribution when time approaches infinity. Stationarity means that the process is at that equilibrium, which implies amino acids frequencies have remained the same during the course of evolution. Reversibility means that πiPij(T) = πjPji(T) for all i, j, and T, where πi
are the frequencies of occurrence for each amino acid.
3.3 Rate heterogeneity among sites
Due to the various functional constraints on sites, evolutionary rates vary at different sites along the sequence. In other words, it is less likely that substitutions occur at positions with strong functional constraints, and amino acids at positions with few constraints are more easily substituted. A common way of modeling evolutionary rates along a sequence is by applying a Gamma distribution (a density function),
where is the Gamma function, parameter a the shape parameter, and b the inverse scale parameter. The mean of a Gamma-distributed variable is a/b; the variance is a/b2. The Gamma distribution is sufficiently general to accommodate different levels of rate
determines the extent of rate heterogeneity among sites, with a small a representing extreme rate variation (Yang 1996). However, as pointed out correctly, “there is nothing about the Gamma distribution that makes it biologically more realistic than any other distribution … It is used because of its mathematical tractability” (Felsenstein 2004).
In practice, most applications provide a discrete Gamma distribution (Yang 1996), because a continuous likelihood calculation is computationally too demanding. Studies have shown that a discrete gamma distribution with four to eight categories provides both a good approximation and reasonable computational efficiency (Yang 1996).
3.4 CAT model
Most of models assume that sites along a sequence are independent and identically distributed (i.i.d.). While this assumption is far from reality, it greatly simplifies calculations. This assumption is partially relaxed with the Gamma distribution that models the evolutionary rate heterogeneity among sites. However, other parameters, such as the transition probability matrix, are still assumed to be i.i.d. along a sequence. More recently, the CAT model was proposed in which sites along a sequence are divided into K distinct classes, whose evolutionary process is characterized by its own rate matrix (Lartillot and Philippe 2004; Lartillot, Brinkmann, and Philippe 2007; Lartillot and Philippe 2008). CAT is applied in a program called PhyloBayes and has shown its superior resolving power in recent phylogenetic studies (Lartillot and Philippe 2004; Lartillot, Brinkmann, and Philippe 2007; Lartillot and Philippe 2008).
Based on the property of a reversible Markov process, the rate matrix (R) derived from the transition probability matrix (P) can be expressed as the product of two components: the rate parameters Q (also called the exchangeability parameters) and the equilibrium frequencies π (or stationary probabilities). The CAT model assumes that all classes share the same rate parameters Q, but that they have a different set of equilibrium frequencies π for each class. The rate parameters Q can be fixed to the traditional empirical Dayhoff, JTT or WAG matrices to keep computation tractable. The equilibrium frequencies π for each class are estimated from the dataset.
Case studies have shown that the CAT model provides a significantly better fit with data, and that it is more robust against phylogenetic artifacts such as long branch attraction than other models (Lartillot, Brinkmann, and Philippe 2007; Lartillot and Philippe 2008). However, due to its complexity, it needs substantial sequence data to estimate its parameters, and is therefore best suited for use with large (phylogenomic) datasets. Its current implementation uses a Bayesian approach and employs a Markov Chain Monte Carlo (MCMC) technology. The high clade-supporting posterior probabilities provided by MCMC are somehow worrisome because they appear to overestimate the probability that the reconstructed topology represents true evolutionary relationships (Suzuki, Glazko, and Nei 2002; Douady et al. 2003). However, a combination of the Bayesian approach with bootstrapping or jackknifing provides a robust solution, although it is computational expensive - especially for large datasets.
Because phylogenetic inference can be treated as a statistical inference, standard statistical frameworks like least square and likelihood methods can be directly applied. Likelihood methods are most efficient in extracting information compared to least square and others, and the likelihood estimates have a variety of good properties. For example, the estimates convert to the correct value of the parameter (consistency), and have the smallest variance around the true parameter value (efficiency) if the dataset is large enough. Thus, in this study, we focus on likelihood methods for phylogenetic inference. In this section, likelihood function and likelihood-based method for phylogenetic inference are introduced.
4.1 Likelihood function.
The likelihood function (L = Prob(D|M), where D is the data, M is the model) plays a central role in all applications of likelihood-based methods. After an evolutionary model (the tree topology is considered as a parameter of the model) is selected, the likelihood function is used to calculate the probability of a given set of data D for a given tree T (the likelihood value for tree T): L = Prob(D|T, θ), where θ is a vector of parameters for a specified model. Two assumptions are central to computing likelihood values (recent developments have relaxed these assumptions, e.g., (Felsenstein and Churchill 1996)): 1): Evolution at different sites (on the given tree) is independent; 2): Evolution in different lineages is independent. These assumptions significantly simplify the calculation, e.g., based on the first assumption, the likelihood values for a dataset are the product of the Li
for each sites. Felsenstein developed a practical method for their calculation (Felsenstein 1981).
4.2. Maximum likelihood (ML) method.
The maximum likelihood method aims at identifying the tree with the highest likelihood value. It was first introduced for phylogeny reconstruction by Edwards and Cavalli-Sforza (Edwards and Cavalli-Sforza, 1964) and further developed by Felsenstein (Felsenstein 1981). We can evaluate the likelihood of any given tree T for any given parameter θ; yet the difficulty consists in maximizing the likelihood over all T and all θ. Due to the rapid increase of the number of possible trees with the number of taxa, exhaustive tree search is virtually impossible for real-world datasets. Therefore, a number of heuristic algorithms have been developed, like those implemented in Tree-PUZZLE (Schmidt et al. 2002), PhyML (Guindon and Gascuel 2003b), Treefinder (Jobb, von Haeseler, and Strimmer 2004), RAxML (Stamatakis 2006), etc.
4.3 Bayesian inference (BI) method.
The principle of the BI method is Bayes‟s theorem:
where P(T|D) is the posterior probability of a tree T given data D, P(T) is prior probability of the tree T, the P(D|T) is the likelihood of D given T, the denominator P(D) is the sum of
them so that they add up to 1. The objective of the BI method is to find the tree with a maximum posterior probability that is chosen as the best estimate (Ronquist and Huelsenbeck 2003). However, the denominator (P(D)) in the expression of posterior probability is difficult to compute, as it involves summing over all possible trees. The recent developed Markov chain Monte Carlo (MCMC) methods (Larget and Simon, 1999; Li, Doss and Pearl, 2000) allow to bypass the calculation of P(D) by sampling from the posterior distribution directly.
MCMC is a popular method used for evaluating integrals and solving optimization problems, especially when numerical or other methods cannot be easily applied, such as high dimensional problems. The most common form of MCMC is the Metropolis-Hasting algorithm (Metropolis et al , 1953; Hastings, 1970) (the Gibbs algorithm is a special case of the Metropolis-Hasting, (Geman and Geman, 1984)). The idea is to create a proposal distribution q on the parameter space. Instead of using q to generate a sequence of points sampled from parameter space, q is used to generate a candidate for the next sampled point that will be either accepted or rejected with some probability. If the candidate is rejected, the current point is sampled again. The random acceptance of proposals effectively changes the transition probabilities. Eventually, an appropriate choice of acceptance probabilities will result in a Markov transition matrix q‟, whose stationary distribution is proportional to the target distribution.
In phylogenetics analyses, MCMC produces a posterior distribution of topologies, and methods are needed to summarize this distribution. Two popular approaches are the
maximum posterior probability topology (Rannala and Yang, 1996), and the majority-rule consensus topology (Huelsenbeck et al, 2002). The maximum posterior probability topology is the one with the highest marginal posterior probability. In practice, there might be a large number of different trees in the sampled posterior. The majority-rule consensus topology is the topology with splits that have a marginal posterior probability greater than 0.5.
The BI method shares many fundamental components with ML, like the evolutionary model and the likelihood function. An advantage of the BI method is its capability to handle evolutionary model with high dimensional parameters (like the CAT model) using MCMC method, while ML often fails to do so (Huelsenbeck et al. 2001).
5. Challenges in phylogenetic analysis.
Comparative genomics reveals an enormous heterogeneity among sequences from different species, e.g., different substitution rates, sequence composition and gene content (Lang, Gary and Burger 1999; Burger, Gary and Lang, 2003; Dujon et al, 2004; Xie et al, 2005). This kind of heterogeneity will almost certainly lead to systematic error in phylogenetic analysis; at its extreme, the consequence may be inaccurate (sometimes significantly supported) tree topologies. For instance, in his seminal paper (Felsenstein, 1978), Felsenstein illustrates that when evolutionary rate variation across unrelated lineages is high, they may be incorrectly grouped together in phylogenetic analysis using parsimony
affects available inference methods without exception, although at varying degrees. With likelihood-based methods, systematic error, like LBA is often due to model violation, because of the model‟s unrealistic features (Sullivan and Swofford 2001). In this thesis, LBA is used as a general term to describe systematic error derived from model violations.
Rapid radiation within a short time span represents another challenge (Whitefield and Kjer, 2008). Through incomplete lineage sorting, polymorphisms in an ancestral population can persist through species divergences, resulting in misleading similarities of DNA sequences that do not necessarily reflect population relationships (Pollard et al, 2006). The consequence is the discordance between gene and species trees, and a phylogeny with short unsupported internal branches (Degnan and Rosenberg, 2009). These issues have come into focus because of the growing capacity to generate data sets containing large number of genes for phylogenetic analyses (Delsuc, Brinkmann, and Philippe, 2005).
The following section will describe methods to detect and avoid LBA artifact and rapid radiation.
5.1 The LBA artifact and methods to detect and avoid it 5.1.1 LBA is widespread.
LBA is widespread in phylogenetic inference, at any level of taxonomy. A few examples taken from recent reviews (Philippe 2000; Bergsten 2005) are: the tree of life and the kingdom relationships of Eukaryotes; the class and phylum level of metazoans and plants;
the ordinal level of mammals and birds; and the genus and family level of fish and insects. LBA is also suggested for different data types (DNA, RNA, and amino acid sequences) and data sources alike, including nuclear, mitochondrial and chloroplast datasets.
LBA was first theoretically demonstrated using a four-taxon dataset with the parsimony method. High frequency of parallel change in different species can cause sequence positions to arrive at the same state, undistinguishable from the true phylogenetic signal (Felsenstein 1978b). A number of following studies found that also distance methods suffer seriously from LBA; and that ML methods are least sensitive without eliminating it (Philippe et al. 2000b).
5.1.2 Methods to detect and avoid LBA.
LBA is notoriously difficult to detect and avoid. For example, a fast evolving species may not have a notably long branch in an incorrect phylogeny: when the out-group is distant from other species, fast-evolving species will be attracted to the base of the tree, and their branch length may not be notably long (Philippe 2000). Statistical support values cannot be used as indicator of LBA, as a strong artifact may lead to a well-supported yet incorrect tree topology. Therefore, evidence other than branch length and support values is required to trace LBA (Aguinaldo et al. 1997).
The shape of a tree topology with branch length, in conjunction with the tendency of fast-evolving species to vary position with varying taxon sampling, is a useful indictor
evolving lineages are likely attracted to the base (Philippe et al. 2000b). If the relationship among lineages is very different based on different genes, those phylogenies may be due to LBA (to be distinguished from lack of signal and lateral gene transfer). Yet another method to detect LBA is to compare phylogenies and statistical support values with different inference methods. Parsimony and distance methods are more sensitive to LBA than likelihood-based methods. Therefore, if a well-supported grouping with parsimony becomes weakly supported with likelihood methods, this grouping is likely due to LBA.
Another common approach to diagnose LBA uses systematic variation in data sampling (Philippe, Lartillot, and Brinkmann 2005), including either elimination or addition of taxa (i.e., elimination of the fast-evolving, and whenever they become available, addition of slowly evolving species that break up long internal branches), genes (preferably functionally unrelated genes), or sequence positions. The ultimate approach to avoid phylogenetic artifacts is the use of a more realistic (but more complex and computationally more demanding) evolutionary model. Two examples are the Gamma model that takes into account site rate variation, and the CAT model that accounts for account for site-specific features in the evolutionary processes. The application of these two models is known to suppress LBA in given examples (Lartillot, Brinkmann, and Philippe 2007).
5.1.3 LBA caused by compositional heterogeneity.
Most available evolutionary models make the assumption of compositional homogeneity. However, compositional heterogeneity and its effect on phylogenetic analysis has long
been recognized and described for both, nucleotide (Hasegawa and Hashimoto 1993) and protein sequences (Foster, Jermiin, and Hickey 1997; Foster and Hickey 1999).
To overcome the artifact caused by compositional heterogeneity at the nucleotide sequence level, the simplest approach consists in RY coding (Phillips, Delsuc, and Penny 2004). A serious drawback of RY coding is loss of phylogenetic information and decrease in phylogenetic resolution. The development of evolutionary models that take nucleotides compositional bias into account are a better alternative, for example, the models developed in (Galtier and Gouy 1998; Foster 2004). For protein coding genes, the common approach consists in analysis at the amino acid level, although proteins sequences are not completely free from compositional bias (Foster, Jermiin, and Hickey 1997; Foster and Hickey 1999).
The new CAT-BP model accounts for variations along lineages by combination of CAT with the non-stationary break point (BP) model (Blanquart and Lartillot 2006; Blanquart and Lartillot 2008). In this combination, equilibrium frequencies change along lineages, with the potential to overcome the effects of compositional bias. It was shows that CAT-BP significantly outperforms the widely used WAG and CAT models in terms of both model fitness and accuracy of phylogenetic inference (Blanquart and Lartillot 2008), yet its application is limited because of its high computational requirements.
5.2 Rapid radiation and incomplete lineage sorting
Although large amounts of data, advanced evolutionary models and newly developed methodologies have become available, many phylogenetic relationships continue to be
unresolved. Some examples are relationship among most of metazoan phyla (Rokas, Krüger, and Carroll, 2005), major groups of insects (Whitfield and Kjer, 2008), and the rodent genus (Thomomys) (Belfiore, Liu, and Moritz, 2008). One of the proposed reasons for lacking resolution is rapid radiation.
Detection of rapid radiation is difficult because it is not the only explanation for poorly resolved internal branch. Others include inadequate data, conflict within or among datasets, or loss of phylogenetic signal over time, and inappropriate phylogenetic methods and substitution models (Whitfield and Lockhart, 2007; Rokas and Carroll, 2006). Methods suggested for detecting real ancient radiations include comparison of results from different data types, to detect a potential conflict. The following sections briefly describe these methods.
In the case of rapid radiation, the phylogenetic relationship will not receive significant support using any data type (DNA, RNA, protein, genomic or morphologic data (Mardulyn and Whitfield, 1999)). Applying the realistic and sophisticated evolutionary model will not improve the resolution, compared with the simple model. Thus, comparison of results from different data types and models can help to understand the true reason behind the poor resolution.
The conflicting signals within a dataset may be detected by likelihood mapping (Strimmer and Haeseler, 1997), which analyzes all possible quartets of a dataset, and represents the result in an equilateral triangle. The vertices of the triangle represent three possible tree topologies of a quartet. The bootstrap support values for three trees will
determine one point inside the triangle. If there is enough phylogenetic information in the data, then most probability points will fall close to one of the vertices; conversely, datasets containing little phylogenetic information will mainly result in points falling into the center region of the triangle. Likelihood mapping can be obtained using the TreePuzzle package (Schmidt, et al., 2002).
As the time between divergences is shorter due to rapid radiation, different ancestral alleles may be present in the distantly related lineages, this is called incomplete lineage sorting problems (Maddison and Knowles, 2006). Consequently, sequence similarity may not reflect the true evolutionary relationship. In these situations, different genes may suggest different relationships and the underlying species phylogeny will be difficult to resolve (Knowles and Carstens, 2007; Heled and Drummond, 2010).
Incomplete lineage sorting is widespread in closely related speceis phylogenies than deep one, like Fungal phylogeny (Maddison and Knowles, 2006). Distantly related fungal taxa and extinction events decrease the chance that the polymorphisms of ancestral population appear in different lineages, then, reduce the likelihood of incomplete lineage sorting. Thus, incomplete lineage sorting is not a focus of this thesis.
6. Objectives of this study.
Our major objectives are to investigate unresolved phylogenetic issues by taking advantage of new data that were produced in our laboratory, and to develop new methods that increase
monophyly of Taphrinomycotina, the exact phylogenetic position of Nucleariida, and the relationships among and within major fungal groups, such as zygomycetes and chytridiomycetes.
To elucidate the phylogeny of Taphrinomycotina, we will address the following questions:
what is the relationship between Schizosaccharomyces and other Taphrinomy-cotina?
why does the mitochondrial dataset support a different relationship than nuclear dataset?
For the Nucleariida phylogeny, the following questions were asked: where is the nucleariid‟s exact position in the eukaryotic tree? is a mitochondrial dataset sufficient to resolve this issue?
how many sequence positions are required to resolve this question with confidence? We further attempted to resolve relationships for two less well-known major fungal groups, defined in traditional taxonomies as zygomycetes and chytridiomycetes:
are they monophyletic or paraphyletic?
if paraphyletic, can we resolve their branching order with confidence, with the currently available data?
Previous analyses based on single or a small number of genes failed to provide phylogenetic resolution of these questions. In this study, we tackle them by comparing
results with large nuclear gene and mitochondrial gene datasets, and by employing likelihood-based methods that are most reliable and robust.
As illustrated by many previous studies and the analysis of Taphrinomycotina using mitochondrial data (this study), phylogenetic artifacts are widespread and difficult to overcome. Recent studies show that heterotachous sites significantly contribute to LBA. We investigate if removal of highly heterotachous (HH) sites from a targeted group of species improves the prediction of correct phylogenetic relationships. For this, we have developed a statistical method that identifies and gradually removes HH sites. The effectiveness of our sequence removal procedure on phylogenetic inference is studied using two published datasets.
References
Adachi, J., and M. Hasegawa. 1996. Model of amino acid substitution in proteins encoded by mitochondrial DNA. J Mol Evol 42:459-468.
Adl, S. M., A. G. Simpson, M. A. Farmer, R. A. Andersen, O. R. Anderson, J. R. Barta, S. S. Bowser, G. Brugerolle, R. A. Fensome, S. Fredericq, T. Y. James, S. Karpov, P. Kugrens, J. Krug, C. E. Lane, L. A. Lewis, J. Lodge, D. H. Lynn, D. G. Mann, R. M. McCourt, L. Mendoza, O. Moestrup, S. E. Mozley-Standridge, T. A. Nerad, C. A. Shearer, A. V. Smirnov, F. W. Spiegel, and M. F. Taylor. 2005. The new higher level classification of eukaryotes with emphasis on the taxonomy of protists. J Eukaryot Microbiol 52:399-451.
Aguinaldo, A. M., J. M. Turbeville, L. S. Linford, M. C. Rivera, J. R. Garey, R. A. Raff, and J. A. Lake. 1997. Evidence for a clade of nematodes, arthropods and other moulting animals. Nature 387:489-493.
Baldauf, S. 2008. An overview of the phylogeny and diversity of eukaryotes. JOURNAL OF SYSTEMATICS AND EVOLUTION 46:263-273.
Baldauf, S. L., A. J. Roger, I. Wenk-Siefert, and W. F. Doolittle. 2000. A kingdom-level phylogeny of eukaryotes based on combined protein data. Science 290:972-977. Belfiore, N. M., L. Liu, and C. Moritz. 2008. Multilocus phylogenetics of a rapid radiation
in the genus Thomomys (Rodentia: Geomyidae). Syst Biol. 57:294-310. Bergsten, J. 2005. A review of long-branch attraction. Cladistics 21:163-193.
Blanquart, S., and N. Lartillot. 2008. A site- and time-heterogeneous model of amino acid replacement. Mol Biol Evol 25:842-858.
Blanquart, S., and N. Lartillot. 2006. A Bayesian compound stochastic process for modeling nonstationary and nonhomogeneous sequence evolution. Mol Biol Evol 23:2058-2071.
Brinkmann, H., M. van der Giezen, Y. Zhou, G. Poncelin de Raucourt, and H. Philippe. 2005. An empirical assessment of long-branch attraction artefacts in deep eukaryotic phylogenomics. Systematic Biology 54:743-757.
Bullerwell, C. E., L. Forget, and B. F. Lang. 2003. Evolution of monoblepharidalean fungi based on complete mitochondrial genome sequences. Nucleic Acids Res 31:1614-1623.
Bullerwell, C. E., J. Leigh, L. Forget, and B. F. Lang. 2003. A comparison of three fission yeast mitochondrial genomes. Nucleic Acids Res 31:759-768.
Burger, G., M. W., Gray, and B. F. Lang. 2003. Mitochondrial genomes: anything goes. Trends Genet. 19:709-16.Cafaro, M. J. 2005. Eccrinales (Trichomycetes) are not fungi, but a clade of protists at the early divergence of animals and fungi. Mol Phylogenet Evol 35:21-34.
Carr, M., B. S. Leadbeater, R. Hassan, M. Nelson, and S. L. Baldauf. 2008. Molecular phylogeny of choanoflagellates, the sister group to Metazoa. Proc Natl Acad Sci U S A 105:16641-16646.
Cavalier-Smith, T. 2004. Only six kingdoms of life. Proc Biol Sci 271:1251-1262.
Cavalier-Smith, T., and E. E. Chao. 2003. Phylogeny and classification of phylum Cercozoa (Protozoa). Protist 154:341-358.
Dayhoff, M., RM Schwartz and BC Orcutt. 1978. A model for evolutionary change in proteins. Pp. 345-352 in M. Dayhoff, ed. Atlas of Protein Sequence and Structure. National Biomedical Research Foundation, New York.
Degnan, J. H. and N. A. Rosenberg. 2009. Gene tree discordance, phylogenetic inference and the multispecies coalescent. Trends Ecol Evol. 24:332-40.
Delsuc, F., H. Brinkmann, and H. Philippe. 2005. Phylogenomics and the reconstruction of the tree of life. Nat Rev Genet. 6:361-75.
Douady, C. J., F. Delsuc, Y. Boucher, W. F. Doolittle, and E. J. Douzery. 2003. Comparison of Bayesian and maximum likelihood bootstrap measures of phylogenetic reliability. Mol Biol Evol 20:248-254.
Dujon, B., D. Sherman D, G. Fischer, P. Durrens, S. Casaregola, I. Lafontaine, J. De Montigny, C. Marck, C. Neuvéglise, E. Talla, N. Goffard, L. Frangeul, M. Aigle, V.
Beyne, C. Bleykasten, A. Boisramé, J. Boyer, L. Cattolico, F. Confanioleri, A. De Daruvar, L. Despons, E. Fabre, C. Fairhead, H. Ferry-Dumazet, A. Groppi, F. Hantraye, C. Hennequin, N. Jauniaux, P. Joyet, R. Kachouri, A. Kerrest, R. Koszul, M. Lemaire, I. Lesur, L. Ma, H. Muller, J. M. Nicaud, M. Nikolski, S. Oztas, O. Ozier-Kalogeropoulos, S. Pellenz, S. Potier, G. F. Richard, M. L. Straub, A. Suleau, D. Swennen, F. Tekaia, M. Wésolowski-Louvel, E. Westhof, B. Wirth, M. Zeniou-Meyer, I. Zivanovic, M. Bolotin-Fukuhara, A. Thierry, C. Bouchier, B. Caudron, C. Scarpelli, C. Gaillardin, J. Weissenbach, P. Wincker,J. L. Souciet. 2004. Genome evolution in yeasts. Nature. 430:35-44.
Edman, J., J. Kovacs, H. Masur, D. Santi, H. Elwood, and M. Sogin. 1988. Ribosomal RNA sequence shows Pneumocystis carinii to be a member of the fungi. Nature 334:519-522.
Edwards, A. W. F. and L. L. Cavalli-Sforza. 1964. Reconstruction of evolutionary trees. pp. 67-76 in Phenetic and Phylogenetic Classsification, ed. V. H. Heywood and J. McNeill. Systematics Association Publication No. 6, London.
Felsenstein, J. 1981. Evolutionary trees from DNA sequences: a maximum likelihood approach. J Mol Evol 17:368-376.
Felsenstein, J. 1978. Cases in which parsimony or compatibility methods will be positively misleading. Syst. Zool. 27:401-410.
Felsenstein, J. 2004. Inferring phylogenies. Sinauer Associates, Inc., Sunderland, Massachusetts.
Felsenstein, J., and G. A. Churchill. 1996. A Hidden Markov Model approach to variation among sites in rate of evolution. Mol Biol Evol 13:93-104.
Fitzpatrick, D. A., M. E. Logue, J. E. Stajich, and G. Butler. 2006. A fungal phylogeny based on 42 complete genomes derived from supertree and combined gene analysis. BMC Evol Biol 6:99.
Forget, L., J. Ustinova, Z. Wang, V. A. Huss, and B. F. Lang. 2002. Hyaloraphidium curvatum: a linear mitochondrial genome, tRNA editing, and an evolutionary link to lower fungi. Mol Biol Evol 19:310-319.
Foster, P. G. 2004. Modeling compositional heterogeneity. Systematic Biology 53:485-495. Foster, P. G., and D. A. Hickey. 1999. Compositional bias may affect both DNA-based and
protein-based phylogenetic reconstructions. J Mol Evol 48:284-290.
Foster, P. G., L. S. Jermiin, and D. A. Hickey. 1997. Nucleotide composition bias affects amino acid content in proteins coded by animal mitochondria. J Mol Evol 44:282-288.
Galtier, N. 2001. Maximum-likelihood phylogenetic analysis under a covarion-like model. Mol Biol Evol 18:866-873.
Galtier, N., and M. Gouy. 1998. Inferring pattern and process: maximum-likelihood implementation of a nonhomogeneous model of DNA sequence evolution for phylogenetic analysis. Mol Biol Evol 15:871-879.
Geman, S. and D. Geman. 1984. Stochastic Relaxation, Gibbs Distributions, and the Bayesian Restoration of Images. IEEE Trans Patt Ana Mach Intell 6: 721–741. Gonnet, G. H., M. A. Cohen, and S. A. Benner. 1992. Exhaustive matching of the entire
protein sequence database. Science 256:1443-1445.
Guindon, S., and O. Gascuel. 2003. A simple, fast, and accurate algorithm to estimate large phylogenies by maximum likelihood. Systematic Biology 52:696-704.
Gunderson, J. H., H. Elwood, A. Ingold, K. Kindle, and M. L. Sogin. 1987. Phylogenetic relationships between chlorophytes, chrysophytes, and oomycetes. Proc Natl Acad Sci U S A 84:5823-5827.
Hastings, W.K. 1970. Monte Carlo Sampling Methods Using Markov Chains and Their Applications. Biometrika 57: 97–109.
Hasegawa, M., and T. Hashimoto. 1993. Ribosomal RNA trees misleading? Nature 361:23. Hawksworth, D. L. 2001. The magnitude of fungal diversity: the 1.5 million species
Heled, J. and A. J. Drummond 2010. Bayesian inference of species trees from multilocus data. Mol Biol Evol. 27:570-80.
Hibbett, D. S., M. Binder, J. F. Bischoff, M. Blackwell, P. F. Cannon, O. E. Eriksson, S. Huhndorf, T. James, P. M. Kirk, R. Lucking, H. Thorsten Lumbsch, F. Lutzoni, P. B. Matheny, D. J. McLaughlin, M. J. Powell, S. Redhead, C. L. Schoch, J. W. Spatafora, J. A. Stalpers, R. Vilgalys, M. C. Aime, A. Aptroot, R. Bauer, D. Begerow, G. L. Benny, L. A. Castlebury, P. W. Crous, Y. C. Dai, W. Gams, D. M. Geiser, G. W. Griffith, C. Gueidan, D. L. Hawksworth, G. Hestmark, K. Hosaka, R. A. Humber, K. D. Hyde, J. E. Ironside, U. Koljalg, C. P. Kurtzman, K. H. Larsson, R. Lichtwardt, J. Longcore, J. Miadlikowska, A. Miller, J. M. Moncalvo, S. Mozley-Standridge, F. Oberwinkler, E. Parmasto, V. Reeb, J. D. Rogers, C. Roux, L. Ryvarden, J. P. Sampaio, A. Schussler, J. Sugiyama, R. G. Thorn, L. Tibell, W. A. Untereiner, C. Walker, Z. Wang, A. Weir, M. Weiss, M. M. White, K. Winka, Y. J. Yao, and N. Zhang. 2007. A higher-level phylogenetic classification of the Fungi. Mycol Res 111:509-547.
Huelsenbeck, J. P., F. Ronquist, R. Nielsen, and J. P. Bollback. 2001. Bayesian inference of phylogeny and its impact on evolutionary biology. Science 294:2310-2314.
James, T. Y., F. Kauff, C. L. Schoch, P. B. Matheny, V. Hofstetter, C. J. Cox, G. Celio, C. Gueidan, E. Fraker, J. Miadlikowska, H. T. Lumbsch, A. Rauhut, V. Reeb, A. E. Arnold, A. Amtoft, J. E. Stajich, K. Hosaka, G. H. Sung, D. Johnson, B. O'Rourke, M. Crockett, M. Binder, J. M. Curtis, J. C. Slot, Z. Wang, A. W. Wilson, A. Schussler, J. E. Longcore, K. O'Donnell, S. Mozley-Standridge, D. Porter, P. M. Letcher, M. J. Powell, J. W. Taylor, M. M. White, G. W. Griffith, D. R. Davies, R. A. Humber, J. B. Morton, J. Sugiyama, A. Y. Rossman, J. D. Rogers, D. H. Pfister, D. Hewitt, K. Hansen, S. Hambleton, R. A. Shoemaker, J. Kohlmeyer, B. Volkmann-Kohlmeyer, R. A. Spotts, M. Serdani, P. W. Crous, K. W. Hughes, K. Matsuura, E. Langer, G. Langer, W. A. Untereiner, R. Lucking, B. Budel, D. M. Geiser, A. Aptroot, P. Diederich, I. Schmitt, M. Schultz, R. Yahr, D. S. Hibbett, F.