Measuring the effect of government ESG performance on sovereign borrowing cost
34
0
0
Texte intégral
(2) CIRANO Le CIRANO est un organisme sans but lucratif constitué en vertu de la Loi des compagnies du Québec. Le financement de son infrastructure et de ses activités de recherche provient des cotisations de ses organisations-membres, d’une subvention d’infrastructure du Ministère de l'Enseignement supérieur, de la Recherche, de la Science et de la Technologie, de même que des subventions et mandats obtenus par ses équipes de recherche. CIRANO is a private non-profit organization incorporated under the Québec Companies Act. Its infrastructure and research activities are funded through fees paid by member organizations, an infrastructure grant from the Ministère de l'Enseignement supérieur, de la Recherche, de la Science et de la Technologie, and grants and research mandates obtained by its research teams. Les partenaires du CIRANO Partenaire majeur Ministère de l'Enseignement supérieur, de la Recherche, de la Science et de la Technologie Partenaires corporatifs Autorité des marchés financiers Banque de développement du Canada Banque du Canada Banque Laurentienne du Canada Banque Nationale du Canada Bell Canada BMO Groupe financier Caisse de dépôt et placement du Québec Fédération des caisses Desjardins du Québec Financière Sun Life, Québec Gaz Métro Hydro-Québec Industrie Canada Intact Investissements PSP Ministère des Finances et de l’Économie Power Corporation du Canada Rio Tinto Alcan Ville de Montréal Partenaires universitaires École Polytechnique de Montréal École de technologie supérieure (ÉTS) HEC Montréal Institut national de la recherche scientifique (INRS) McGill University Université Concordia Université de Montréal Université de Sherbrooke Université du Québec Université du Québec à Montréal Université Laval Le CIRANO collabore avec de nombreux centres et chaires de recherche universitaires dont on peut consulter la liste sur son site web. Les cahiers de la série scientifique (CS) visent à rendre accessibles des résultats de recherche effectuée au CIRANO afin de susciter échanges et commentaires. Ces cahiers sont écrits dans le style des publications scientifiques. Les idées et les opinions émises sont sous l’unique responsabilité des auteurs et ne représentent pas nécessairement les positions du CIRANO ou de ses partenaires. This paper presents research carried out at CIRANO and aims at encouraging discussion and comment. The observations and viewpoints expressed are the sole responsibility of the authors. They do not necessarily represent positions of CIRANO or its partners.. ISSN 2292-0838 (en ligne). Partenaire financier.
(3) Measuring the effect of government ESG performance on sovereign borrowing cost * Patricia Crifo †, Marc-Arthur Diaye ‡, Rim Oueghlissi§. Résumé/abstract This article examines whether the extra-financial performance of countries on environmental, social and governance (ESG) factors matter for sovereign bonds markets. We propose an econometric analysis of the relationship between ESG performances and government bond spreads of 23 OECD countries over the 2007-2012 period. Our results reveal that ESG ratings significantly decrease government bond spreads and this finding is robust for a wide range of model setups. We also find that the impact of ESG ratings on the cost of sovereign borrowing is more pronounced in bonds of shorter maturities. Finally, we show that extra-financial performance plays an important role in assessing risk in the financial system. In particular, the informational content of ESG ratings goes beyond the set of quantitative variables traditionally used as determinant of a country's extra-financial rating such as CO2 emissions, the share of protected areas, social expenditure and health expenditure per GDP, or the quality of institutions, and offers an additional evaluation of governments' ESG performance that matters for government bond spreads.. Mots-clés/Key words: Extra-financial ratings, ESG performance, Government bond spreads.. *. We would like to thank Bert Scholtens and Sebastien Pouget for their helpful comments. We also thank the participants at the PRI annual conference, the participants at the ERF annual conference and the Ecole Polytechnique-FDIR workshop. Of course, we remain responsible for all residual errors or omissions. We are grateful to Vigeo for granting us access to their data. The support of the Chair FDIR (Toulouse-IDEI and Ecole Polytechnique) is gratefully acknowledged. † Corresponding author. University of Paris West, EcolePolytechnique (Palaiseau, France) and CIRANO (Montreal, Canada). patricia.crifo@polytechnique.edu ‡ University Evry Val d’Essonne (EPEE). marc-arthur.diaye@univ-evry.fr. § University Evry Val d’Essonne (EPEE). rim.oueghlissi@ens.univ-evry.fr..
(4) 1. Introduction A common measure of a country’s borrowing cost in international capital markets is its yield spread, which is defined as a market’s measure of a country’s risk of default. Prior literature has argued that three types of potential determinants affect spreads (Attinasi et al., 2009; Manganelli and Wolswijk, 2009; Afonso et al., 2012). First, sovereign bond spreads are influenced by a country’s creditworthiness as reflected by its fiscal and macroeconomic position, the so-called ”credit risk” (Ardagna et al., 2004; Afonso et al., 2012). Second, liquidity risk, i.e. the size and depth of the government’s bond market, plays a role (G`omez-Puig, 2006; Beber et al., 2008). Third, government bond spreads reflect international risk aversion, i.e. investor sentiment towards this class of assets for each country (Codogno et al., 2003; Barrios et al., 2009). However, since the economic and financial crisis that started in mid 2007, there has been a change in the relative importance of each of these factors in explaining spreads. The empirical evidence suggests an increase in the importance of country specific factors, namely country credit risk, and to a lesser extent, liquidity factors (Barrios et al., 2009; Codogno et al., 2003; Mody, 2009) and international factors (Haugh et al., 2009; Barrios et al., 2009; Spencer and Liu, 2013). From this perspective, an increasing number of studies now point out the role of macro-economic conditions as explanatory variables of credit default risk. These studies examine, for instance, whether the debt burden of countries (Bernoth et al., 2012; Bernoth and Erdogan, 2012), openness and the terms of trade (Eichler and Maltritz, 2013; Maltritz, 2012) or fiscal variables (Gruber and Kamin, 2012) play an important role in explaining sovereign bond spreads. Yet, although the evidence in this literature clearly suggests some empirical regularities, the debate on the stable and significant determinants of sovereign bond spreads is far from settled. An extension of these studies is the identification of country specific financial health as a determinant of sovereign bond spreads (Mody, 2009; Sgherri and Zoli, 2009; Barrios et al., 2009; Bellas et al., 2010). Mody (2009) for instance finds that financial sector vulnerabilities (measured by the ratio of the country’s financial sector to the overall equity index) are strongly correlated with spreads changes in Euro area countries. He shows that the rescue of Bear Stearns in March 2008 marked a turning point. Thereafter a differentiation in sovereign spreads across Eurozone country emerged, caused mainly by differences in the prospects of the domestic financial sector. Differences widened in September 2008 (when Lehman Brothers failed), as some countries paid an increased penalty for high public debt to GDP ratios. In this spirit, De Bruyckere et al. (2013) present evidence in favor of interdependencies between the creditworthiness of sovereigns and the vulnerability of banks. Analyzing the risk spillovers between banks and countries and vice versa in Europe during the period 2006-2011, the authors show that bilateral exposures between banks and sovereigns are relatively large and are likely to induce risk spillovers. 2.
(5) Earlier researchers have also examined the effect of country political indicators on the risk premia paid by governments relative to the benchmark government bond. In particular, Citron and Nickelsburg (1987) observed that political instability was an important determinant of the probability of default. They constructed an indicator of political instability that measures the number of changes in government - that were accompanied by changes in policy - that took place within the previous five years. They found that, on top of various macroeconomic indicators, their measure of political instability had a significantly positive effect on the default probability. Brewer and Rivoli (1990) later confirmed these results by using regime instability, which was proxied by the changes in the head of government. Erb et al. (1996) present evidence that showed the significant performance of ”long” strategies for bonds issued by governments with decreasing political risk, and ”short” strategies for bonds from governments with increasing political risk. The political determinants of sovereign bond yield spreads have been of particular interest to researchers. For example, Ebner (2009) documents significant differences in government bond spreads in Central and Eastern Europe during crisis and non crisis periods, with political instability or uncertainty explaining the rise in spreads during crisis periods. Matei and Chaptea (2012) show in a panel of observations for 25 EU countries from 2003 to 2010 that a country’s political risk perception is a significant predictor of sovereign spreads. They also find that by looking at social and political factors, investors could build up a picture of a country, and better gauge the risks of investment. Eichler (2013) observes, for a sample of emerging countries, that sovereign bond yield spreads are affected by government’s political system. In particular, he observes that countries with parliamentary systems (as opposed to presidential regimes) face higher sovereign yield spreads. He also notes that improving the quality of governance helps to reduce sovereign bond yield spreads. Connolly (2007) investigated the links between sovereign bond spreads and corruption. He found that Transparency International’s corruption perception index downgraded the creditworthiness of sovereign bonds by diverting loan proceeds from productive projects to less productive ones, if not to offshore accounts. This suggests that efforts to make underwriting sovereign bonds more transparent and less corrupt would improve credit ratings and by implication lower the cost of sovereign borrowing. This is supported by Ciocchini et al. (2003), who observed that countries perceived as more corrupt had to pay higher yields when issuing bonds. His study combined data on bonds traded in the global market with survey data on corruption compiled by Transparency International. Similar findings were obtained by another study (Union Investment, 2012): countries whose bond yields rose the most during the Euro crisis, including Greece, Spain, Portugal and Italy, experienced the largest increase in their corruption perception index between 2007 and 2012. Margaretic and Pouget (2014) found that Environmental performance index (EPI) enabled a better assessment of the expected value and the volatility of sovereign bond spreads in emerging markets. Similarly, investigating the implications of different in3.
(6) dicators of sustainability performance of investment funds, Scholtens (2010) observed that the performance of Dutch government bond funds differed according to the environmental indicator. He suggested that funds should be very transparent and straightforward about their non-financial performance. Given these developments, it appears that an increasing attention is now being paid to the link between sovereign bond spreads and qualitative factors, the so-called environmental, social and governance (ESG) criteria. These supposedly soft factors have prompted renewed interest in the determination of sovereign bond spreads. Nevertheless, if academic and investor research observe that corruption -a key indicator of governance failings- and sovereign debt performance are clearly correlated, that social and political factors help to better assess country’s investment risk, the effect of environmental on sovereign bond spreads remains less noticeable. However, as noted by Decker and Woher (2012) “ the broader economic impacts of climate change, sustainable growth, large scale environmental accidents, and national energy policies have a decidedly macroeconomic focus ”. For Heyes (2000), who developed a novel approach that incorporates into the basic fixed price IS-LM framework an environmental constraint: “IS-LM-EE” framework, there is a substantial linkage between environmental performance and macroeconomic variables. This article aims to verify these interesting results. Our main novelty is not to consider the environmental, social and governance dimensions separately but rather together. More precisely, we explore whether government ESG concerns could be considered as a new class of risk that may have a severe impact on bond pricing. The main question raised (and hypothesis tested) here draws from the above mentioned literature as follows: Are sustainability criteria such as ESG factors significant predictors of sovereign bond spreads? With only a few exceptions, the existing literature is rather focused on the link between corporate bonds and ESG factors (Oikonomou et al, 2012; Bauer and Hann, 2011; El Ghoul et al., 2011; Bauer et al., 2009; Godfrey et al., 2009). Relatively little is known about how sovereign bond spreads are affected by environmental, social and governance concerns. One of the few studies on this topics (Moret and Sagnier, 2013) compares the total return of bonds issued by countries with high ESG scores (based on CO2 emissions per capita, the Human Development Index and other governance, social and environmental features) against a group with low ESG scores. The authors find that bonds issued by the countries with high ESG scores outperformed those with lower scores. An empirical framework, describing the ESG ratings of 78 countries for 2007 measured against Fitch ratings, conducted by MSCI (2011), documents a strong correlation between ESG factors and subsequent rating downgrades. The study observes that countries with the largest discrepancies between financial performance and ESG rankings were the most likely to be downgraded in subsequent years. In a relatively 4.
(7) new strand of literature, researchers have focused on the link between the financial performance of sovereign bonds and extra-financial socially responsible investment (SRI) factors. For instance, (Drut, 2010) shows for a sample of OECD countries that, in contrast to what is generally admitted, even if requiring higher socially responsible performance reduces portfolio diversification, the portfolio ratings may be improved at a very low cost, that is, without significantly displacing the efficient frontier. More precisely, the author shows that asset managers can create sovereign bond portfolios with a higher than average socially responsible rating without significantly losing diversification possibilities. Hereby, this study examines the relation between the financial and extra-financial performance of sovereign bonds. Our intent is to show how sovereign bond spreads are affected by qualitative factors. Our focus on sovereign bonds markets comes from two reasons. First, not long ago sovereign debt was the one asset class that pension funds, trusts, university endowments, insurance companies, charities and other institutions could count on as a safe and predictable source of income, especially if issued by a country with an investment-grade credit rating. However, the recent events the default of Greece and Portugal and the Ireland financial bailouts, Spain and Italy’s financial difficulties - have contributed to a shift in thinking about the materiality of responsible investment in credit investing. “Risk-free sovereign bonds are no longer considered something that exists” says Angela Homsi, a London-based director at Generation Investment Management LLP (Kohut and Beeching, 2013). The second reason for considering sovereign debt is the sheer size of the market. From 2007 to 2012, global outstanding government debt increased by 9.2 percent, equivalent to 21 percent of global financial assets of US$225 trillion (McKinsey, 2013). So, the objective of this research is to provide evidence that country ESG criteria could have an impact on their bond yield spreads. To this end, we consider the sustainability country ratings (SCR) produced by Vigeo, the leading extra-financial rating agency in Europe, which are indices meant to represent the countries’ ESG performances. We investigate the impact of these ratings on the cost of sovereign borrowing using panel data techniques for 23 countries from 2007 to 2012. The countries included in the analysis are Australia, Austria, Belgium, Canada, Switzerland, Germany, Denmark, Greece, Spain, Finland, France, the United Kingdom, Ireland, Italy, Japan, the Netherlands, Norway, New Zealand, Portugal and Sweden. Note that the USA is excluded since the yield on the benchmark “US Bond” is treated as the “risk-free” rate or the numeraire over which each country’s spreads are computed. Our study contributes to the empirical literature on sovereign risk in two ways. First, we provide sound evidence that the performance of countries on ESG concerns, measured by Vigeo sustainability country ratings, may impact sovereign bond markets. To the best of our knowledge no systematic study on the link between government ESG performance and sovereign bond spreads has been pursued so far on similar samples of 5.
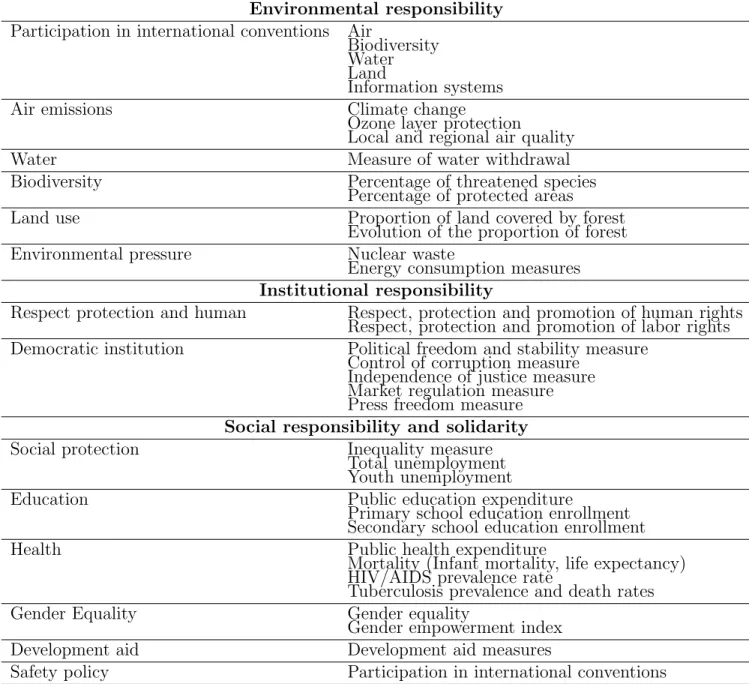
(8) countries and time period (with the notable exception of (Drut, 2010)). Reasons for this clear lack of cross-country evidence are twofold. On the one hand, factors associated with ESG criteria are of a qualitative nature and consequently hard to quantify. On the other hand, historical extra-financial ratings of governments have not existed long enough to perform any accurate back tests. Second, this paper sheds light on a new class of country risk, namely ESG risk factors, and hence, extra-financial analysis which assesses this class of risk, in particular Vigeo SCR, may convey important signals about future country credit risk. The paper’s main findings are as follows. We find evidence that higher ESG ratings are associated with lower borrowing cost. By implication, efforts to consider qualitative factors in the investment decision would decrease government bond spread, thus reducing the cost of sovereign borrowing. We also find that the impact of ESG indicators on the cost of sovereign borrowing is more pronounced in bonds of shorter maturities. Finally, we show that extra-financial ratings play an important role in assessing risk in the financial system as the informational content of ESG ratings goes beyond the set of quantitative variables traditionally used as determinant of a country’s sustainability performance including electricity generation, CO2 emissions, forest rents per GDP, share of protected areas, social expenditure per GDP, female to male labor force participation rate, health expenditure per GDP, R&D expenditure per GDP, the human development index, regulatory quality, rule of law, government effectiveness, political stability, voice and accountability, and corruption control. The remainder of this paper is structured as follows. Section 2 describes the data, presents the variables and the methodology used. Section 3 displays results and discussion. Section 4 concludes and presents key elements for further research. 2. Methodology 2.1. Data 2.1.1. Countries ESG performance measure To assess the performance of countries in terms of environmental, social and governance factors, we rely on the Vigeo sustainability country rating (SCR) database. Vigeo is a rating agency responsible for the provision of dependable environmental, social and governance (ESG) information. Vigeo has assessed the sustainability performance of more than 170 countries from the analysis of more than 130 indicators of risk and ESG performance related to Environmental Protection, Social Protection and Solidarity and the Rule of Law and Governance (see table 1 in the appendix for a comprehensive list). These indicators are selected based on a number of international codes. 6.
(9) and norms including the following: the Millennium Development Goals1 , Agenda 212 , the International Labour Organization (ILO) conventions, the United Nations Charters and Treaties, and the OECD Guiding Principles. For transparency reasons, Vigeo gathers only official data from international institutions and non-governmental organizations, such as the World Bank, the United Nations Development Program, the United Nations Environment Program, the United Nations Office on Drugs and Crime, the United Nations Childrens Emergency Fund, the Food and Agriculture Organization, the United Nations Conference on Trade and Development, the United Nations Department for Disarmament Affairs, the International Labour Institute, the Organization for Economic Co-operation and Development, the Office of the High Commissioner for Human Rights, Coface, Amnesty International, Transparency International, Freedom House, and Reporters Sans Fronti`eres. Specifically, each year, Vigeo rates countries separately on the indicator of each dimension which is reflective of a particular type of sustainability performance. Three separate annual ratings are available as well as a composite index. The specific indices are the Environmental Responsibility Rating (ERR), Social Responsibility and Solidarity Rating (SRSR), and the Institutional Responsibility Rating (IRR). For each rating, Vigeo has selected several criteria representing either commitments or quantitative realizations. For each criterion, countries are rated on a scale ranging from 0 to 100 (the best grade). For the commitment criteria, i.e. the signature and ratification of treaties and conventions, the grade is: 0 if the country did not sign, 50 if the country signed but did not ratify, and 100 if the country signed and ratified. For the quantitative criteria, a score is computed following the docile method: the 10 percent of worst-performing countries obtain a score of 10, and so on. Vigeo ranks not only levels but also trends computed as variation rates between the first and the last available values. More precisely, if a countrys trend lies in the top 20 percent, then it benefits from a premium of ten points for the criterion at stake; if the country exhibits a negative trend, it gets a ten-point penalty. The three specific annual ratings (ERR, SRSR, IRR) are weighted averages of scores. The SCR global index is an equally-weighted average of these three ratings. The advantage of using these Vigeo ratings comes from the wide spectrum of criteria taken into account. Moreover, we consider them to be a good indicator of countries’ ESG performance as they use only data from international organizations. In its statement on rating criteria, Vigeo lists numerous environmental, social, and governance factors that underlie its extra-financial ratings of countries. Although foreign government officials generally cooperate with the agencies, rating assignments that 1. These eight goals were established in 2000 by 189 countries as targets to be achieved by 2015. Agenda 21 on sustainable development was adopted by 179 countries in 1992 at the UN Earth Summit in Rio de Janeiro. 2. 7.
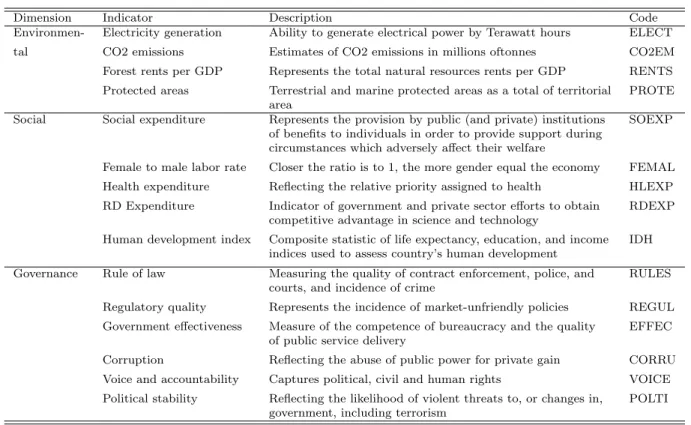
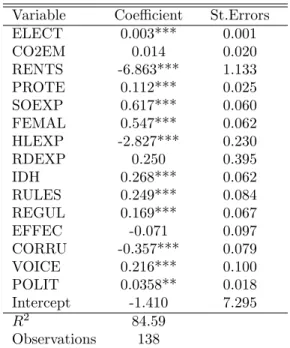
(10) are lower than anticipated often prompt issuers to question the consistency and rationale of extra-financial ratings. How clear are the criteria underlying extra-financial ratings? To explore this question, we conduct a first systematic analysis of the determinant of extra-financial ratings assigned by Vigeo. Such an analysis has only recently become possible as a result of the rapid growth in ESG rating assignments. The wealth of data now available allows us to estimate which quantitative indicators are weighted most heavily in the determination of these ratings, and to ensure that Vigeo ratings convey an accurate measure of countries’ sustainability performances. To do so, we regress Vigeo sustainability country ratings of the 23 countries under study from 2007 to 2012 against a set of quantitative variables that are repeatedly cited in rating agency reports3 including: Electricity generation, CO2 emissions, Forest rents per GDP, Protected areas as a total of territorial area, Social expenditure per GDP, Female to male labor force participation rate, Health expenditure per GDP, R&D expenditure per GDP, Human development index, Regulatory quality, Rule of law, Government effectiveness, Political stability, Voice and accountability, and Corruption control as given in Table .2. The selected variables have been particularly inspired by the work of Hesse (2006), who in association with Deloitte established the most important non-financial sustainability performance indicators for 30 companies, and the work of Bassen et al. (2006), who attempted to identify the most important corporate responsibility criteria for analysts and investors. These variables capture information on 15 key ESG performance indicators. Environmental indicators4 and include data on carbon intensity, protected area as a total of territorial area and forest rents as a percentage of GDP. Social indicators include data on labor sex discrimination, public spending on social, health and R&D and human development index. Governance indicators refer to the worldwide governance indicators (WGI), and they include the process by which governments are selected, monitored and replaced; the capacity of the government to effectively formulate and implement sound policies; and the respect of citizens and the state for the institutions that govern economic and social interactions among them. These governance indicators recall the corporate governance indices developed by Martynova and Renneboog (2010), which capture the major features of capital market laws and indicate how the law in each country addresses various potential agency conflicts between corporate constituencies: namely, between shareholder and managers, between majority and minority shareholders, and between shareholders and bondholders. Table 3 shows that these variables explain about 84% of the total variance of Vi3. Examples include Core Ratings, Deminor, Innovest, and Oekom, among others. For an overview see SustainAbility &Mistra (2004). 4 The Environmental indicators used in our analysis derive partially from the environmental performance index (EPI). These variables are inspired by those employed by Margaretic and Pouget (2014).. 8.
(11) geo’s ratings (SCR). Of the individual coefficients, Electricity generation, Forest rents per GDP, Protected areas as a total of territorial area, Social expenditure per GDP, Female to male labor force participation rate, Human development index, Regulatory quality, Rule of law, Political stability, Voice and accountability and Corruption control have the anticipated signs and are statistically significant. In fact, Forest rents appear to decrease extra-financial ratings, as does Corruption, while the Share of protected areas, Social expenditure per GDP, Female to male labor force participation rate, Human development index, Regulatory quality, Rule of law, Political stability, and Voice and accountability seem to increase sustainability ratings. Surprisingly, the coefficient associated with health expenditure is negative and statistically significant5 . This finding suggests that by increasing health expenditure, countries may decrease their sustainability score, which seems counter-intuitive. Note however that causality may in fact run in both directions (from health expenditures to ESG ratings or vice versa). From this perspective, empirical evidence suggests that in many countries the share of health expenditure in terms of GDP has tended to rise strongly during periods of economic downturns, and then to stabilize or decrease only slightly during periods of economic recovery. Therefore, one reason for this apparent negative relationship between health expenditure per GDP and sustainability ratings might be that countries with high sustainability scores may have been compelled by the recent crisis to cut down their budgetary deficits, leading to a noticeable reduction in the health spending share of GDP (Scherer and Devaux, 2010). 2.1.2. Sovereign borrowing cost measure As a measure of sovereign borrowing cost, we obtained the bond yield spread of government via Thomson Financial Datastream. The spreads are defined as the difference between the interest rate the government pays on its external US dollar denominated debt and the rate offered by US Treasury on debt of comparable maturity (Hilscher and Nosbusch, 2010). More precisely, we consider yield on sovereign bonds of the considered country minus yield on US sovereign bonds, both values are taken at the end of year, from the yield curve for a fixed maturity. The yield on the benchmark US Bond is, then, treated as the ”risk-free” rate or the numeraire over which each country’s spreads are computed. The Spreads are downloaded from 2007 to 2012. We choose three comparable maturities: 2 years, 5 years and 10 years. This variation of maturities within the sample is employed because, as suggested in economic literature, the sovereign borrowing cost will differ according to the time horizon (Afonso et al., 2012). 5. We expect that heath expenditure will raise the sustainability performance of States.. 9.
(12) 2.1.3. Control variables There is great variation in the set of empirical variables chosen to explain sovereign borrowing cost in different studies (Attinasi et al., 2009; Mody, 2009; Barbosa and Costa, 2010; Afonso et al., 2012; D’Agostino and Ehrmann, 2013). Therefore, we closely follow the empirical approach of Matei and Chaptea (2012) in our selection of variables. This has the benefit of generating comparable results with previous studies. We use seven country specific controls: (1) The GDP growth rate is an important determinant of the bond spread. It is usually used to capture the state of the economy and is supposed to have a negative influence on spread. Research on the sustainability of a country’s debt highlights the relationship between the growth rate of GDP and the growth rate of debt, pointing out that growing economies are more able to fulfil their financial obligations than stagnating economies (Bernoth et al., 2012). (2) Inflation reveals sustainable monetary and exchange rate policies. Higher price differentials points to structural problems in a government’s finances. When the government appears unable or unwilling to pay for current budgetary expenses through taxes or debt issuance, it must resort to inflationary money finance. Public dissatisfaction with inflation may in turn lead to political instability (Cantor and Packer, 1996), which could put upward pressure on government bond yields and thus the spreads could widen. (3) Government debt is expected to have a positive influence on the spreads because higher levels of debt increase the default risk and as a consequence yield spreads (Schuknecht et al., 2009). (4) The fiscal performance of the economy is captured by the government’s fiscal balance to GDP ratio. Governments running larger fiscal deficits would be considered less credit worthy and thus amplify the default risk (Attinasi et al., 2009; Sgherri and Zoli, 2009; Gruber and Kamin, 2012). (5) The liquidity ratio measures the access to credit relative to national reserves. Typically we use reserves to imports ratio. According to the literature (Cartapanis, 2002), this ratio is also a good indicator for the capacity of economies and central banks to face speculative attacks. A higher ratio can decrease investors’ confidence in the economy and this could be a sign of a banking crisis followed by a flight to quality. (6) To control for international risk, we include the degree of countries’ openness to trade and financial inflows. The literature (Ferrucci, 2003) shows that country openness plays an important role in explaining economies’ cost of borrowing as the penalty for sovereign default is higher in terms of capital reversion in an open rather than a closed economy. The higher this ratio, the greater is the ability of country to generate the required trade surpluses in order to refinance the present stock of debt or to finance new debt. Finally (7), we follow the literature (Afonso et al., 2012) and include sovereign credit ratings as determinants of sovereign borrowing costs. Sovereign credit ratings capture the government’s supposed ability to meet its financial commitments. Higher sovereign ratings are associated with lower borrowing costs.. 10.
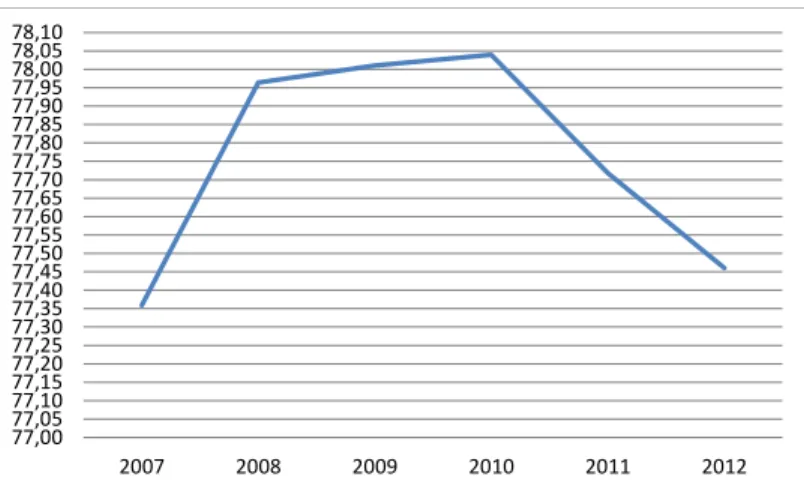
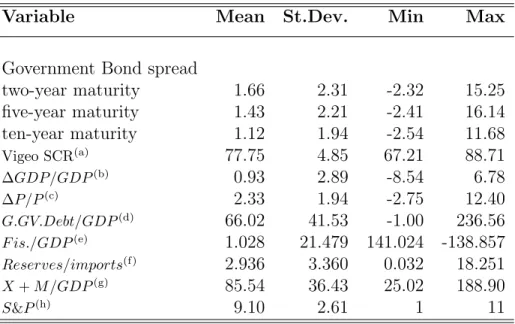
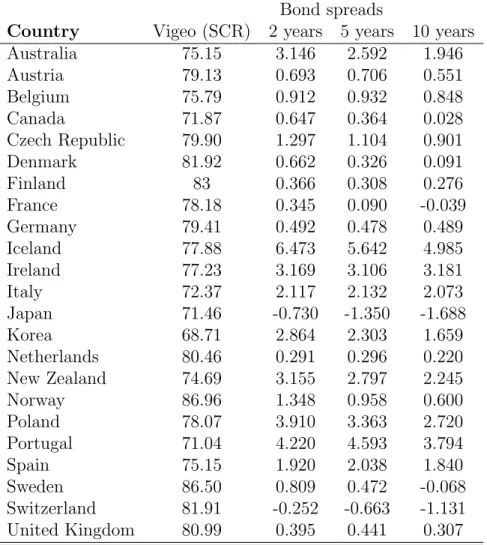
(13) 2.2. Descriptive statistics Our sample comprises yearly observation of 23 OECD countries from 2007 to 2012, resulting in 138 observations. The countries included in the analysis are Australia, Austria, Belgium, Canada, Switzerland , Germany, Denmark, Greece, Spain, Finland, France, United Kingdom, Ireland, Italy, Japan, Netherlands, Norway, New Zealand, Portugal and Sweden. Note that USA is excluded since the yield on the benchmark ”US Bond” is treated as the ”risk-free” rate or the numeraire over which each country’s spreads are computed. Table 4 reports the descriptive statistics of the Vigeo average ratings from 2007 to 2012 for the twenty three countries. The majority of countries are well rated. The dispersion of ratings is rather scattered among countries ranging from 0.288 to 3.209. This dispersion shows that even if the countries are developed and homogeneous from a wealth point of view, there is discrimination between good and bad performers regarding ESG criteria. The analysis of Vigeo ratings confirms certain popular views: Scandinavian countries (Denmark, Finland, Norway, and Sweden) obtain the best scores, with Norway and Sweden far above the other countries. Regarding Figure 1, which plots Vigeo SCR average scores for all countries over the period 2007-2012, we notice that scores experienced an increase until 2010, and that from 2011 they decreased. It remains, however, interesting to observe that, over the whole period, Vigeo SCR scores rose. Table 5 shows the distribution of all variables. The S&P credit rating is transformed into a numerical variable, ranging from 1 to 11. Table 6 shows the correlation matrix for control variables in the regression. A high level of correlation is found between extra-financial rating (Vigeo SCR) and financial rating (assessed by S&P rating). This is to be expected, since governments with the highest ESG scores also boast the best credit ratings (Novethic, 2010). Table 7 presents the distribution of mean spread by Vigeo SCR per country over the period 2007-2012. It reveals two interesting observations. First, it is easily noticeable that countries well rated on ESG criteria have low sovereign bond yield spreads. Second, for the majority of countries longer maturity is associated with lower bond spreads. This is probably due to the fact that lenders will charge higher yields on bonds with longer maturities, to cover the risk of lending over longer periods. By implication, relative yields (which can be analyzed in terms of ”spread” or in terms of difference in yield between a given bond and a US Treasury security with comparable maturity) tend to decrease when interest rates are rising. 2.3. Model specification Our data set is a panel data set that includes a group of 23 countries observed over a period of six years. In order to take advantage of the structure of our data set, which 11.
(14) includes both a country dimension and a time dimension, we use a panel regression.. F is ) + β3 ( ∆P ) + β4 ( G.GV.Debt )it + β5 ( GDP )it + Yit = β0 + β1 (V igeoSCR)it + β2 ( ∆GDP GDP it P it GDP. β6 ( Reserves ) + β7 ( X+M ) + +β8 (S&P )it + αi + λt + εit Import it GDP it (1) where i = 1 to n (the number of countries) and t = 1 to T (the number of periods). The independent variables are respectively V igeoSCR the sustainability country rating which is our variable of interest, ∆GDP/GDP the GDP growth, ∆P/P the inflation rate, G.GV.Debt/GDP the gross debt to GDP ratio, F is/GDP the country’s fiscal balance to GDP, Reserves/Import the ratio of reserves to imports, (X +M )/GDP the trade openness ratio, S&P the Standard &Poors based numerical variable assigning 1 to AAA rating, 2 to AA, 3 to A and so on. The dependent variable Yit is the government bond spreads. The residuals εit = αi + λt + uit where αi represents the (unobserved) country specific effect, λt represents the (unobserved) time specific effect, and uit represents a random error term with V ar(uit ) = σu2 and E(uit ) = 0 whatever i, t. The country specific effect αi permits us to take into account unobservable variables that are specific to the country i and time-invariant; while the time specific effect λt permits to take into account unobservable shocks that affect all countries indifferently. Since the 23 countries from our data set are not randomly selected (and are selected from the set of OECD countries), we use a fixed effect panel model (FE) where αi and λt are supposed to be certain. As a consequence, in a FE model, the αi and λt are (in addition to the parameters β0 · · · β8 ) to be estimated. In order to identify the model, only n − 1 of the αi , i = 1 · · · n and T − 1 of the λt , t = 1 · · · T , are included in the regression. One can notice that our choice of using a FE model seems to be accurate since the test for the non-existence of fixed effects rejects the null hypothesis and concludes with the existence of both country and time specific effects (see the appendix). However one may wonder whether the V igeoSCR rating is endogeneous. Endogeneity can be the consequence of two main mechanisms: unobserved heterogeneity (omitted variables) and simultaneity. Unobservables, such as the abilities and preferences of the sitting political administration are likely to affect government ESG behavior (Eichholtz et al., 2012) but also government bond spreads (Santiso, 2003; Moser, 2007). Since these variables are not included in the regression then they willbe de facto in the residuals εit . As a consequence, the Vigeo CSR rating will be correlated to the residuals εit . However, since such abilities and preferences could be seen as relatively 12.
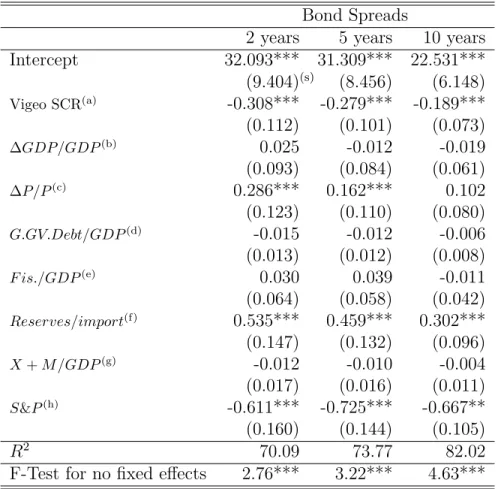
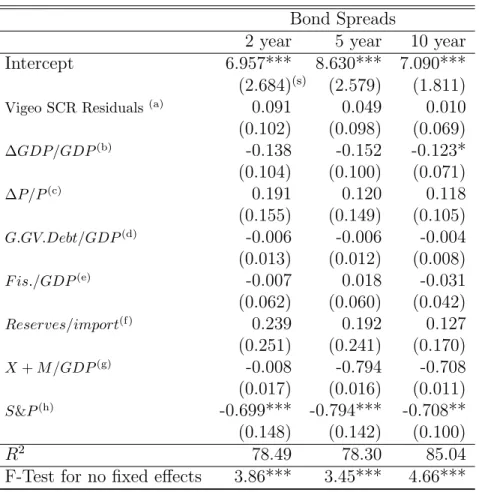
(15) constant over our period of time (2007-2012), they have already been taken into account in the country fixed effects. In other words, εit = αi + λt + uit and the Vigeo CSR rating may be correlated with the αi , not with the uit . Since the αi are fixed, they are explanatory variables of the model. Hence their eventual correlation with the Vigeo CSR rating will have no influence on the estimates of the parameters (except if this correlation is very high). Likewise, variables such as country wealth are taken into account in the country fixed effects. Concerning the simultaneity issue, the question is whether the sovereign debt cost also affects the Vigeo CSR rating. Let us remember that the Vigeo rating is constructed from about 130 indicators related to themes such as Environmental protection (see table 1 in the appendix). It seems therefore unlikely that the Vigeo CSR rating is directly influenced by the sovereign debt cost. Moreover in order to check whether the effect of Vigeo depends on the bonds’ maturities, we estimate our econometric model for three maturities: 2-year, 5-year and 10-year bond spreads. We include two robustness checks. The first one concerns the use of the S&P credit financial rating as a control variable. Indeed this variable may contain almost all the information included in the Vigeo extra-financial rating. At the same time, some studies (Mora, 2006; Flannery et al., 2010) suggest that financial ratings do not cover all aspects that explain a government’s financial credibility. We therefore include as a robustness check a model where the S&P financial credit rating has been excluded as a control variable. The second robustness check is about the informational content of the Vigeo rating. From an earlier regression (see Table 3) we have seen that the Vigeo rating is explained by some variables like Electricity generation, CO2 emissions, Forest rents per GDP, Protected areas as a total of territorial area, Social expenditure per GDP, Female to male labor force participation rate, Health expenditure per GDP, R&D expenditure per GDP, Human development index, Regulatory quality, Rule of law, Government effectiveness, Political stability, Voice and accountability, and Corruption control. The question is to know whether these variables together constitute a sufficient statistic to explain the informational content of Vigeo. For this purpose, we include in the FE regression not the full Vigeo rating but the part of this rating that is not correlated to the above variables (Electricity generation, CO2 emissions, ...). More precisely, we put in the FE regression, the residuals of the OLS regression of the Vigeo rating over the Electricity generation, CO2 emissions, etc. variables. We implement our estimation using the statistical software SAS. 3. Results and discussion 3.1. Results The results of the panel regressions are presented in Table 8. Control variables have the expected effects but not all are significant. Inflation and reserves to imports ratio 13.
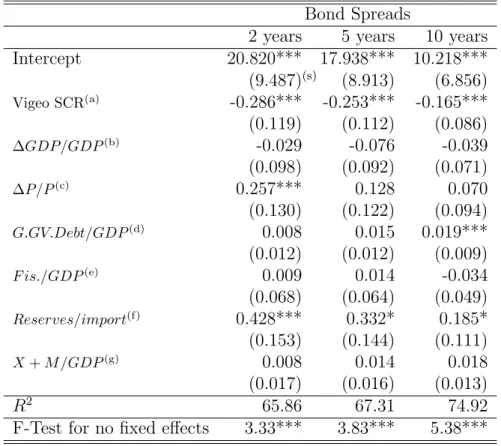
(16) significantly increase sovereign borrowing cost, while S&P credit ratings significantly lowers spreads (i.e. sovereign bond spreads tend to decline as S&P credit ratings rise). All models have an R-squared of around 70% or above. The coefficient associated with the Vigeo SCR variable is negative and significant. Thus, there is a negative correlation between the countries’ socially responsible performances assessed by the Vigeo sustainability country ratings (SCR) and the cost of sovereign borrowing defined by the government bonds spread. It seems therefore that countries displaying higher ESG indicators are “rewarded” by paying lower sovereign borrowing costs. The results look very robust. Regarding bonds maturity, the result is qualitatively the same regardless of whether the models are estimated with spreads of 2 years, or 5 years or 10 years. However the magnitude of the coefficients decreases (in absolute value) with the bond maturities: respectively -0.308 for a 2-year bond spreads, -0.279 for a 5-year bond spreads and -0.189 when considering 10-year bond spreads. It seems therefore that the impact of ESG indicators on the cost of sovereign borrowing is more pronounced for bonds with shorter maturities. Table 9 reports the results of FE regressions where the control variable S&P credit rating has been excluded as a control variable. One can see that extra-financial ratings remain negative and statistically significant whatever the bond maturities. However,the coefficients associated with the Vigeo CSR rating are weaker than those displayed in Table 8. Regarding control variables, in the first specification (2-year spreads) none of the other control variables become significant after excluding the S&P credit rating; while in the second specification (5-year spreads), only the reserves to imports ratio variable remains significant; finally in the third specification (10-year spreads) in addition to the reserves to imports ratio variable, the gross debt to GDP ratio variable becomes significant. Table 10 presents the results of the FE regression that uses a main variable of interest the residuals of the regression of the Vigeo rating over Electricity generation, CO2 emissions, Forest rents per GDP, Protected areas as a total of territorial area, Social expenditure per GDP, Female to male labor force participation rate, Health expenditure per GDP, R&D expenditure per GDP, Human development index, Regulatory quality, Rule of law, Government effectiveness, Political stability, Voice and accountability, and Corruption control. The regression shows that these residuals have no effect on the sovereign bond spreads. On the one hand, the predicted Vigeo rating based on the 15 above variables is a significant predictor of the sovereign bond spreads; on the other hand, these variables are altogether a sufficient statistic to explain Vigeo SCR. This result is true for the three maturities of sovereign bonds.. 14.
(17) 3.2. Discussion Our results confirm that countries displaying higher ESG indicators have lower sovereign borrowing costs. The coefficient is negative, significant and stable across a wide variety of model setups. The results are also economically relevant in the sense that they would matter to both investors and countries’ policy makers. Indeed, ESG assessments could play an important role in assessing risk and its location and distribution in the financial system. By facilitating investment decisions, ESG assessments can help investors in achieving a balance in the risk return profile and at the same time assist countries in accessing capital at a low cost. Based on the results in Table 8, we can note that a unit rise in Vigeo SCR is associated with a marginal decrease of about 0.3 in the 2-year bond spreads, of 0.28 in the 5-year bond spreads and of 0.19 in the 10-year bond spreads. This result implies that ESG ratings could be seen as “a potential risk-reducing, return-enhancing tool when added to the traditional mix of financial and economic data and political risk ” (Kohut and Beeching, 2013). This standpoint is supported by Drut (2010); Connolly (2007); Novethic (2010); MSCI (2011); Moret and Sagnier (2013) and Union Investment (2012). Our second result is that the impact of ESG indicators on the cost of sovereign borrowing is more pronounced in bonds of shorter maturities. This result is in line with previous studies findings that the financial effects of qualitative factors are more prone to arise in the short run. For instance, Bellas et al. (2010) found that, in the short run, financial fragility was a more important determinant of spreads than fundamental indicators. According to these authors, the short-term coefficient of financial stress index appears to be highly significant in all estimations, while the short term coefficients of fundamental variables are less robust. In particular, in the long run, debt and debt-related variables, trade openness, and a set of risk-free rates, primarily determine sovereign bond spreads, while in the short run, it is the degree of political risk, corruption, and financial stability in a country that plays the key role in the valuation of sovereign debt. According to Zoli (2005) and Baig et al. (2006), the fiscal policy actions and announcements move bond markets in the short run. Another (peripheral) result of our study is that extra-financial sustainability country rating can be explained by a small number of well-defined criteria, namely Electricity generation, CO2 emissions, Forest rents per GDP, Protected areas as a total of territorial area, Social expenditure per GDP, Female to male labor force participation rate, Health expenditure per GDP, R&D expenditure per GDP, Human development index, Regulatory quality, Rule of law, Government effectiveness, Political stability, Voice and accountability, and Corruption control. These variables seem to play an important role in determining a country’s ESG performance. Therefore, both investors and agencies may assign substantial weight to these variables in determining ESG rating assignments.. 15.
(18) In summary, this study demonstrates clearly that ESG scores are relevant predictors of sovereign credit risk. This result remains robust through a variety of robustness checks. First, the use of three maturities- 2 years, 5 years and 10 years- for the outcome variable (spreads) in the setup of our model provides a similar result: ESG scores lower sovereign borrowing cost. Then, the omission of credit rating as a control variable, given that it may be the case that this variable contains almost all the information included in the Vigeo extra-financial rating, leads to the same result. It is therefore encouraging that the coefficient of extra-financial ratings is negative and significant. Finally the FE regression using not the full Vigeo rating but the part of this rating that is not correlated to the quantitative variables that we selected (Electricity generation, CO2 emissions, Forest rents per GDP, Protected areas as a total of territorial area, Social expenditure per GDP, Female to male labor force participation rate, Health expenditures per GDP, R&D expenditure per GDP, Human development index, Regulatory quality, Rule of law, Government effectiveness, Political stability, Voice and accountability, and Corruption control) shows that the part of extra-financial ratings not explained by this set of quantitative variables does not affect borrowing cost; thus arguing that of a large number of indicators used by the Vigeo agency to assess the ESG performance of countries, a small number of well defined criteria seems to play an important role in determining a country’s sustainability rating. 4. Conclusion Sustainability has been gaining momentum in recent years at the country level, if not within the academic finance community. The difficulties that the Greek government faced in refinancing its debt at the beginning of 2010 illustrate the importance of considering governance indicators in sovereign bonds portfolio management. Countries are so invited to consider environmental social and governance (ESG) issues in their investment decision-making. And, while there is a growing body of literature on ESG performance, there has been little research on the effect of government ESG performance on the cost of debt financing. To our knowledge, this paper is among the first to examine the impact of government ESG performance on public debt using sovereign bond spreads as the vehicle for measuring the cost of sovereign borrowing. To do so, we collected information concerning several quantitative and qualitative variables for 23 OECD countries, from 2007 to 2012. We used Vigeo sustainability country ratings (SCR) to assess the ESG performance of those countries. With this panel data, we aimed at measuring empirically the effect of extra-financial ratings on government bond spreads. Our results show that higher ESG ratings are associated with lower borrowing cost. By implication, efforts to take qualitative factors into account in the investment decision would decrease government bond spread, thus reducing the cost of sovereign borrowing. We also find that the impact of ESG indicators on the cost of sovereign borrowing is more pronounced 16.
(19) in bonds of shorter maturities. Such extra-financial ratings therefore could play an important role in assessing risk in the financial system. Our findings suggest interesting avenues for future research. More work needs to be done to understand how the financial performance of sovereign bonds reacts to extrafinancial factors. One interesting direction for further research would be to focus on emerging and developing countries, where the sovereign bond market is different. We expect that socially responsible indicators for emerging countries would be much more scattered than for developed countries and also those ESG criteria would play a very different role. Interestingly, this issue is investigated by Margaretic and Pouget (2014). Another topic would be to study how the sub-ratings related to the environment, social concerns and public governance could affect the cost of sovereign borrowing. Finally, because of the relativity of the period of analysis (six years), another possible area of research is to extend the analysis and to test for the robustness of the results. This is our agenda for future research.. 17.
(20) References Afonso, A., Arghyrou, M., and Kontonikas, A., (2012),“The determinants of sovereign bond yield spreads in the EMU”, Working Papers 2012-14, Business School - Economics, University of Glasgow. Ardagna, S., Caselli, F. and Lane, T., (2004), “Fiscal Discipline and the Cost of Public Debt Service: Some Estimates for OECD Countries”, EBC Working Paper, No. 411. Attinasi, M-G., Checherita, C. and Nickel, C., (2009), “What explains the surge in euro area sovereign spreads during the financial crisis of 2007-09?”, ECB Working Paper, No. 1131. Baig, T., Kumar, M., Vasishtha G. and Zoli, E., (2006), “Fiscal and Monetary Nexus in Emerging Market Economies: How Does Debt Matter?”, IMF Working Paper, No. 06/184. Barbosa, L. and Costa, S.,(2010), “Determinants of sovereign bond yield spreads in the euro area in the context of the economic and financial crisis”, Banco de Portugal, Working Papers, No.22. Bassen, A., Holz, H.M., Sclange, J., Meyer, K., and Zamostny, A., (2006), “The influence of corporate responsibility on the cost of capital. An empirical analysis”, University of Hamburg, Schlange&Co and Deutsche Bank. Barrios, S., Lewandowska, P. M. and Setzer, R., (2009), “Determinants of intra-euro area government bond spreads during the financial crisis”, European Economy, Economic Papers, No. 388. http://ec.europa.eu/economy finance/publications/publication16255 en.pdf Bauer, R. and Hann, D., (2011), “Corporate Environmental Management and Credit Risk”, Working Paper, http://ssrn.com/abstract=1660470. Bauer, R., Hann, D. and Derwall, J.(2009), “Employee Relations and Credit Risk”, Working Paper presented at the 2009 Academy of Management Meeting/ 2009 Meeting of the American Accounting Association, http://ssrn.com/abstract=1483112. Beber, A., Brandt, M.W. and Kavajecz, K.A., (2008), “Flight to Quality or Flight to Liquidity? Evidence from the Euro Area Bond Market”, Review of Financial Studies, 22(3), pp. 925-957. Bellas, D., Papaioannou, M.G and Petrova, I., (2010), “Determinants of Emerging Market Sovereign Bond Spreads: Fundamentals vs Financial Stress”, IMF, WP10/281. Bernoth, K., von Hagen, J. and Schuknecht, L., (2012), “Sovereign risk premiums in the European government bond market”, Journal of International Money and Finance, 31(5), pp. 975-995. 18.
(21) Bernoth, K. and Erdogan B., (2012), “Sovereign Bond Yield Spreads: A Time-Varying Coefficient Approach”, Journal of International Money and Finance, 31, pp. 639-656. Brewer, T.L. and Rivoli, P., (1990), “Politics and perceived country creditworthiness in international banking”, Journal of Money, Credit and Banking, 22, pp.357-369. Cantor, R. and Packer, F., (1996), “Determinants and impact of sovereign credit ratings”, Reserve Bank of New York Economic Policy Review, 2, pp. 37-53. Cartapanis, A., (2002), “Les crises de change, qu’avons-nous appris depuis dix ans?”, Economie internationale, 88(4), pp.1-16. Citron, J.I., Nickelsburg, G., (1987), “Country risk and political instability”, Journal of Development Economics, 25, pp. 385392. Ciocchini, F., Durbin, E. and Ng, D., (2003), “Does corruption increase emerging market bond spreads?”, Journal of Economics and Business, 55, pp. 503-528. Codogno, L., Favero, C. and Missale, A., (2003), “Yield spreads on EMU government bonds”, Economic Policy, 18, pp. 503-532. Connolly, M., (2007), “Measuring the effect of corruption on sovereign bond ratings”, Journal of Economic Policy Reform, 10(4), pp. 309-323. D’Agostino, A. and Ehrmann, M., (2013), “The pricing of G7 sovereign bond spreads: The times they are a changing”, European Central Bank, Working Papers, No. 1520. De Bruyckere, V., Gerhardt, M., Schepens, G. and Vennet, R.V, (2013), “Bank/sovereign risk spillovers in the European debt crisis”, Journal of Banking & Finance, 37(12), pp. 4793-4809. Decker, C.S and Woher M.E., (2012),“Substitutability or complementary? Re-visiting Heyes IS-LM-EE model”, Ecological Economics, 74, pp 3-7. Drut, B. (2010), “Sovereign bonds and socially responsible investment”, Journal of Business Ethics, 92(1), pp. 131-145. Ebner, A. (2009), “An Empirical Analysis on the Determinants of CEE Government Bond Spreads”, Emerging Market Review, 10, pp. 97-121. Eichler, S., (2013), “The political determinants of sovereign bond yield spreads”, Journal of International Money and Finance, 46, pp. 82-103. Eichler, S. and Maltritz, D., (2013), “The term structure of sovereign default risk in EMU member countries and its determinants”, Journal of Banking & Finance, 37(6), pp. 1810-1816.. 19.
(22) Eichholtz, P., Kok, N. and Yonder, E., (2012), “Portofolio greenness and the financial performance of REITs”, Journal of International Money and Finance, 31(7), pp. 1911-1929. El Ghoul, S., Guedhami, O., Kwok, C.C.Y. and Mishra, D.R., (2011), “Does corporate social responsibility affect the cost of capital?”, Journal of Banking & Finance, 35(9), pp 2388-2406. Erb, C., Harvey, C. and Viskanta, T., (1996), “The influence of political, economic, and financial risk on expected fixed-income returns”, Journal of Fixed Income, 6, pp. 7-31. Ferrucci, G., (2003), “Empirical determinants of emerging market economies’ sovereign bond spreads”, Bank of England Working Papers, No. 205. Flannery, M., Houston, J. and Partnoy, F., (2010), “Credit default swap spreads as viable substitutes for credit ratings”, University of Pennsylvania Law Review, 158, pp. 2085-2123. Godfrey, P.C., Merrill, C.B. and Hansen J.M., (2009), “The relationship between corporate social responsibility and shareholder value: an empirical test of the risk management hypothesis”, Strategic Management Journal, 30(4), pp. 425-445. G`omez-Puig, M., (2006), “Size Matters for Liquidity: Evidence from EMU Sovereign Yield Spreads”, Economics Letters, 90, pp. 156-162. Gruber, J.W and Kamin, S. B., (2012), “Fiscal Positions and Government Yields in OECD Countries”, Journal of Money, Credit and Banking, 44(8), pp. 1563-1587. Heyes, A., (2000), “A proposal for the greening of textbook macro: IS-LM-EE”, Ecological Economics, 32, pp 1-7. Haugh, D., Ollivaud, P. and Turner, D., (2009), “What Drives Sovereign Risk Premiums? An Analysis of Recent Evidence from the Euro Area”, OECD Economics Department Working Paper, No. 718. Hesse, A., (2006), “Added value, long term, Non-financial sustainability key performance indicators on their way into financial reports of German companies”, Deloitte and German Federal Ministry of the environment. Hilscher, J. and Nosbusch, Y., (2010), “Determinants of Sovereign Risk: Macroeconomic Fundamentals and the Pricing of Sovereign Debt”, Review of Finance, 14, pp. 235-262. Kohut, J. and Beeching, A., (2013), “Sovereign bonds: spotlight on ESG risks”, Principles for responsible investment (PRI).. 20.
(23) Maltritz, D., (2012), “Determinants of Sovereign Yield Spreads in the Eurozone: A Bayesian Approach”, Journal of International Money and Finance, 31, pp. 657-672. Manganelli, S. and Wolswijk, G., (2009), “What Drives Spreads in the Euro Area Government Bond Market?”, Economic Policy, 24, pp. 191-240. Margaretic, P. and Pouget, S., (2014), “Sovereign bond spreads and extra-financial information: an empirical analysis of emerging markets”, Mimeo Toulouse School of Economics. Martynova, M. and Renneboog, L., (2010), “A corporate governance index: convergence and diversity of national corporate governance regulations”, Discussion Paper 2010012, Tilburg University, Tilburg Law and Economic Center. Matei, I. and Chaptea, A., (2012), “Sovereign bond spread drivers in the EU market in the aftermath of the global financial crisis”, Paris 1 Pantheon-Sorbonne University (Post-Print and Working Papers) hal-00845660, HAL. McKinsey Global Institute, (2013), “Financial globalization: Retreat or reset?”, Global Capital Markets. Mody, A., (2009), “From Bear Stearns to Anglo Irish: How Eurozone Sovereign Bond Spreads Related to Financial Sector Vulnerability”, IMF Working Paper, No. 09/108. Mora, N., (2006), “Sovereign credit ratings: Guilty beyond reasonable doubt?”, Journal of Banking & Finance, 30, pp. 2041-2062. Moret, L. and Sagnier , P., (2013), “Sovereign Debt Investing: ESG Framework and Applications”, AXA Investment Managers, January 2013, http://www.axa-im.com/. Moser, C., (2007), “The impact of political risk on sovereign bond spreads: evidence from Latin America”, Proceedings of the German Development Economics Conference, Gottingen. MSCI, ESG Research, (2011), “Integrating ESG into the Investment Process”, Whitepaper, http//www.msci.com/. Novethic, (2010), “SRI: http//www.novethic.com/. How. to. rate. and. select. governments”,. Oikonomou, I., Brooks, C. and Pavelin, S., (2012),“The impact of corporate social performance on financial risk and utility: a longitudinal analysis”, Financial Management, 41(2), pp. 483- 515 Santiso, J., (2003). The Political Economy of Emerging Markets: Actors, Institutions and Crisis in Latin America, New York: Palgrave.. 21.
(24) Scherer, P. and Devaux, M., (2010), “The Challenge of Financing Health Care in the Current Crisis: An Analysis Based on the OECD Data”, OECD Health Working Papers, No. 49, OECD Publishing. http://dx.doi.org/10.1787/5kmfkgr0nb20-en. Scholtens, B., (2010), “The Environmental Performance of Dutch Government Bond Funds”, Journal of Business Ethics, 92, pp. 117-130. Schuknecht, L., Von Hagen, J. and Wolswijk, G., (2009), “Government Risk Premiums in the Bond Market: EMU and Canada”, European Journal of Political Economy, 25, pp. 371-384. Sgherri, S. and Zoli, E., (2009), “Euro Area Sovereign Risk During the Crisis”, IMF Working Paper, No. 09/222. Spencer, P., and Liu, Z., (2013),“Modelling Sovereign Credit Spreads with International Macro Factors: The Case of Brazil 1998-2009”, Journal of Banking & Finance, 37(2), pp. 241-256 SustainAbility & Mistra (2004), “Values for Money: Reviewing the Quality of SRI Research”, London : SustainAbility ; Stockholm : Mistra, 2004. http://www.ethicalquote.com/docs/values-for-money.pdf Union Investment, (2012), “Transparency ruption Perceptions Index (CPI)”, investor.com/images/uploads/reports/Sommer.Union Investment. 12 June.pdf. International, Corhttp://www.responsible-. Zoli, E., (2005), “How Does Fiscal Policy Affect Monetary Policy in Emerging Market Countries?”, BIS Working Paper, No. 174.. 22.
(25) Appendix Table .1: Themes taken into account in the Vigeo Country Ratings. Environmental responsibility Participation in international conventions Air Biodiversity Water Land Information systems Air emissions Climate change Ozone layer protection Local and regional air quality Water Measure of water withdrawal Biodiversity Percentage of threatened species Percentage of protected areas Land use Proportion of land covered by forest Evolution of the proportion of forest Environmental pressure Nuclear waste Energy consumption measures Institutional responsibility Respect protection and human Respect, protection and promotion of human rights Respect, protection and promotion of labor rights Democratic institution Political freedom and stability measure Control of corruption measure Independence of justice measure Market regulation measure Press freedom measure Social responsibility and solidarity Social protection Inequality measure Total unemployment Youth unemployment Education Public education expenditure Primary school education enrollment Secondary school education enrollment Health Public health expenditure Mortality (Infant mortality, life expectancy) HIV/AIDS prevalence rate Tuberculosis prevalence and death rates Gender Equality Gender equality Gender empowerment index Development aid Development aid measures Safety policy Participation in international conventions. 23.
(26) Table .2: Description of the Determinant of Vigeo SCR Dimension Environmen-. Indicator Electricity generation. Description Ability to generate electrical power by Terawatt hours. Code ELECT. tal. CO2 emissions. Estimates of CO2 emissions in millions oftonnes. CO2EM. Forest rents per GDP. Represents the total natural resources rents per GDP. RENTS. Protected areas. PROTE. Social expenditure. Terrestrial and marine protected areas as a total of territorial area Represents the provision by public (and private) institutions of benefits to individuals in order to provide support during circumstances which adversely affect their welfare. Female to male labor rate. Closer the ratio is to 1, the more gender equal the economy. FEMAL. Health expenditure. Reflecting the relative priority assigned to health. HLEXP. RD Expenditure. Indicator of government and private sector efforts to obtain competitive advantage in science and technology. RDEXP. Human development index. Composite statistic of life expectancy, education, and income indices used to assess country’s human development. IDH. Rule of law. Measuring the quality of contract enforcement, police, and courts, and incidence of crime. RULES. Regulatory quality. Represents the incidence of market-unfriendly policies. REGUL. Government effectiveness. Measure of the competence of bureaucracy and the quality of public service delivery. EFFEC. Corruption. Reflecting the abuse of public power for private gain. CORRU. Voice and accountability. Captures political, civil and human rights. VOICE. Political stability. Reflecting the likelihood of violent threats to, or changes in, government, including terrorism. POLTI. Social. Governance. 24. SOEXP.
(27) Table .3: Regression of Vigeo SCR Variable ELECT CO2EM RENTS PROTE SOEXP FEMAL HLEXP RDEXP IDH RULES REGUL EFFEC CORRU VOICE POLIT Intercept R2 Observations. Coefficient 0.003*** 0.014 -6.863*** 0.112*** 0.617*** 0.547*** -2.827*** 0.250 0.268*** 0.249*** 0.169*** -0.071 -0.357*** 0.216*** 0.0358** -1.410 84.59 138. St.Errors 0.001 0.020 1.133 0.025 0.060 0.062 0.230 0.395 0.062 0.084 0.067 0.097 0.079 0.100 0.018 7.295. ***,**,* significant respectively at 1%, 5%, 10%. 25.
(28) Table .4: Vigeo SCR per country over the period 2007-2012. Country Australia Austria Belgium Canada Czech Republic Denmark Finland France Germany Iceland Ireland Italy Japan Korea Netherlands New Zealand Norway Poland Portugal Spain Sweden Switzerland United Kingdom (a). Vigeo rating 75.15(a) 79.13 75.79 71.87 79.90 81.92 83 78.18 79.41 77.88 77.23 72.37 71.46 68.71 80.46 74.69 86.96 78.07 71.04 75.15 86.50 81.91 80.99. St.Dev. 1.48 0.82 0.85 1.00 1.75 0.52 0.41 0.83 1.29 3.18 0.95 0.99 2.71 1.54 0.75 1.91 1.30 0.81 0.28 0.85 0.67 0.68 0.55. Min 73.90 78.80 74.55 70.59 77.82 81.19 82.51 76.99 77.64 73.81 75.66 70.67 67.4 67.21 79.67 71.5 85.05 77.03 70.69 73.85 85.2 80.85 80.6. Max 77.94 80.71 77.12 73.24 82.12 82.57 83.66 79.12 81.09 81.3 78.34 73.6 75.24 71.52 81.82 77.03 88.71 79.23 71.34 75.96 87.07 83 82.07. = Mean Vigeo sustainability ratings for Australia over the period 2007-2012.. 26.
(29) Figure .1: Vigeo SCR average scores for all countries over the period 2007-2012. 78,10 78,05 78,00 77,95 77,90 77,85 77,80 77,75 77,70 77,65 77,60 77,55 77,50 77,45 77,40 77,35 77,30 77,25 77,20 77,15 77,10 77,05 77,00 2007. 2008. 2009. 27. 2010. 2011. 2012.
(30) Table .5: Distribution of the variables. Variable. Mean. Government Bond spread two-year maturity five-year maturity ten-year maturity Vigeo SCR(a) ∆GDP/GDP (b) ∆P/P (c) G.GV.Debt/GDP (d) F is./GDP (e) Reserves/imports(f) X + M /GDP (g) S&P (h). St.Dev.. 1.66 1.43 1.12 77.75 0.93 2.33 66.02 1.028 2.936 85.54 9.10. Min. Max. 2.31 -2.32 2.21 -2.41 1.94 -2.54 4.85 67.21 2.89 -8.54 1.94 -2.75 41.53 -1.00 21.479 141.024 3.360 0.032 36.43 25.02 2.61 1. 15.25 16.14 11.68 88.71 6.78 12.40 236.56 -138.857 18.251 188.90 11. (a). = Our variable of interest: sustainability country rating. = GDP growth. (c) = Inflation rate. (d) = Gross debt to GDP ratio. (e) = Country’s fiscal balance to GDP. (f) = Ratio of reserves to imports. (g) = Trade openness ratio. (b). (h). = Numerical variable assigning 1 to BB, 2 to BB+ and so on through 11 to AAA.. Table .6: Pearson Correlation matrix. 1 1 Vigeo SCR 2 ∆GDP/GDP 3 ∆P/P 4 G.GV.Debt/GDP 5 F is./GDP 6 Reserves/import 7 X + M /GDP 8 S&P (a). 2. 3. 4. 5. 6. 1 -0.04(a) 1 -0.00 0.15 1 -0.32 -0.23 -0.20 1 -0.164 0.169 -0.04 -0.042 1 -0.24 0.00 -0.053 0.45 0.08 1 0.23 0.01 0.01 -0.11 -0.05 -0.34 0.41 0.02 -0.29 -0.26 0.28 -0.17. = Correlation coefficient between the GDP growth variable and the Vigeo SCR variable.. 28. 7. 1 -0.03 1.
(31) Table .7: Mean spread by Vigeo SCR per country over the period 2007-2012. Country Australia Austria Belgium Canada Czech Republic Denmark Finland France Germany Iceland Ireland Italy Japan Korea Netherlands New Zealand Norway Poland Portugal Spain Sweden Switzerland United Kingdom. Vigeo (SCR) 75.15 79.13 75.79 71.87 79.90 81.92 83 78.18 79.41 77.88 77.23 72.37 71.46 68.71 80.46 74.69 86.96 78.07 71.04 75.15 86.50 81.91 80.99. 29. Bond spreads 2 years 5 years 3.146 2.592 0.693 0.706 0.912 0.932 0.647 0.364 1.297 1.104 0.662 0.326 0.366 0.308 0.345 0.090 0.492 0.478 6.473 5.642 3.169 3.106 2.117 2.132 -0.730 -1.350 2.864 2.303 0.291 0.296 3.155 2.797 1.348 0.958 3.910 3.363 4.220 4.593 1.920 2.038 0.809 0.472 -0.252 -0.663 0.395 0.441. 10 years 1.946 0.551 0.848 0.028 0.901 0.091 0.276 -0.039 0.489 4.985 3.181 2.073 -1.688 1.659 0.220 2.245 0.600 2.720 3.794 1.840 -0.068 -1.131 0.307.
(32) Table .8: Regression of bond spreads (with country and time fixed effects). Bond Spreads 2 years 5 years 10 years Intercept 32.093*** 31.309*** 22.531*** (9.404)(s) (8.456) (6.148) (a) Vigeo SCR -0.308*** -0.279*** -0.189*** (0.112) (0.101) (0.073) ∆GDP/GDP (b) 0.025 -0.012 -0.019 (0.093) (0.084) (0.061) (c) ∆P/P 0.286*** 0.162*** 0.102 (0.123) (0.110) (0.080) G.GV.Debt/GDP (d) -0.015 -0.012 -0.006 (0.013) (0.012) (0.008) F is./GDP (e) 0.030 0.039 -0.011 (0.064) (0.058) (0.042) Reserves/import(f) 0.535*** 0.459*** 0.302*** (0.147) (0.132) (0.096) (g) X + M /GDP -0.012 -0.010 -0.004 (0.017) (0.016) (0.011) S&P (h) -0.611*** -0.725*** -0.667** (0.160) (0.144) (0.105) 2 R 70.09 73.77 82.02 F-Test for no fixed effects 2.76*** 3.22*** 4.63*** ***,**,* significant respectively at 1%, 5%, 10% (a). = Our variable of interest: sustainability country rating. = GDP growth. (c) = Inflation rate. (d) = Gross debt to GDP ratio. (e) = Country’s fiscal balance to GDP. (f) = Ratio of reserves to imports. (g) = Trade openness ratio. (h) = Numerical variable assigning 1 to BB, 2 to BB+ and so on through 11 to AAA. (b). (s). = standard error.. 30.
(33) Table .9: Regression of bond spreads (with country and time fixed effects, S&P credit rating variable omitted). Bond Spreads 2 years 5 years 10 years Intercept 20.820*** 17.938*** 10.218*** (9.487)(s) (8.913) (6.856) (a) Vigeo SCR -0.286*** -0.253*** -0.165*** (0.119) (0.112) (0.086) (b) ∆GDP/GDP -0.029 -0.076 -0.039 (0.098) (0.092) (0.071) ∆P/P (c) 0.257*** 0.128 0.070 (0.130) (0.122) (0.094) G.GV.Debt/GDP (d) 0.008 0.015 0.019*** (0.012) (0.012) (0.009) F is./GDP (e) 0.009 0.014 -0.034 (0.068) (0.064) (0.049) (f) Reserves/import 0.428*** 0.332* 0.185* (0.153) (0.144) (0.111) X + M /GDP (g) 0.008 0.014 0.018 (0.017) (0.016) (0.013) R2 65.86 67.31 74.92 F-Test for no fixed effects 3.33*** 3.83*** 5.38*** ***,**,* significant respectively at 1%, 5%, 10% (a). = Our variable of interest: sustainability country rating. = GDP growth. (c) = Inflation rate. (d) = Gross debt to GDP ratio. (e) = Country’s fiscal balance to GDP. (f) = Ratio of reserves to imports. (g) = Trade openness ratio. (b). (s). = standard error.. 31.
(34) Table .10: FE regression using Vigeo SCR Residuals. Bond Spreads 2 year 5 year 10 year Intercept 6.957*** 8.630*** 7.090*** (2.684)(s) (2.579) (1.811) Vigeo SCR Residuals (a) 0.091 0.049 0.010 (0.102) (0.098) (0.069) (b) ∆GDP/GDP -0.138 -0.152 -0.123* (0.104) (0.100) (0.071) (c) ∆P/P 0.191 0.120 0.118 (0.155) (0.149) (0.105) G.GV.Debt/GDP (d) -0.006 -0.006 -0.004 (0.013) (0.012) (0.008) F is./GDP (e) -0.007 0.018 -0.031 (0.062) (0.060) (0.042) (f) Reserves/import 0.239 0.192 0.127 (0.251) (0.241) (0.170) X + M /GDP (g) -0.008 -0.794 -0.708 (0.017) (0.016) (0.011) S&P (h) -0.699*** -0.794*** -0.708** (0.148) (0.142) (0.100) R2 78.49 78.30 85.04 F-Test for no fixed effects 3.86*** 3.45*** 4.66*** ***,**,* significant respectively at 1%, 5%, 10% (a). = The part of sustainability country rating not correlated to quantitative variables used on the first stage regression (b) = GDP growth. (c) = Inflation rate. (d) = Gross debt to GDP ratio. (e) = Country’s fiscal balance to GDP. (f) = Ratio of reserves to imports. (g) = Trade openness ratio. (h) = Numerical variable assigning 1 to BB, 2 to BB+ and so on through 11 to AAA. (s) = standard error. The variables in the first stage regression (not shown) are: electricity generation, Co2 emissions, Forest rents as GDP ratio, protected areas as a total of territorial area, social expenditure per GDP, Female to male labor force participation rate, health expenditure per GDP, R&D expenditure per GDP, Human development index, regulatory quality, rule of law, government effectiveness, political stability, voice and accountability and corruption control.. 32.
(35)
Figure

+7
Documents relatifs
Figure 5: Evolution of the main metabolic molecules and uptake rates of glucose and oxygen as a function of the cell energetic demand from low to high. Oxygen
[1] addresses two main issues: the links between belowground and aboveground plant traits and the links between plant strategies (as defined by these traits) and the
First introduced by Faddeev and Kashaev [7, 9], the quantum dilogarithm G b (x) and its variants S b (x) and g b (x) play a crucial role in the study of positive representations
Keywords: Behavioural Science, Behavioural Economics, Health Promotion, Public Health, Nudge.. David McDaid is Senior Research Fellow at LSE Health and Social Care and at
normative influence to reduce the consumption of hot drinks sold in to-go cups.. To that end, we
Concerning our control variables, Inflation rate and Reserves to Imports ratio increase sovereign borrowing costs, while S&P credit ratings, Gross debt to GDP ratio and the
S everal years ago, at the urging of some nonmedical friends, a small group of physicians and our spouses created a new board game called “Diagnosis.” Each player was a
2 Until a refrigerator-stable vaccine becomes available, however, varicella vac- cine will not be incorporated into the recommend- ed immunization schedule in Canada, as most
