Survey on the Economic Relations between
Aboriginal People and the
Businesses of Abitibi-Témiscamingue
By:
Anne Cazin
Augustin Ependa
Andréanne Sauvageau
December 2006
TABLE OF CONTENTS
SUMMARY ... 5
Introduction ... 6
Part One: Current Situation of the Region and the Aboriginal Communities ... 9
1. Portrait and Evolution of the Abitibi-Temiscamingue Economy... 9
2. Portrait of the Aboriginal Populations of Abitibi-Témiscamingue and Northern Québec ... 13
Young Nations that are also experiencing a heavy demographic growth... 13
Education Level ... 15
Labour Market... 17
Part Two: Analysis of the Results of the Survey Conducted among 110 Businesses of Abitibi-Témiscamingue ... 19
1. Sample Characteristics ...19
Sample Analysis... 19
2. Types of Economic Relations... 22
Presence of Aboriginal Employees ...22
Presence of Aboriginal Shareholders ...23
Existence of Business Relations with Aboriginals ... 24
3. Type of Aboriginal Clientele... 25
4. Characteristics of the Business Relations... 28
Duration of Business Relations with Aboriginals... 28
Appreciation of Business Relations ... 31
5. Business Partnerships ... 32
6. Appreciation of Business Relations... 35
Evolution of the Aboriginal Clientele ... 36
Perception of Business Relations with Aboriginals ... 37
Benefits Perceived...37
Problems Perceived... 38
7. Appreciation of SAENCAT ... 40
Conclusion ... 43
References ... 45
Methodological Appendix for the Survey Conducted Among the Businesses ... 48
CONSENT FORM ...50
List of Tables Part 1
Table 1 - Comparisons between Abitibi- Témiscamingue and the province of Québec based
on three economic indicators...10
Table 2.1 – Population of the Algonquin communities in the region according to place of residence, 2005 ... 14
Table 2.2 - Evolution of the Algonquin population of the region, 1991 to 2005 ...14
Table 2.3 – Population of the Cree and Inuit communities according to place of residence, 2005 ... 15
Table 2.4 – Data comparison of the Aboriginal population and the non-Aboriginal population of 15 years of age and over, according to the highest level of schooling attained, Abitibi-Témiscamingue and Northern Québec, 2001 in % ... 16
Table 2.5 - Data comparison of the Aboriginal population and the non-Aboriginal population of 15 years of age and over, according to labour market indicators, Abitibi-Témiscamingue and Northern Québec, 2001 ... 17
Table 2.6 – Data comparison of the Aboriginal population and the non-Aboriginal population of 15 years of age and over, according to income, Abitibi-Témiscamingue and Northern Québec, 2001... 18
Part 2 Table 1.1 – Location of the 110 businesses surveyed according to MRC... 19
Table 1.2 – Year when the 110 businesses surveyed were established... 20
Table 1.3 – Sector of activity of the 110 businesses surveyed ... 21
Table 1.4 – Number of employees of the 110 businesses surveyed ... 21
Table 2.1 – Presence of Aboriginal employees in the 110 businesses surveyed... 22
Table 2.2 – Number of Aboriginal employees in the 16 businesses surveyed having Aboriginal employees...22
Table 2.3 – Presence of Aboriginal shareholders in the 110 businesses surveyed... 24
Table 3.1 - Type of clientele of the 97 businesses surveyed having business relations with Aboriginals ... 25
Table 3.2 – Type of clientele by Nation of the 97 businesses having business relations with Aboriginals ... 26
Table 4.1 – Year when business relations were established between the sample businesses and the Aboriginals... 29
Table 4.2 – Proportion of sales attributable to the Aboriginal clientele for the 97 businesses having business relations with Aboriginals (%) ... 29
Table 4.3 – Average proportion of sales attributable to the Aboriginal clientele of the 97 businesses having business relations with Aboriginals according to MRC ...30
Table 4.4 – Opinions of the 97 businesses having business relations with Aboriginals with respect to the following statements ... 31
Table 4.5 – “The business has established an expansion strategy which targets
Aboriginals”, according to sector of activity...32 Table 5.1 – Establishment of partnerships with Aboriginals... 33 Table 5.2 – Proportion of sales attributable to the Aboriginal clientele of the 97 businesses having business relations with Aboriginals according to presence of partnerships (%) ... 34 Table 5.3 – Opinions of the 32 businesses having established a partnership with the
Aboriginals with respect to the following statements ...34 Table 5.4 – Opinions of the 97 businesses having business relations with Aboriginals with respect to the following statements ... 35 Table 6.1 – Opinions of the 97 businesses having business relations with Aboriginals in regards to the following statement: “The business maintains harmonious relations with Aboriginals” ... 36 Table 6.2 – Opinions of the 97 businesses having business relations with Aboriginals in regards to the views of their employees with respect to Aboriginals... 36 Table 6.3 - Opinions of the 97 businesses having business relations with Aboriginals in regards to the attitudes of their employees towards Aboriginals...36 Table 6.4 – Evolution of the Aboriginal clientele of the 97 businesses having business relations with Aboriginals ... 37 Table 7.1 – Knowledge of the SAENCAT by the 97 businesses having business relations with Aboriginals according to sector of activity ...42 Table 7.2 – Knowledge of the SAENCAT by the 97 businesses having business relations with Aboriginals according to MRC ...42 List of Figures
Figure 1 – Illustration of the relations between businesses and consumers ... 7 Figure 2.1 – Presence of Aboriginal employees in the 110 businesses surveyed according to sectors of activity... 23 Figure 2.2 – Distribution by sector of activity of the businesses surveyed that have or do not have business relations with Aboriginals ... 25 Figure 3.1 – Type of clientele by Nation of the 97 businesses having business relations with Aboriginals according to sector of activity...27 Figure 3.2 – Type of clientele by Nation of the 97 businesses having business relations with the Aboriginals according to MRC location... 28 Figure 4.1 – Proportion of sales attributable to the Aboriginal clientele of the 97 businesses having business relations with the Aboriginals according to location ... 30 Figure 5.1 – Presence of partnerships with Aboriginals for the 97 businesses having
business relations with Aboriginals, according to sector of activity ...33 Figure 7.1 – Knowledge of the SAENCAT by the 97 businesses having business relations with Aboriginals (%) ... 40 Figure 7.2 – Participation in the activities of the SAENCAT by the 97 businesses having business relations with Aboriginals...41
SUMMARY
The purpose of this study is to determine the importance and the nature of the economic relations between the off-reserve businesses of Abitibi-Temiscamingue and the Aboriginal people of the region and Northern Quebec. It was sponsored by the Secretariat to the Cree Nation/Abitibi-Témiscamingue Economic Alliance (SAENCAT) whose mandate is to foster closer economic links between the stakeholders of the region and the Cree nation. This study examined the contribution made by Aboriginal people to the businesses of the region in the areas of operations (contribution in terms of capital or employees) and market (share of the Aboriginal clientele in relation to the global market of the business). The study also endeavoured to describe how regional business people perceive their Aboriginal clientele. The data was collected during the summer of 2006 through a telephone survey conducted among one hundred or so businesses that have business links with Aboriginal people. It was completed by the use of statistical data in order that the survey results could be placed in a regional context.
Based on the results of the study, it appears that the contribution of the Aboriginal people is significantly weak in areas related to the labour and capital of regional businesses. On the other hand, Aboriginals contribute at a much higher level as clients of regional business establishments: The market share of regional businesses that do business with Aboriginals varies between five and fifteen percent depending on the MRC. The MRC of the
Vallée-de-l’Or has the largest concentration of businesses that deal with Aboriginals with market
shares superior to the other MRCs. The regional businesses feel that the Aboriginal clientele consolidates the current activity and that it also represents a potential for the future. The relations between the businesses and their Aboriginal clients or partners are considered as harmonious; nevertheless, there are certain difficulties and according to the regional business people, these difficulties are mainly due to a lack of mutual knowledge (between non-Aboriginals and Aboriginals).
Introduction
The Secretariat to the Cree Nation/Abitibi-Témiscaming Economic Alliance (SAENCAT, called the “Secretariat”) is a non-profit organization that was created in June 2002 by various development stakeholders of Abitibi-Temiscamingue and leaders from the Cree nation. It has the mandate of developing economic alliances between the Crees and the region of Abitibi-Temiscamingue in a spirit of mutual respect and cooperation in order to permit the harmonious development of the Cree nation and the region of Abitibi-Temiscamingue. The Secretariat is mainly composed of Crees (appointed by the Cree Regional Authority) and of representatives of the towns of Amos, Rouyn-Noranda and Val-d’Or.
In December 2005, the Secretariat to the Cree Nation/Abitibi-Temiscamingue Economic Alliance called upon the Laboratoire de recherche pour le soutien des communauté
(LARESCO) and the Chaire Desjardins en développement des petites collectivités to
conduct a study on the economic impacts of the Cree nation in Abitibi-Temiscamingue. After discussions with the Secretariat and Service Canada, a partner in the study, the
LARESCO submitted a study proposal, which was accepted. The study has the objective of
determining the importance and the nature of the economic relations between the off-reserve businessess of Abitibi-Témiscamingue and Northern Quebec (Cree, Algonquin and Inuit nations).
Since the James Bay Agreements of 1975, the presence of Cree people in Abitibi-Temiscamingue increased, especially in the towns of Val-d’Or and Amos. This presence was first reflected through the implementation of Cree administrative services and Cree businesses in Val-d’Or, then through the development of commercial exchanges between the companies of the region and organizations or individuals of the Cree nation. The creation of the Secretariat also resulted in increased exchanges and in a greater will on the part of the political leaders of Abitibi-Temiscamingue and the Cree nation to strengthen and harmonize these exchanges. However, the Secretariat does not have access to any quantitative data, which would enable it to estimate the volume of these exchanges. This creates a problematic situation for the Secretariat members who must have better knowledge of the current situation in order to establish their action strategy, for example, in identifying the economic sectors that would need particular support in order to promote exchanges with the Crees. The Cree representatives of the Secretariat also expressed, since its creation in 2002, the desire to measure the contribution of the Cree people in the regional economy. Furthermore, the political leaders of the concerced towns are also at a loss when questioned by media, businesses or citizens because of the lack of documentation on the subject.
The phenomenon of increased exchanges between the Aboriginal people and the region of Abitibi-Temiscamingue is not uniquely restricted to economic exchanges or to the Cree nation. In fact, exchanges between the Crees and the region also involve the areas of health services, education and recreation. In addition, the Algonquins who originate from
Algonquin communities of the region and beyond (Rapid Lake and Maniwaki) are, seemingly, much more present than in the past in the urban centres of the region and they also benefit from the many available urban services. The phenomenon of the presence of Algonquins in the urban area of our region is certainly even less documented than it is for the Crees since the services they require are not part of an agreement and the commercial exchanges take place on a daily basis, making them less visible than the exchanges with the Crees which occur during certain periods of the year (tournaments held in the region) or in remote communities. We believe that this situation of unawareness causes a certain frustration among the Algonquins who feel “left out” and who wish to have their contribution to the regional economy recognized.
Therefore, we opted for a more comprehensive study than the one that was initially requested. Our current proposal aims at measuring the economic and social impacts of the presence of Aboriginal populations (notably Cree and Algonquin) in Abitibi-Temiscamingue today.
Our research is organized on the basis of three questions: The key question is the following: What contribution do Aboriginal people make to the regional economy in Abitibi-Témiscamingue? The economic contribution of a people in regards to the economy must be analyzed according to the nature of this contribution (see Figure 1).
Figure 1 – Illustration of the relations between businesses and consumers
Source: Anne Cazin, according to Lovewell, 2005.
Aboriginal consumers could be households or businesses or public organizations such as band councils or regional administrative bodies. The study will attempt to measure the portion of consumption of each of these entities in relation to the regional global
Businesses Consumers Economic Resources -Labour -Capital -Natural Resources Revenues Consumer Spending Sale of Goods and Services
consumption, in other words, the proportion of sales of regional goods and services consumed by Aboriginal economic agents.
The second type of economic contribution consists of contribution in terms of Aboriginal economic resources (natural resources, capital and labour) to regional businesses. This would consist of measuring the share of Aboriginal resources within the regional resources as a whole, in relation to business capital as well as the exploitation of natural resources of their territory and to Aboriginal labour within the businesses.
This first series of questions will thus permit to measure the contribution of the Aboriginal population in the region (with the exception of Indian reserves).
Our second question pertains to the impacts of economic transactions between Aboriginal and non-Aboriginal people on the social relations between the two groups. Do the economic exchanges have an influence on the quality of their relations? In other words, what are the human and social impacts of these economic relations?
Our third question aims at identifying the influence of these economic exchanges with respect to the global evolution of the region. Does the intensification of these economic exchanges with Aboriginal people have an impact on the regional economy? Since when has there been an impact? Finally, does the region of Abitibi-Temiscamingue function in a singular fashion, being more of a pole of attraction for more northern regions and for Aborigal people spread over a vast territory rather than a “peripheral region or resource” as it has been classified up to now by ecnomists and developers?
The first part of this report describes the situation of the region and the Aboriginal communities, and the second part presents the detailed analysis of the results of the survey conducted among the businesses of the region.
Part One:
Current Situation of the Region and the
Aboriginal Communities
This section of the report summarizes both the regional economic evolution and demographic and ecnomic evolution of the Aboriginal communities. These elements provide a better understanding of the place that Aboriginals hold in our region.
1. Portrait and Evolution of the Abitibi-Temiscamingue Economy
Abitibi-Temiscamingue is considered as part of the outlying or remote areas of the province of Quebec (Chenard, Polèse and Shearmur, 2005). These regions have several common characteristics. Notably, since the 1996 census they are experiencing a demographic decrease while the overall Quebec population is increasing. In addition, their economy mostly rests on the exploitation of natural resources. This dependancy can be problematic since, according to Chenard, Polèse and Shearmur (2005), this sector is at the end of its growth cycle. In Abitibi-Témiscamingue, the primary sector is four times more important as it is globally for the province. The remoteness of urban centres also characterizes these regions and creates problems with respect to transportation costs. As for the tertiary sector, it is generally less present than in the remote regions. However, Abitibi-Témiscamingue is in a better position than other remote regions in regards to this question.As Abitibi-Témiscamingue does not depend on one resource only, the region is rarely positioned at the extremes of the economic indicators in comparison to the other said
remote regions. Thus, the region is composed of mining, forestry and farming towns. In
addition, the strong presence of the service sector reduces this dependency. For example, Rouyn-Noranda does not rely only on mining but also on public services, which are of significant importance.
In regards to the demography of the region, the population is declining. According to the
Observatoire de l’Abitibi-Témiscamingue, in 2005, the total population of the region was
145,097 persons. In 2001, according to Statistics Canada, it was of 153,905. The most populated MRC is that of the Vallée-de-l’Or (42,866) followed by the MRC of Rouyn-Noranda (39,507). The natural growth rate remains positive, meaning, that there is a higher number of births than deaths, however, it is not sufficient to compensate for the negative net migration. It is also noted that the out-migration rate of the youth is lower than in other regions while that of senior citizens is higher. Thus, it is possible to conclude that Abitibi-Temiscamingue is a region where people come to work but it is not a region where they necessarily retire. The Institut de la statistique du Québec (ISQ) predicts that the demographic decline will continue. From 2006 to 2026, the population should decrease by 12.9%. For the economy, this decline will cause the size of the domestic market to shrink and will also result in difficulties in recruiting skilled labour.
Certain socio-economic indicators allow a better picture of the Abitibi-Témiscamingue population. The under-education rate (41%) is higher than for the overall rate of the province (30%).
As clearly illustrated in Table 1, the labour market is characterized by a higher unemployment rate and an average income, which is lower than the overall provincial rate. These differences between Abitibi-Témiscamingue and the province of Québec do not only apply to the current situation. In fact, they also existed in the past. The average income is generally lower in Abitibi-Témiscamingue. This trend is also confirmed by a transfer payment per inhabitant, which is more significant in the region ($4,722 in 2004) than for Québec ($4,194 in 2004). As for the participation rate, it is higher on the provincial scale than on the regional scale. Finally, personal bankruptcies tend to increase, which according to Collini (2005) could be explained by the vulnerability of the mining and forestry industries.
Table 1 – Comparisons between Abitibi- Témiscamingue and the province of Québec based on three economic indicators
Sources: Collini, 2005, Couture,et al. 2006.
The economic structure of Abitibi-Témiscamingue, according to the various reports published since 1971, remains dependant on natural resources, even if it is more and more diversified. Thus, the economy rests on two key pillars, which are the mining industry and the forestry industry. Agriculture is sometimes identified as being an economic pillar while it represents less than two per cent of the total regional employment. Furthermore, the regional economy is sensitive to international conditions such as the strength of the Canadian dollar and the value of the various resources (gold and other metals, lumber). In 2005, there were 65,700 jobs in Abitibi-Témiscamingue. In the past ten years, the employment peak was reached in 2000 with 65,900 jobs.
The mining industry was always important in Abitibi-Témiscamingue, but it frequently raised concerns. The planning mission of Northwestern Québec in 1971, in the Esquisse du
Plan régional (Outline of the Regional Plan) predicted “upcoming disappearance of the
gold industry, exhaustion of base metal deposits (copper and zinc) in the Noranda – Val-d’Or sectors, shift towards the North of new discoveries”. In fact, mines opened further north, but the gold industry did not disappear. However, the industry experienced a number of jolts over the years as in 1997 where it began a lag, which lasted up until recently. Since 2003, mining exploration is growing and since 2004, the price of gold and other metals is
Unemployment Rate Activity Rate Average Income ($)
Abitibi-Témiscamingue Québec Abitibi-Témiscamingue Québec Abitibi-Témiscamingue Québec 2005 9,2% 8,2% 2005 61,9% 65,5% 2003 23 603 27 595 1990 13,2% 10,1% 1990 60,4% 64,3% 1990 21 348 22 499
increasing. Thus in 2004, the mining industry totaled 4,500 jobs representing 7% of the total regional employment. In comparison, in 1987, it represented 9% of employment.
As for the forestry industry, it is also preponderant in the regional economy. Forestry exploitation represents 5% of the total regional employment. However, if the primary and secondary wood transformations sectors are added, the employment proportion increases to 11%. This industry is also very sensitive to international fluctuations. In 1978, forestry exploitation experienced a heavy growth due to the favourable price of lumber and to the devaluation of the Canadian dollar. On the other hand, in 1987, the Office de planification
et de développement du Québec stated that despite the increase of reforestration programs,
this was not sufficient. Today, the forestry industry is experiencing a crisis and is affected by several factors such as the recent Canada-U.S. softwood lumber dispute and the low value of lumber on the international market.
The manufacturing industry and the construction industry regrouped in 2004, 8,700 jobs which represents 13% of Abitibi-Témiscamingue employment while at the provincial level, the proportion of these sectors is higher with 22%.
According to Collini (2005), the manufacturing sector employs 9% of the regional labour. This sector is highly dependant on the exploitation of natural resources. Thus, manufacturing related to natural resources encompasses 30.1% of businesses for 76.4% of the manufacturing jobs. In comparison, the manufacturing of consumption products corresponds to 46.2% of businesses for 14.7% of the jobs. This dependency does not date back to yesterday. In a 1992 report, Tremblay, Blanchette and Carrier emphasized that this sector closely depends on natural resources. Along these same lines, a large part (80%) of manufacturing employment is situated in the primary transformation. Thus the added value represents only 30% of manufacturing exportations while in the province of Québec this rate is 42%. The majority of businesses manufacturing value-added products are SMBs. With 4% of employment in 2004, the construction industry is also an effective indicator of the regional economy, since its dynamism frequently reflects the economic situation. In 2003, the construction industry experienced one of its best years since 1993. In spite of this progress, this sector greatly fluctuated during the past ten years. Industrial and commercial construction is equivalent to 45% of the total construction volume. In Val-d’Or, residential construction is increasing which results from a certain confidence in employment, a good mortgage rate and low vacancy rate. In addition, the value of single-family homes is increasing in the region, but remains lower than at the provincial level.
In regards to the service sector of the economy, Abitibi-Témiscamingue follows the same trend as the province of Québec. In 1978, the service sector represented 58% of regional employment. In 1988, this proportion shifted to 62% while today it is situated at 71.5%. However, the region lags behind the provincial rate, which is 75% of the total provincial employment. The service sector is accompanied by certain instability in employment. The jobs of this sector are less lucrative. Due to this fact, the buying power of consumers is reduced. It is possible to divide the services into three categories, goods production services
at 22%, consumption services at 39% and governmental services at 38%. The most lucrative jobs are mainly situated in goods production services and governmental services. In 1978, the government of Canada observed that the crossroads geographical location of Val-d’Or consequently had more distribution services while Rouyn-Noranda regrouped more services to businesses. In 2005, Chenard, Polèse and Shearmur maintained that Val-d’Or was a service point for the James Bay and the Cree communities while Rouyn-Noranda had more public services.
Finally, the economy of the region is also influenced by the activities of the North. Whether it is due to the mines that are opening in Northern Québec or the hydroelectric work in James Bay, the region was always interested in these activities. In 1978, the government of Canada, in an economic report on the region, mentioned that 15% of the 15,000 workers of James Bay originated from Abitibi-Témiscamingue and that 10% of the total value of purchases by the Société d’énergie de la Baie-James (SEBJ) was effectuated in the region. In 1992, Tremblay, Blanchette and Carrier wrote “the James Bay work sites represented in the eyes of the regional economic stakeholders an alternative solution to the economic hardships observed in Abitibi-Témiscamingue for some time”. Finally, in the
Bilan du Plan stratégique 1999-2003, the CRDAT (2004) stated, “the economic boundaries
of the region began to spread towards Northern Quebec”. This document confirmed the trend of the region in having increased interest in the North.
Thus, the economy of the region, even if it evolved within the past thirty years, did not transform. It still rests significantly on natural resources, forest and metals. It therefore remains sensitive to international economic conditions. Despite the diversification, which is progressively emerging, the manufacturing sector is mostly concentrated on primary and secondary transformation and, in general, manufactured products are not value-added. This is why various authors recommend a greater diversification of economic activity. Chenard, Polèse and Shearmur (2005) nonetheless emphasize that the fate of the Témiscamingue economy will always be linked to natural resources. Furthermore, Abitibi-Témiscamingue, due to the presence of more than one type of industry linked to natural resources, will not be situated at the extemes of the economic indicators. In addition, the demographic decline and the under-education problems make the recrutment and retention of skilled labour difficult.
The economic analysis and reports, which were consulted at times, refer to the links that Abitibi-Témiscamingue maintains with Northern Québec but solely in relation to the economic spin-offs of the various James Bay hydroelectric projects or in relation to the development of mining projects. With the exception of a few authors and institutions (Blanchette 2005, CRE 1999 and 2004) that provide an overview of the social and economic exchanges that the region maintains with the Aboriginal populations of the North, very few documents mention the Aboriginal populations or institutions as participating in the Abitibi-Témiscamingue economy.
Yet, geographical, historical and economic links bind the two regions. The James Bay Agreements and the recent Paix des Braves Agreement resulted in major changes in the Cree and Inuit societies, which certainly have an impact on Abitibi-Témiscamingue.
2. Portrait of the Aboriginal Populations of Abitibi-Témiscamingue
and Northern Québec
The socio-economic portrait of the Aboriginal populations of Abitibi-Témiscamingue and Northern Québec will permit us to describe the current situation and the interactions that exist between the Aboriginal people and the regional institutions.
Young Nations that are also experiencing a heavy demographic growth
Two Aboriginal nations are present in Abitibi-Temiscamingue: the Algonquins of which seven communities are situated in the region and two in the Outaouais region and the Crees of which nine communities are situated in Northern Québec but for whom some of the towns of Abitibi-Témiscamingue are the nearest urban centres. Some Attikamek and Inuit persons reside in the region but in fewer numbers.
In 2005, the Algonquins in the province of Québec had a population count of 9,278 according to INAC of which 6,011 originated from the seven communities situated in Abitibi-Témiscamingue, representing 4% of the total regional population. Half of the Algonquin population live on reserves or settlements1. The other half does not necessarily live in urban areas but frequently in the immediate proximity of reserves because of the lack of housing on the reserves. This situation is particularly obvious for the four communities of Témiscamingue. However, such is not the case for Kitcisakik and Lac Simon situated in the Eastern part of the region, close to Val-d’Or, whose population represents more than 80% of the total registered population of the communities. The Algonquins have recorded a demographic growth of 46% between 1991 and 2005, and is however, undergoing a slowing trend. This demographic growth resulted in a younger population: in 2001, more than one on two Algonquins was less than 30 years of age in the region (Germain, 2005).
1
Reserve: territory that the Federal government set aside for the use and benefit of an Aboriginal group or band. (Germain, 2005)
Settlement: territory that does not have the status of a reserve and which was not officially set aside for the use of the community. (Ibid)
Table 2.1 – Population of the Algonquin communities in the region according to place of residence, 2005
Community Total Residing on reserve %
Eagle Village-Kipawa (r) 697 263 37,7 Hunter’s Point (s) 274 13 4,7 Kitcisakik (s) 397 339 85,4 Lac-Simon (r) 1532 1239 80,9 Pikogan (r) 836 554 66,3 Timiskaming (r) 1584 584 36,9 Winneway (s) 691 352 50,9 Total 6011 3344 55,6
(r): reserve; (s): settlement établissement. Source: INAC, Indian Register 2005
Table 2.2 - Evolution of the Algonquin population of the region, 1991 to 2005
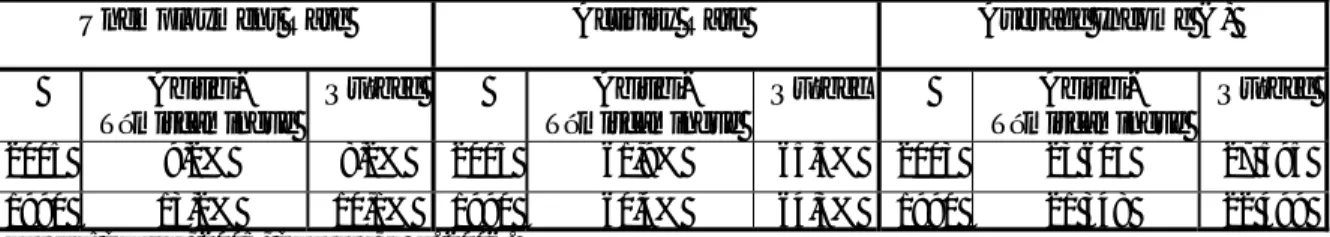
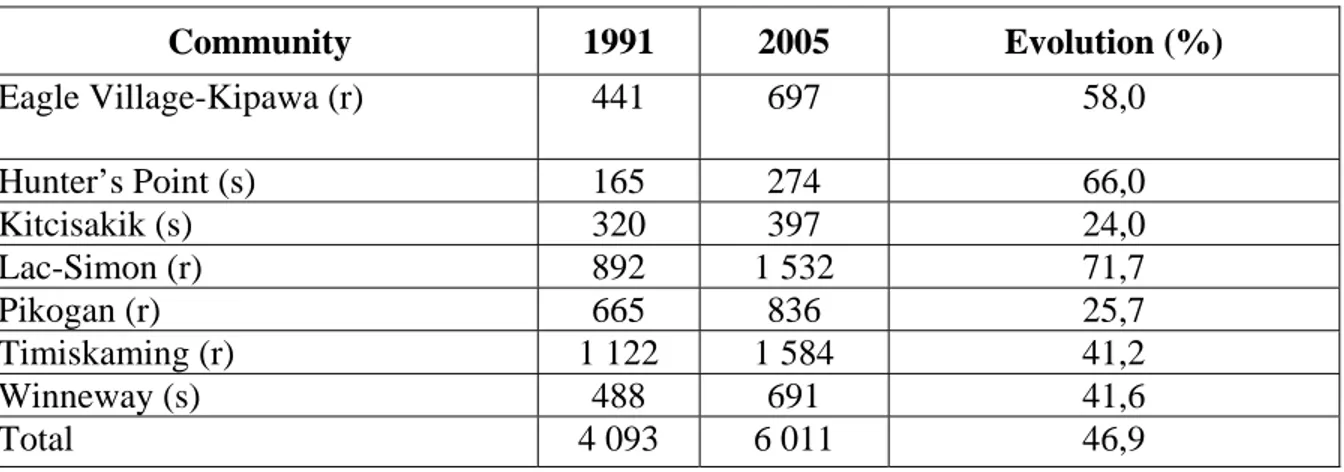
Community 1991 2005 Evolution (%) Eagle Village-Kipawa (r) 441 697 58,0 Hunter’s Point (s) 165 274 66,0 Kitcisakik (s) 320 397 24,0 Lac-Simon (r) 892 1 532 71,7 Pikogan (r) 665 836 25,7 Timiskaming (r) 1 122 1 584 41,2 Winneway (s) 488 691 41,6 Total 4 093 6 011 46,9 (r): reserve; (s): settlement.
Sources: Census 1991, INAC, Indian Register 2005
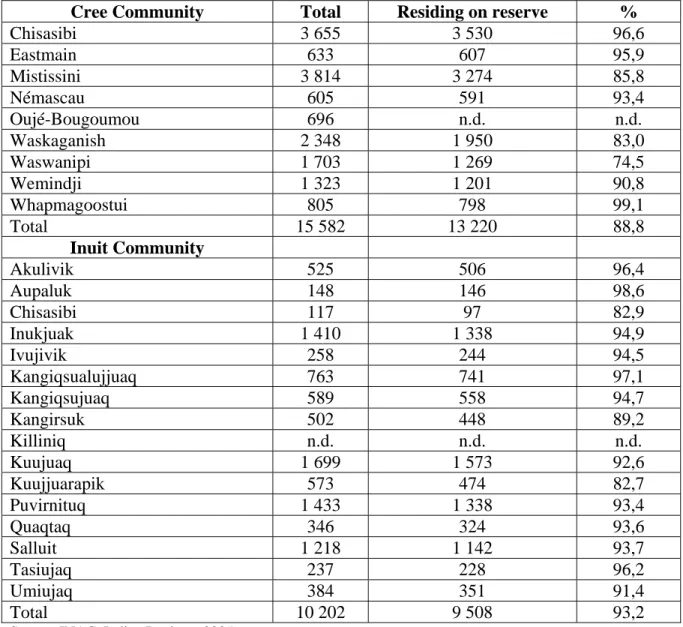
According to INAC, the population count of the Cree Nation was 15,582 in 2005; spread over nine communities situated in Northern Québec. A large majority of Crees (88.8%) and Inuit (93.2%) reside on reserve. Like the Algonquin population, the Cree and Inuit populations are very young: persons under the age of 15 represent 38% of the total population and the median age is 21.
Table 2.3 – Population of the Cree and Inuit communities according to place of residence, 2005
Cree Community Total Residing on reserve %
Chisasibi 3 655 3 530 96,6 Eastmain 633 607 95,9 Mistissini 3 814 3 274 85,8 Némascau 605 591 93,4 Oujé-Bougoumou 696 n.d. n.d. Waskaganish 2 348 1 950 83,0 Waswanipi 1 703 1 269 74,5 Wemindji 1 323 1 201 90,8 Whapmagoostui 805 798 99,1 Total 15 582 13 220 88,8 Inuit Community Akulivik 525 506 96,4 Aupaluk 148 146 98,6 Chisasibi 117 97 82,9 Inukjuak 1 410 1 338 94,9 Ivujivik 258 244 94,5 Kangiqsualujjuaq 763 741 97,1 Kangiqsujuaq 589 558 94,7 Kangirsuk 502 448 89,2 Killiniq n.d. n.d. n.d. Kuujuaq 1 699 1 573 92,6 Kuujjuarapik 573 474 82,7 Puvirnituq 1 433 1 338 93,4 Quaqtaq 346 324 93,6 Salluit 1 218 1 142 93,7 Tasiujaq 237 228 96,2 Umiujaq 384 351 91,4 Total 10 202 9 508 93,2
Source: INAC. Indian Register, 2005
Note for Oujé-Bougoumou: Approximative data from Census 2001
Education Level
The education gaps between Aboriginals and non-Aboriginals are quite significant and apply to all levels of education. The under-education rates2 of the Aboriginals of Abitibi-Témiscamingue (62.2%) and of Northern Québec (66.0%) are higher than the overall rate of the province of Québec (51.6%) and represents twice the rate recorded for the non-Aboriginal population of the province (31.6%).
2
Table 2.4 – Data comparison of the Aboriginal population and the non-Aboriginal population of 15 years of age and over, according to the highest level of schooling attained, Abitibi-Témiscamingue and Northern Québec, 2001 in %
Abitibi- Témiscamingue (%) Northern Québec (%) Québec (%) Non-Aboriginal Population
Secondary without a diploma 41.8 34,6 31,5
Secondary with a general diploma Secondary with a vocational diploma
16,1 5,8 16,0 5,8 17,2 4,6
College without a diploma 6,3 6,1 7,0
College with a diploma or certificate 15,8 18,4 16,9 University without a baccalaureate 6,0 6,1 8,7 University with a baccalaureate or higher
degree
8,1 12,8 14,0
Aboriginal Population
Secondary without a diploma 62,2 66,0 51,6
Secondary with a general diploma Secondary with a vocational diploma
8,3 4,7 6,3 5,6 11,2 4,9
College without a diploma 7,2 8,3 8,0
College without a diploma or certificate 11,7 9,6 13,2 University without a baccalaureate 4,3 2,6 6,3 University with a baccalaureate or higher
degree
1,7 1,4 4,7
Source: Statistics Canada. Census 2001
The low education levels of the Aboriginal people in the region are to be linked to the numerous social problems experienced by the Aboriginal youth. According to the Aboriginal youth, youth drop out of school because of a lack of motivation and to be able to collect social assistance and to live without any goals until they become aware of the situation when they are 25 years of age or so. These youth are without employment in the community and the only solution consists of returning to school through adult education3. In comparing the data of Aboriginals to those of non-Aboriginals at the regional level, it is observed that in regards to college studies (with or without a diploma) and university studies without a baccaluareate (obtention of a certificate or non obtenion of a diploma), the rates recorded for Aboriginals are approximately the same as for non-Aboriginals. This information confirms the observations of the Université du Québec en
Abitibi-Témiscamingue (UQAT): Aboriginal students have a tendancy of following short-term
university programs (nine-month program certificate) which permits them to return to their
3
This information was obtained from heads and social workers of Aboriginal organizations who were interviewed in summer 2006.
community within a short period of time, with training that is recognized by their employers. Certain individuals commit themselves to longer studies in order to obtain a baccalaureate.
Labour Market
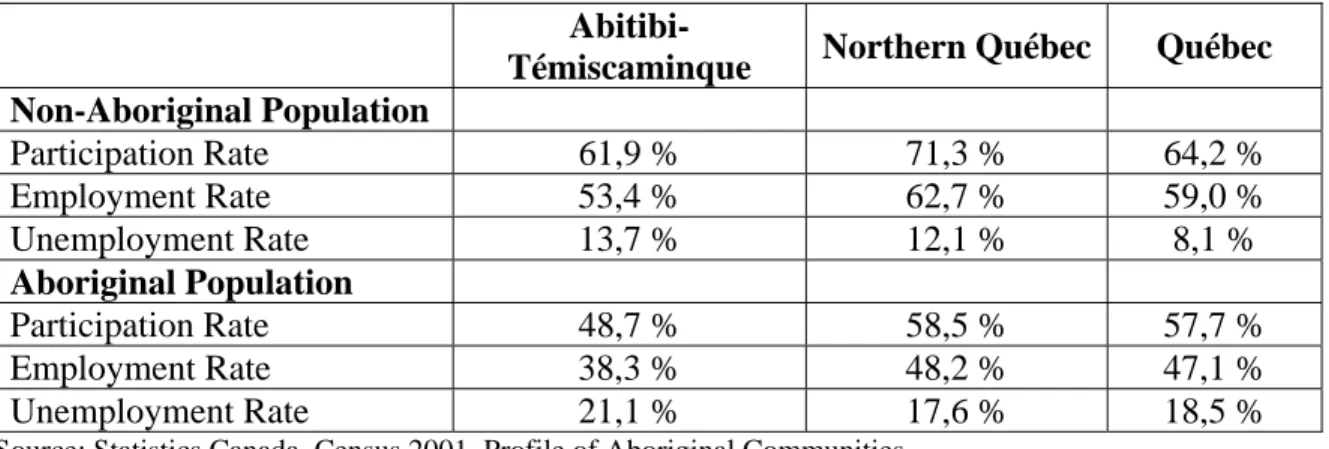
Labour market indicators reflect a difficult situation for the Aboriginal people of Northern Québec and even more so for those of Abitibi-Témiscamingue. The participation rates and employment rates of Aboriginals in Abitibi-Témiscamingue are inferior by ten percent to those recorded by the Aboriginals of Northern Québec and are well below the rates pertaining to the overall rates of the Aboriginals of the province. The situation of Aboriginals in Northern Québec is somewhat more positive than the Aboriginal of Québec in general. In fact, in Abitibi-Témiscamingue slightly more than one of three Aboriginals4 holds a job while in Northern Québec close to one of two Aboriginals hold a job.
Table 2.5 – Data comparison of the Aboriginal population and the non-Aboriginal population of 15 years of age and over, according to labour market indicators, Abitibi-Témiscamingue and Northern Québec, 2001
Abitibi-Témiscaminque Northern Québec Québec Non-Aboriginal Population Participation Rate 61,9 % 71,3 % 64,2 % Employment Rate 53,4 % 62,7 % 59,0 % Unemployment Rate 13,7 % 12,1 % 8,1 % Aboriginal Population Participation Rate 48,7 % 58,5 % 57,7 % Employment Rate 38,3 % 48,2 % 47,1 % Unemployment Rate 21,1 % 17,6 % 18,5 %
Source: Statistics Canada. Census 2001. Profile of Aboriginal Communities.
The analysis of employment pertaining to Aboriginals according to activity sector reveals a strong representation in public administration, healthcare and social services, teaching, manufacturing, construction and natural resources (forestry, hunting and fishing) and near exclusion in the management of companies and businesses, finances, insurance, information and culture (Blanchette 2005). The commerce sectors (wholesaling and retailing) employ very few Aboriginals. The various reports on the Aboriginal labour situation in the region and in Northern Quebec explain that the significant number of jobs provided by band councils is due to the many fields of responsibility that they assume (Blanchette 2005, Blanchette and Drolet 2000, Blanchard 1995).
Other employment opportunities on the reserves are frequently situated in the construction and forestry sectors. Band councils in most cases, manage the businesses of these sectors
4
but a few are managed by private Aboriginal entrepreneurs. Partnerships exist mainly in the forestry sector between Aboriginal slashing companies and large companies such as Domtar or Abitibi-Consolidated. In Waswanipi, the Nabakatuk Sawmill, which is a joint venture between the Mishtuk Corporation (Cree business) and Domtar, employs 40 Aboriginal persons.
The tourism sector is now present in all the Cree communities, there is a count of approximately one hotel and at least one outfitter per community while the situation is clearly different in the Algonquin communities, which have practically no tourism infrastructures. In fact, only the community of Pikogan offers an adventure tourism service.
Few Aboriginals hold jobs off-reserve. In Northern Québec, Aboriginals show a certain disinterest in off-reserve employment because of financial disadvantages (income taxes and consumption taxes for workers) (Blanchette and Drolet 2000). In Abitibi-Témiscamingue, the Aboriginals who work off-reserve hold administrative jobs in Aboriginal organizations, such as the Native Friendship Centre or the Cree Health Board in Val-d’Or. Tembec in Temiscamingue is an exception where numerous Aboriginals are hired (Blanchette 2001). Table 2.6 illustrates that Aboriginal people have average incomes, which are distinctly inferior to those of the non-Aboriginals. This information is to be associated with the low levels of education and the types of employment.
Table 2.6 – Data comparison of the Aboriginal population and the non-Aboriginal population of 15 years of age and over, according to income, Abitibi-Témiscamingue and Northern Québec, 2001
Abitibi-Témiscaminque Northern Québec Québec Non-Aboriginal Population
Average employment income 28 847 $ 33 502 $ 29 999$ Aboriginal Population
Average employment income 21 506 $ 19 959 $ 21 725$
Source: Statistics Canada. Census 2001. Profile of Aboriginal Communities
The Aboriginal populations of Abitibi-Témiscamingue and Northern Québec have common characteristics in regards to the demographic dynamism, to the youth population and to the low level of schooling. On the other hand, they illustrate strong differences in regards to the labour market indicators: the economic situation of Algonquins of Abitibi-Témiscamingue is much more difficult than the Aboriginals of Northern Québec for whom the indicators reflect approximately the same situation as the Aboriginal population of the province. Finally, from a regional point of view, the economic indicators reflect a situation which is much more difficult for Aboriginals than for non-Aboriginals.
A closer analysis of the types of activities practiced in the reserves shows us that in several areas such as forestry and tourism, the Aboriginal communities are nonetheless integrated in the global economy through partnerships with large businesses or through tourists.
Part Two:
Analysis of the Results of the Survey Conducted
among 110 Businesses of Abitibi-Témiscamingue
This second part of the report constitutes an essential element of our study. It is the first time in Abitibi-Témiscamingue that there is an attempt to quantify and qualify the contribution of Aboriginals in the regional economy by a direct survey among the businesses. After a description of the sample characteristics, we will analyze the nature of the economic exchanges in detail, their magnitude and their impact on the relations between Aboriginals and regional businesses.
1. Sample Characteristics
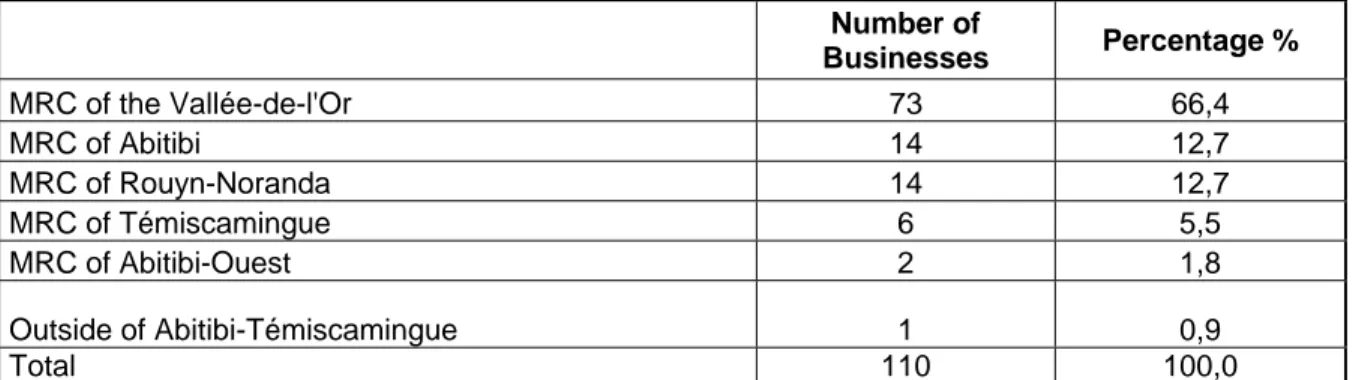
Sample AnalysisBased on the location of the businesses (Table 1.1), the sample shows a very strong representation of businesses within the MRC of the Vallée-de-l’Or: more than six out of ten businesses are located in the area. The MRCs of Rouyn-Noranda and of Abitibi are equally represented with 13% of the sample. The MRC of Témiscamingue represents 5% of the sample and that of Abitibi-Ouest, 2%. One sole business is situated outside the territory: it is a business that is situated in the MRC of the Vallée-de-l’Or but whose head office is located in a Cree community.
Table 1.1 – Location of the 110 businesses surveyed according to MRC
Number of Businesses Percentage % MRC of the Vallée-de-l'Or 73 66,4 MRC of Abitibi 14 12,7 MRC of Rouyn-Noranda 14 12,7 MRC of Témiscamingue 6 5,5 MRC of Abitibi-Ouest 2 1,8 Outside of Abitibi-Témiscamingue 1 0,9 Total 110 100,0
Source: LARESCO/Chaire Desjardins, Survey on the Economic Relations between the Aboriginal People and
the Businesses of Abitibi-Témiscamingue, 2006.
The overrepresentation of the MRC of the Vallée-de-l’Or is explained by our method of selecting the businesses: the businesses identified as having exchanges with Aboriginals are mainly situated in Val-d’Or, and they appear in larger numbers in the Secretariat file. In
addition, the rate of response from businesses of the Vallée-de-l’Or was superior to the businesses situated in other MRCs. It could be assumed that the interest in the survey demonstrated by those in charge of businesses was linked to the magnitude of the economic relations of these businesses with Aboriginals.
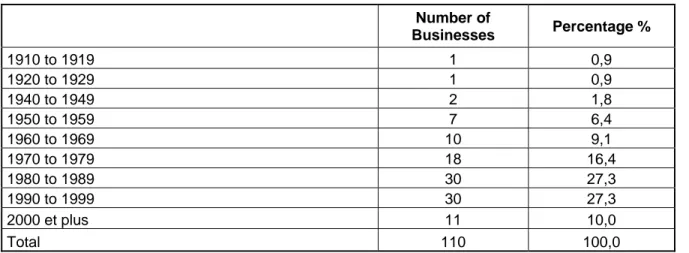
In regards to the year that the businesses were established (Table 1.2), it is observed that all the businesses surveyed are relatively young. In fact, 64% of the businesses have been in existence for less than 25 years.
Table 1.2 – Year when the 110 businesses surveyed were established
Number of Businesses Percentage % 1910 to 1919 1 0,9 1920 to 1929 1 0,9 1940 to 1949 2 1,8 1950 to 1959 7 6,4 1960 to 1969 10 9,1 1970 to 1979 18 16,4 1980 to 1989 30 27,3 1990 to 1999 30 27,3 2000 et plus 11 10,0 Total 110 100,0
Source: LARESCO/Chaire Desjardins, Survey on the Economic Relations between the Aboriginal People and
the Businesses of Abitibi-Témiscamingue, 2006.
Several elements distinguish the distribution of businesses according to sector of activity (Table 1.3) from the distribution of regional economic activities: public services (teaching, healthcare, social assistance; public administration) and the sector of information, culture and recreation do not appear in the sample; on the other hand, the sectors of wholesale and retail trade and accommodation and food services are overrepresented with respect to their actual weight in the regional economy.
Table 1.3 – Sector of activity of the 110 businesses surveyed
Number of
Businesses Percentage %
Agriculture, forestry, fishing and hunting 3 2,7
Mining and oil and petroleum extraction 5 4,5
Construction 8 7,3
Manufacturing 8 7,3
Wholesale trade 13 11,8
Retail trade 31 28,2
Transportation and storage 5 4,5
Finance and insurance 6 5,5
Professional, scientific and technical services 13 11,8
Administrative and support, waste management and
remediation services 4 3,6
Accommodation and food services 11 10,0
Others 3 2,7
Total 110 100,0
Source: LARESCO/Chaire Desjardins, Survey on the Economic Relations between the Aboriginal People and
the Businesses of Abitibi-Temiscamingue, 2006.
A closer analysis of the types of commerces surveyed reveals that the sectors of consumer products (food, clothing) and auto sales or other motorized vehicule sales is overrepresented in the survey sample in relation to the remaining commerces (data not illustrated).
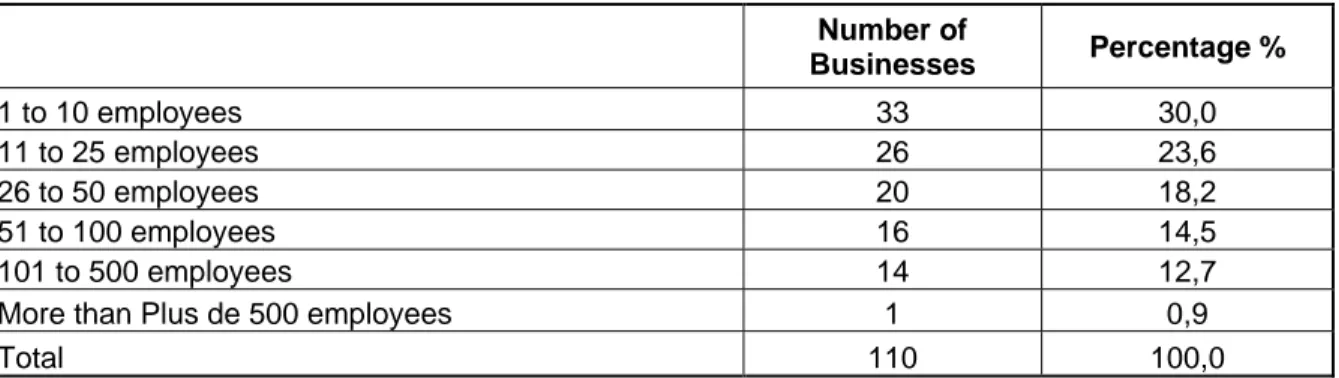
The distribution of the businesses surveyed according to the number of employees reveals that there is a slight overrepresentation of small businesses (categories from 1 to 10 and from 11 to 25 employees) in relation to the actual distribution of the regional businesses (Table 1.4).
Table 1.4 – Number of employees of the 110 businesses surveyed
Number of Businesses Percentage % 1 to 10 employees 33 30,0 11 to 25 employees 26 23,6 26 to 50 employees 20 18,2 51 to 100 employees 16 14,5 101 to 500 employees 14 12,7
More than Plus de 500 employees 1 0,9
Total 110 100,0
Source: LARESCO/Chaire Desjardins, Survey on the Economic Relations between the Aboriginal People and
the Businesses of Abitibi-Témiscamingue, 2006.
The analysis of the sample characteristics permit to conclude that our sample is not entirely representative of the overall regional economy because it overrepresents one MRC and does not take the public sector into consideration. Nevertheless, the large sectors of private
economic activity are represented and are illustrated in proportions, which are relatively comparable to those of the regional economy.
2. Types of Economic Relations
We agreed that a business had economic relations with Aboriginals if they met with at least one of the following criteria:
- Presence of Aboriginal employees; - Presence of Aboriginal shareholders;
- Existence of business relations with Aboriginals. Presence of Aboriginal Employees
Aboriginal employees are present in only 16 of the businesses surveyed and in very limited numbers (Table 2.1 and 2.2). The two businesses with respectively 72 and 100 Aboriginal employees explained to us that virtually all these jobs were situated in the North, in Cree communities. Thus, it could be stated that economic exchanges between the private businesses of the region and Aboriginals do not take place at the level of employment. Table 2.1 – Presence of Aboriginal employees in the 110 businesses surveyed
Number of
Businesses Percentage %
Presence of Aboriginal employees 16 14,5
No Aboriginal employees 94 85,5
Total 110 100,0
Source: LARESCO/Chaire Desjardins, Survey on the Economic Relations between the Aboriginal People and
the Businesses of Abitibi-Témiscamingue, 2006.
Table 2.2 – Number of Aboriginal employees in the 16 businesses surveyed having Aboriginal employees
Number of Aboriginal Employees Number of
Businesses
Less than 5 13
5 to 10 1
10 and more 2
Total businesses 16
Source: LARESCO/Chaire Desjardins, Survey on the Economic Relations between the Aboriginal People and
the Businesses of Abitibi-Témiscamingue, 2006.
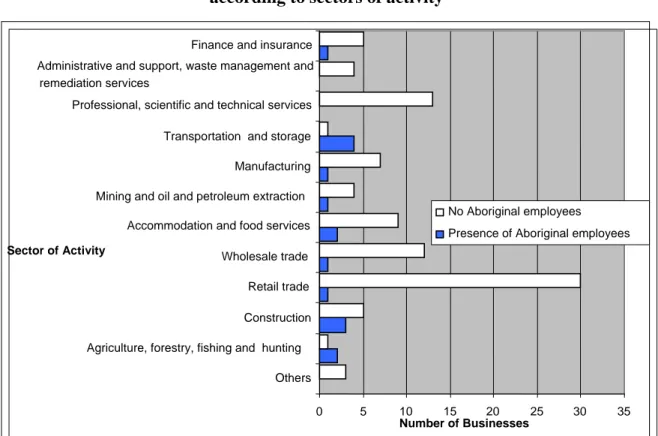
The analysis of the presence of Aboriginal employees according to sectors of activity (Figure 2.1) clearly depicts the sectors of transportation, construction and forestry and this confirms the analysis conducted by Blanchette and Drolet (2000). It is however interesting
to mention that in several other sectors such as manufacturing, accommodation and food services and wholesale and retail trade, one or two businesses count Aboriginal employees. Our survey confirms the fact that Aboriginals are rarely present in the private sector of the labour market with the exception of a few sectors such as forestry, transportation and construction but it perhaps reveals a mild emergence of new employment sectors in the area of services.
Figure 2.1 – Presence of Aboriginal employees in the 110 businesses surveyed according to sectors of activity
Source: LARESCO/Chaire Desjardins, Survey on the Economic Relations between the Aboriginal People
and the Businesses of Abitibi-Témiscamingue, 2006.
Presence of Aboriginal Shareholders
In regards to shareholding, only three businesses of the sample stated that they actually have Aboriginal shareholders (Table 2.3): they consist, in fact, of three Aboriginal businesses established in the MRC of the Vallée-de-l’Or. However, three other businesses considered that they have Aboriginal shareholders: one financial institution and two publicly traded corporations.
0 5 10 15 20 25 30 35 Others
Agriculture, forestry, fishing and hunting Construction Retail trade
Wholesale trade Accommodation and food services Mining and oil and petroleum extraction
Manufacturing Transportation and storage Professional, scientific and technical services Administrative and support, waste management and
remediation services
Finance and insurance
Sector of Activity
Number of Businesses
No Aboriginal employees Presence of Aboriginal employees
Table 2.3 – Presence of Aboriginal shareholders in the 110 businesses surveyed
Number of
Businesses Percentage %
Presence of Aboriginal shareholders 6 5,5
No Aboriginal shareholders 104 94,5
Total 104 100,0
Source: LARESCO/Chaire Desjardins, Survey on the Economic Relations between the Aboriginal People and
the Businesses of Abitibi-Témiscamingue, 2006.
It can be thus concluded that the economic exchanges between the Abitibi-Témiscamingue businesses and the Aboriginals are not based on contribution of Aboriginal capital, with certain exceptions. In fact, the head offices of Aboriginal entrepreneurs whether Algonquin or Cree, are situated in Aboriginal communities. However, they were not subject to our survey, although they also contribute to the regional economy.
Existence of Business Relations with Aboriginals
The study of the business relations with Aboriginals constitutes the largest part of our survey. We estimated that a business had a business relation with Aboriginals if it bought or sold goods and services to Aboriginals (physical person or corporation). Ninety-seven businesses out of 110 of our sample stated having such relations with Aboriginal people. This information is not surprising since we targeted our sample based on this criterion. Distribution according to sector of activity (Figure 2.2) shows that the forestry, mining extraction and manufacturing sectors are less inclined to do business with Aboriginals than the other sectors of activity. Yet, most of the 13 businesses having declared that they do not do business with Aboriginals are found in the SAENCAT file, and manifested an interest in economic exchanges with Aboriginals. It could be presumed that certain businesses wish to develop business relations with Aboriginal people, and especially mining companies wish to maintain good relations with the Crees because of their activities in the North. It must be stated that certain businesses do not do business with Aboriginals but have Aboriginal persons in their employment, and based on this fact, they are considered as having economic relations with them.
Figure 2.2 – Distribution by sector of activity of the businesses surveyed that have or do not have business relations with Aboriginals
Source : LARESCO/Chaire Desjardins, Survey on the Economic Relations between the Aboriginal
People and the Businesses of Abitibi-Témiscamingue, 2006.
3. Type of Aboriginal Clientele
The businesses that maintain business relations with Aboriginals have a number of types of Aboriginal clients or suppliers: the communities (band councils or nation) are first on the list, followed by Aboriginal businesses then Aboriginal individuals and Aboriginal public organizations (Table 3.1). Frequently, the businesses surveyed declare that they do business with two or three types of Aboriginal clientele.
Table 3.1 Type of clientele of the 97 businesses surveyed having business relations with Aboriginals (multiple answers are possible)
Number of Businesses Percentage %
Aboriginal communities 75 77,3
Aboriginal businesses 70 72,2
Aboriginal individuals 66 68,0
Aboriginal public organizations 52 53,6
Source: LARESCO/Chaire Desjardins, Survey on the Economic Relations between the Aboriginal People and
the Businesses of Abitibi-Témiscamingue, 2006.
0 5 10 15 20 25 30 35 Agriculture, forestry, fishing and hunting
Construction Retail trade Wholesale trade Accommodation and food services Mining and oil and petroleum extraction
Manufacturing Transportation and storage Professional, scientific and technical services Administrative and support, waste management
and remediation services
Finance and insurance Others
Sectors of Activity
Number of Businesses
Businesses having business relations with Aboriginals
Business having no business relations with Aboriginals
The Crees are the nation with whom the businesses surveyed do the most business (81%), followed by the Algonquin nation with whom 50% of the businesses surveyed do business and the Inuit nation with 18% of the businesses (Table 3.2). Here again, it must be noted that our method of sampling privileged the businesses that do business with the Crees because the majority of the businesses selected were found in the SAENCAT files.
Table 3.2 – Type of clientele by Nation of the 97 businesses having business relations with Aboriginals (multiple answers are possible)
Number of Businesses Percentage %
With the Crees 79 81,4
With the Algonquins 49 50,5
With the Inuit 18 18,6
With another nation 1 1,0
Do not know 10 10,3
Source: LARESCO/Chaire Desjardins, Survey on the Economic Relations between the Aboriginal People and
the Businesses of Abitibi-Témiscamingue, 2006.
The analysis of this data by sector of activity (Figure 3.1) illustrates that most of the sectors of activities are interested in doing business with the Crees and the Algonquins. However, certain sectors such as construction, accommodation and food services, wholesale trade and transportation are more present on the Cree market. It also appears that the mining sector is inclined towards the Cree territory only. Several sectors of activity are involved in commerce with the Inuit, especially in wholesale and retail trade, construction and professional services.
Figure 3.1 – Type of clientele by Nation of the 97 businesses having business relations with Aboriginals according to sector of activity
(multiple answers are possible)
Source: LARESCO/Chaire Desjardins, Survey on the Economic Relations between the Aboriginal People
and the Businesses of Abitibi-Témiscamingue, 2006.
The analysis of the data in terms of MRCs (Table and Figure 3.2) reveals that the businesses of the Vallée-de-l’Or and the MRC of Rouyn-Noranda do business with three nations: the Crees, the Algonquins and the Inuit while the businesses of the Témiscamingue MRC do business exclusively with Algonquins.
0 5 10 15 20 25
Agriculture, forestry, fishing and hunting Construction Retail trade
Wholesale trade Accommodation and food services Mining and oil and petroleum extraction Manufacturing Transportation and storage Professional, scientific and technical services Administrative and support, waste management
and remediation services
Finance and insurance Others
Sectors of Activity
Number of Businesses
With the Inuit yes With the Algonquins yes With the Crees yes
Figure 3.2 – Type of clientele by Nation of the 97 businesses having business relations with the Aboriginals according to MRC location
(multiple answers are possible)
Source: LARESCO/Chaire Desjardins, Survey on the Economic Relations between the Aboriginal
People and the Businesses of Abitibi-Témiscamingue, 2006.
4. Characteristics of the Business Relations
Duration of Business Relations with AboriginalsThe businesses estimate that they established business relations with Aboriginals as early as the 1980’s (Table 4.1). Certain businesses declare that they have maintained business relations for a much longer period of time. Frequently, the businesses estimate that they have maintained business relations with Aboriginals since the businesses came into existence. Based on this factor, a parallel can be drawn with the loyalty of the Aboriginal clientele that was mentioned many times by the businesses surveyed.
0 10 20 30 40 50 60 70 MRC of the Vallée-de-l'Or MRC of Abitibi MRC of Rouyn-Noranda MRC of Abitibi-Ouest MRC of Témiscamingue Outside the Territory
MRC o f th e B u sin esses Number of Businesses
With the Inuit yes With the Algonquins yes With the Crees yes
Table 4.1 – Year when business relations were established between the sample businesses and the Aboriginals
Number of Businesses Percentage %
1940 to 1949 1 1,0 1950 to 1959 3 3,1 1960 to 1969 3 3,1 1970 to 1979 8 8,2 1980 to 1989 27 27,8 1990 to 1999 33 34,0 2000 and over 22 22,7 Total 97 100,0
Source: LARESCO/Chaire Desjardins, Survey on the Economic Relations between the Aboriginal People and
the Businesses of Abitibi-Témiscamingue, 2006.
As indicated in Table 4.2, the sales attributable to the Aboriginal clientele is inferior or equal to 10% for 64% of the businesses who have business relations with Aboriginals. Table 4.2 – Proportion of sales attributable to the Aboriginal clientele for the 97 businesses having business relations with Aboriginals (%)
Number of Businesses Percentage %
10% and less 62 63,9
11 to 25 % 18 18,6
26 to 50% 12 12,4
51% and more 5 5,2
Total 97 100,0
Source: LARESCO/Chaire Desjardins, Survey on the Economic Relations between the Aboriginal People and
the Businesses of Abitibi-Témiscamingue, 2006.
Average sales attributable to the Aboriginal clientele is 14.9% for the businesses that declared having business relations with Aboriginals (Table 4.3). It represents an amount of 100 million dollars. This varies according to the location of the businesses; the MRC of the Vallée-de-l’Or recorded the strongest rate (17.9%), followed by the MRC of Temiscamingue (9.8%) and the MRC of Abitibi (8.1%) and Rouyn-Noranda (5.6%).
The comparison of the MRC of the Vallée-de-l’Or with the other MRCs in the region reveals that the businesses that have the highest sales attributable to the Aboriginal clientele are situated in the Vallée-de-l’Or. Nonetheless, for the MRCs as a whole, the median percentage of the sales attributable to the Aboriginal clientele is 10 and less (Table 4.3).
Table 4.3 – Average proportion of sales attributable to the Aboriginal clientele of the 97 businesses having business relations with Aboriginals according to MRC
Average percentage of sales
(%) Median (%)
MRC of the Vallée-de-l'Or 17,9 10
MRC of Témiscamingue 9,8 10
MRC of Abitibi 8,1 5
MRC of Rouyn-Noranda 5,6 5
MRC of Abitibi-Ouest5 unavailable unavailable
All MRCs 14,9 10
Source: LARESCO/Chaire Desjardins, Survey on the Economic Relations between the Aboriginal People and
the Businesses of Abitibi-Temiscamingue, 2006.
Figure 4.1 – Proportion of sales attributable to the Aboriginal clientele of the 97 businesses having business relations with the Aboriginals according to location
Source: LARESCO/Chaire Desjardins, Survey on the Economic Relations between
the Aboriginal People and the Businesses of Abitibi-Témiscamingue, 2006.
5
The low sample size of the businesses situated in the MRC of Abitibi-Ouest did not permit us to calculate the rate. 0 10 20 30 40 50 60 70 80 90 10% et moins 11 à 25 % 26 à 50% 51% et plus Proportion of Sales Num b er o f Bu si nesses (% )
Businesses situated in the MRC of the Vallée-de-l'Or (%)
Businesses situated in other MRCs (%)
Appreciation of Business Relations
Seventy-one (71%) of the businesses surveyed estimate that their commercial exchanges with the Aboriginals are important and 56% declare that they have a strong Aboriginal clientele. On the other hand, 87% of the businesses consider that this clientele is not essential to their survival (Table 4.4). It thus appears that this clientele contributes to the smooth operations of the business and represents perspectives for the future. However, only half of the total number of businesses surveyed declared that they have an expansion strategy with respect to this clientele; the other half considers that the volume of their clientele or the fact that the clientele is readily present did not justify the implementation of a specific strategy. The businesses of the sectors related to retail trade, transportation, professional services and finance and insurance tend to have more expansion strategies with respect to Aboriginals than those of the other sectors of activity (Table 4.5).
Table 4.4 – Opinions of the 97 businesses having business relations with Aboriginals with respect to the following statements:
The business has significant commercial exchanges with Aboriginals The business has a strong Aboriginal clientele Without the presence of Aboriginals in the region, the business would not exist Aboriginals are suppliers of the business The business has established an expansion strategy which targets Aboriginals Strongly agree 42 (43,3) 27(27,8) 5(5,2) 3(3,1) 24(24,7) Agree 29(29,9) 29(29,9) 5(5,2) 8(8,2) 27(27,8) Disagree 16(16,5) 26(26,8) 14(14,4) 10(10,3) 20(20,6) Strongly disagree 10(10,3) 15(15,5) 73(75,3) 76(78,4) 26(26,8) Total 97(100,0) 97(100,0) 97(100,0) 97(100,0) 97(100,0) ( ): Proportion in percentage
Source: LARESCO/Chaire Desjardins, Survey on the Economic Relations between the Aboriginal People and
Table 4.5 – “The business has established an expansion strategy which targets Aboriginals”, according to sector of activity
The business has established an expansion strategy which targets Aboriginals Sector of Activity
Strongly
disagree Disagree Agree
Strongly agree
Total
Agriculture, forestry, fishing and
hunting 0 0 1 0 1
Construction 3 2 1 1 7
Retail trade 9 3 10 9 31
Wholesale trade 2 5 3 3 13
Accommodation and food
services 4 3 2 1 10
Mining and oil and petroleum
extraction 1 0 2 0 3
Manufacturing 3 2 0 0 5
Transportation and storage 1 0 2 2 5
Professional, scientific and
technical services 0 4 3 5 12
Administrative and support, waste management and remediation services
1 0 1 1 3
Finance and insurance 1 1 2 2 6
Others 1 0 0 0 1
Total 26 20 27 24 97
Source: LARESCO/Chaire Desjardins, Survey on the Economic Relations between the Aboriginal People and
the Businesses of Abitibi-Témiscamingue, 2006.
5. Business Partnerships
One-third of the businesses surveyed having business relations with Aboriginals declared that they have developed partnerships with their Aboriginal clientele (Table 5.1). The business partnerships, defined as a formal agreement between the business and the client or supplies, are related to sponsors, the implementation of services in the communities, training initiatives or work contract or at times joint ventures between two companies.
Table 5.1 – Establishment of partnerships with Aboriginals
Number of Businesses Percentage %
Yes 32 33,0
No 63 64,9
Aboriginal businesses 2 2,1
Total 97 100,0
Source: LARESCO/Chaire Desjardins, Survey on the Economic Relations between the Aboriginal People and
the Businesses of Abitibi-Témiscamingue, 2006.
The businesses in the sectors of construction, professional services, transportation and mining are those that established the highest number of partnerships with Aboriginals (Figure 5.1). The partnerships established by retail trade businesses and by the hotel industry essentially involve sponsors granted to their regular clients in the form of financial participation to Aboriginal events such as sports tournaments. The agreements could also pertain to the distribution of goods or services on the reserves as, for example, car repair services or banking services.
Figure 5.1 – Presence of partnerships with Aboriginals for the 97 businesses having business relations with Aboriginals, according to sector of activity
Source: LARESCO/Chaire Desjardins, Survey on the Economic Relations between the Aboriginal People
and the Businesses of Abitibi-Témiscamingue, 2006.
A direct link between the sales attributable to the Aboriginal clientele and the presence of a partnership was not observed (Table 5.2). For many businesses, partnerships with the
0 5 10 15 20 25
Others Agriculture, forestry, fishing and hunting Construction Retail trade Wholesale trade Hébergement et services de restauration Mining and oil and petroleum extraction
Manufacturing Transporation and storage Professional, scientific and technical services Administrative and support, waste management
and remediation services
Finance and insurance
Sector of Activity
Number of Businesses
Businesses that do not have a partnership Businesses that do have a partnership
Crees represent a means for working in the North, without being linked to the volume of business achieved with the Crees. For example, this is the case for mining companies that sign agreements with Cree communities in order to be able to work under proper conditions in their exploration and production zones.
Table 5.2 – Proportion of sales attributable to the Aboriginal clientele of the 97 businesses having business relations with Aboriginals according to presence of partnerships (%)
Sales attributable to the Aboriginal clientele
10% and less 11 to 25 % 26 to 50% 51% and more Total (%)
The business has established a partnership (%)
56,2 28,1 6,3 9,4 100,0
The business has not established a partnershipt (%)
69,8 14,3 12,7 3,2 100,0
Source: LARESCO/Chaire Desjardins, Enquête sur les relations économiques entre les Autochtones et les
entreprises de l’Abitibi-Témiscamingue, 2006.
The majority of businesses having established partnerships consider that the partnerships are fairly smooth (Table 5.3). In a more general manner, the businesses having established business relations with Aboriginals estimate that the partnerships contribute to the development of the region but much more significantly to the development of Northern Québec (Table 5.4).
Table 5.3 – Opinions of the 32 businesses having established a partnership with the Aboriginals with respect to the following statements:
Smooth partnership with the
Aboriginals
Difficult partnership with the Aboriginals Strongly agree 7(21,9) 3(9,4) Agree 14(43,8) 5(15,6) Disagree 7(21,9) 11(34,4) Strongly disagree 4(12,5) 13(40,6) Total 32(100,0) 32(100,0) ( ): Proportion in percentage
Source: LARESCO/Chaire Desjardins, Survey on the Economic Relations between the Aboriginal People and