Unité de Biologie du Comportement : Ethologie et Psychologie animale - Université de Liège
Ecology of the
Belizean black howler monkey (Alouatta pigra):
a comparison between two populations living in a riparian forest
and on coastal limestone hills
2ème Master Biologie des Organismes et Ecologie Mémoire de fin d’études
Franck Trolliet
Promoteur: Marie-Claude Huynen (Université de Liège) Co-promoteur: Kayley Evans (University of Calgary)
ii
Abstract
This study reports on the ecology of the Belizean black howler monkey (Alouatta pigra) in two different habitats. Monkey River is a riparian secondary forest whereas Runaway Creek Nature Reserve (RCNR) is a primary and mature forest situated in a limestone karst hills landscape. This type of ecosystem, neither the population inhabiting this reserve, has been studied before. We contrasted food availability, diet, group size and composition, population density, home range size and activity patterns between those two populations. We predicted the disturbed riparian forest to have higher food availability but a less diverse diet with a higher consumption of fruits. Thus, we predicted howlers to have higher population density, larger groups with more males and more infants, smaller home ranges with more overlapping. Also, we predicted activity budget to be biased toward a less active lifestyle with less travel but more inactivity, and more social interactions. Our results confirm some of those predictions as food availability is higher in Monkey River with food species accounting for 80% of the diet and all food species of howlers diet having a higher total relative basal area. This is likely to be associated with the higher population density (44.82ind/km² in Monkey River against 26in/km² in RCNR) and smaller average home range size (3.27 ha against 11.87 ha) with a higher proportion of overlapping (11.87% against 0%). Predictions on group size and composition are not confirmed as the difference in mean group size is not statistically significant and as many males per group are found in both habitats (one) but sex ratios (M:F) indicate the presence of more females in Monkey River (1:1.6 against 1:1.3). Also, more infants per group are found in RCNR (0.6 in Monkey River against 1 in RCNR). Those results are likely to be associated with different stage of population growth between the two habitats and more precisely of the hurricane Iris that have lowered the population in Monkey River and allowed more dispersal opportunities and, resulting effects of social factors such as infanticide. Nevertheless, our results indicate howler population to increase again in this disturbed forest. Howlers in RCNR have a more diverse diet (18 food sources in Monkey River against 23 in RCNR) which is likely to be due to higher diversity of plants present in the limestone karst hills. Diets in both habitats differ as only 19.5% of species are similar and species composition in both habitats are pretty different too, which confirms howlers having a flexible diet and being able to adapt their diet to the species found in the habitat. Both populations feed preferentially on leaves but howlers in the secondary forest spent more time feeding on fruits (20.46%) and less on flowers (6.46%) than in the primary forest (11% and 11.75% respectively), although those differences are not significant. Howlers in Monkey River are more active and travel significantly more (9.45% against 5.45%) which is likely to be due to the higher amount of fruits in the diet. Less time is spent in social interactions in Monkey River, which is likely to be due to the smaller number of infants per group. Finally, monkeys in the secondary forest spent significantly more time vocalizing than in the primary forest, which is likely to be due to the higher population density and level of overlap between neighboring groups. No overlap has been recorded in the limestone karst hills and percentage of vocalization is quite low.
iii
Acknowledgements
I gratefully acknowledge Marie-Claude Huynen from the University of Liège and Mary Pavelka from the University of Calgary who allowed me to undertake this project and were present all along this project with invaluable advices. They both helped me for the elaboration of the field work as well as the writing of the present paper.
I sincerely thank Kayley Evans from the University of Calgary who were of primordial help from start to end in this project. I have to award K. Evans as well as Stevan Reneau from Bird Without Border-Aves Sin Fronteras the quality field work that we have been able to undertake. They both introduced me to the forest and taught me a lot during the field season. Stevan Reneau has been of great help for the data collection and of great company during the long days in the field.
I am very grateful to Tracy Wyman from the University of Calgary for her help with the data from Monkey River, the statistics and the creation of the maps. Barb Kowalzik has to be sincerely thanked for sharing her data from Monkey River which allowed this study to take place.
I also want to thank the staff from Bird Without Border-Aves Sin Fronteras in general and especially David Tzul and Reynold Cal for their help in the field and with plant identification as well as their good company.
I want to show my gratitude to “Fondation Alice Seghers” for their financial support without which this project could not have been possible, to my family, Jantje Fritzsch and Patrick Rodrigues for their support and encouragement in my project.
Finally, I am grateful to The Zoological Society of Milwaukee and to the Foundation for Wildlife Conservation Inc., for allowing research in general and this study in particular to take place in RCNR. I am also grateful to the staff of the Tropical Education Center for their welcoming housing during the field season.
iv
Table of Contents
Abstract ... ii
Acknowledgements ... iii
Table of Contents... iv
List of figures and tables ... v
List of appendices ... vi
1. INTRODUCTION ... 1
1.1. Subject of the Study ... 1
1.2. Howler Monkeys: General Comments and Context of the Study ... 1
1.3. Study habitats ... 5
1.4 Objectives and Interests of the Study ... 9
1.5. Hypothesis and Predictions ... 9
2. METHODS ... 12
2.1. Study Sites and Groups ... 12
2.2. Data Collection ... 12
2.3. Data Processing and Analysis ... 13
3. RESULTS ... 16
3.1. Food Availability ... 16
3.2. Diet ... 18
3.3. Population Density ... 23
3.4. Group Size and Composition ... 24
3.5. Home Range... 25 3.6. Activity Budget ... 27 4. DISCUSSION ... 29 4.1. Food Availability ... 29 4.2. Diet ... 29 4.3. Population Density ... 30
4.4. Group size and composition ... 31
4.5. Home Range... 32
4.6. Activity Budget ... 33
5. Conclusion and Perspectives ... 35
6. LITERATURE CITED ... 37
v
List of figures and tables
Cover Picture of the tropical broadleaf forest in RCNR Cover
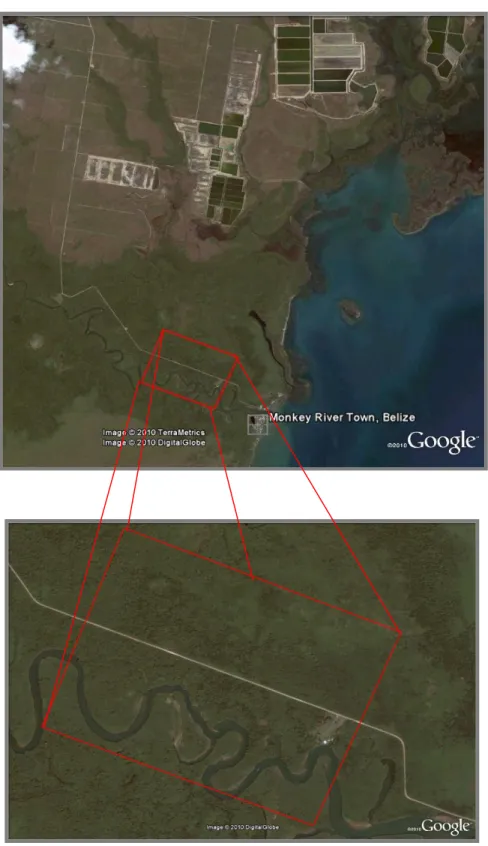
Figure 1 Aerial picture of the Monkey River study area 10
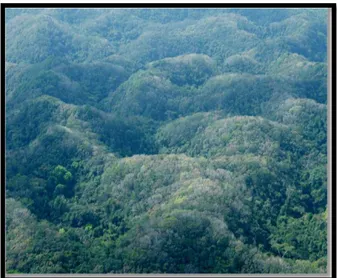
Figure 2 Topographic map of the RCNR and location of the study area. 12 Figure 3 Aerial view of the rain forest and limestone karst hills in RCNR 13 Figure 4a Diet composition of black howler monkeys in Monkey River 26 Figure 4b Diet composition of black howler monkeys in RCNR 26 Figure 5 Map of the Monkey River study site illustrating home ranges 30 Figure 6 Map of the study area in RCNR illustrating home ranges 31 Figure 7 Activity budget of black howler monkeys in Monkey River and RCNR 32 Figure 8 Amount of vocalisation for black howler monkeys in Monkey River and RCNR 33
Table 1 Distributions of behavioral activities among different studies on howler monkeys 6 Table 2 Relative basal area (%) of howler’s food species in Monkey River relative to the
total basal area of all the tree sampled.
20
Table 3 Relative basal area (%) of howler’s food species in RCNR relative to the total basal area of all the tree sampled.
21
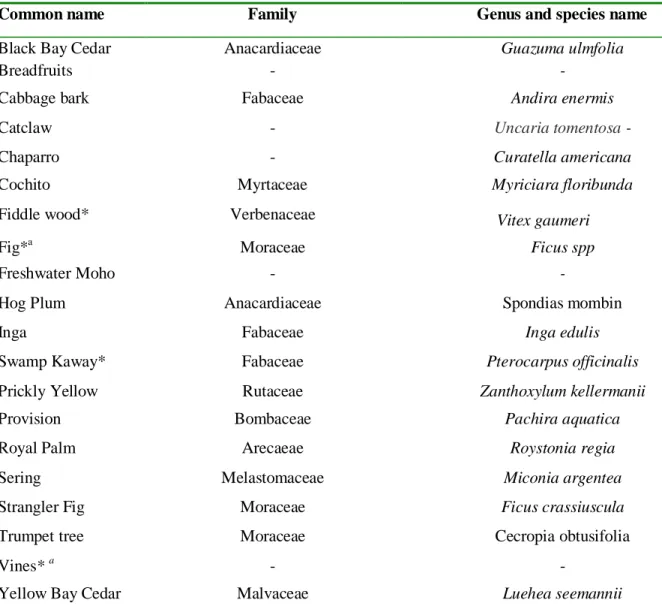
Table 4 Common and scientific names and families of food plant species accounting for the diet of A. pigra in Monkey River
22
Table 5 Percentage of time eaten and plant part eaten of food species in Monkey River 23 Table 6 Common and scientific names and families of food plant species accounting for the
diet of A. pigra in RCNR
24
Table 7 Percentage of time eaten and plant part eaten of food species in RCNR 25 Table 8 Population densities in the Monkey River study area at different periods 28 Table 9 Mean group size in Monkey River at different periods 29 Table 10 Mean group size and composition for black howler monkeys in Monkey River and
RCNR
vi
List of appendices
Appendix 1 Ethogram 51
Appendix 2 List of the 42 species of plants found in quadrats and in howlers diet in Monkey River 53 Appendix 3 List of the 90 species of plants found in quadrats and in howlers diet in RCNR 54 Appendix 4 Groups size and compositions for black howlers populations in Monkey River and
RCNR
1 1. INTRODUCTION
1.1. Subject of the Study
This study is about the ecology of black howler monkeys (Alouatta pigra). It is done through a comparative approach that allows us to highlight the differences between two populations of howler monkeys living in different habitats. We focus our comparison on food availability, diet, population density, group size and composition, home range size, and activity budget.
1.2. Howler Monkeys: General Comments and Context of the Study
1.2.1 Howlers diversity and ranging
The genus Alouatta includes different species listed as A. belzebul, A. caraya, A. fusca, A. coibensis, A. guariba, A. nigerrima, A. palliata, A. sara, A. seniculus, and A. pigra according to Groves (2001) and Rowe (1996) and found from Southern Mexico to Southern America. Howler monkeys are thus widely spread in the New World and among the most studied genus within the non-human primates (Di Fiore & Campbell, 2007). However, most of the work has been done on two species: A. palliata (e.g., Chivers, 1969; Milton et al., 1980; Jones, 1985; Glander, 1992; Zucker et al. 1997; Clarke et al., 1998) and A. seniculus (e.g., Neville, 1972; Sekulic, 1981, 1983; Crockett & Sekulic, 1984; Pope, 1990, 2000). A. pigra, commonly called black howler monkeys, are then restricted to the southern Yucatan peninsula of Mexico, western Guatemala and Belize.
1.2.2 Diet
The diet of howler monkeys is mainly composed of leaves, fruits, flowers, stem and seeds. They appear to be mainly folivorous as leaves, an abundant food resource, represent the majority of their diet, with a consumption reaching 45% (A. pigra: Silver et al., 1998), 58.62% (A. pigra Pavelka & Knopff, 2004), 54% (A.seniculus: Juliot & Sabatier, 1993), 46,6% (A. belzebul: Pinto et al., 2003), 82% (A. caraya: Prattes & Bitta-marques, 2008). Also, fruit represent an important part of their diet with consumptions generally varying between 25 and 35% depending on the species, and reaching up to 41% for A. pigra (Pavelka & Knopff, 2004) which is the most frugivorous species. In some seasons, the diet of A. pigra can include up to 67% fruit, making them highly reliant on fruit during months of high productivity (from April to July) (Pavelka & Knopff, 2004). Black howlers are thus considered to be “as folivorous as necessary and as frugivorous as possible” (Silver et al., 1998), consuming fruits preferentially depending on their availability (Pavelka & Knopff, 2004). Finally, flowers, seed and stems are consumed at a minimal level. This capacity to forage on a diversity of food sources indicates the diet of howlers is quite flexible (Cristobal-Azkarate & Arroyo-Rodriguez, 2007; Silver et al., 1998).
2 1.2.3. Activity budget
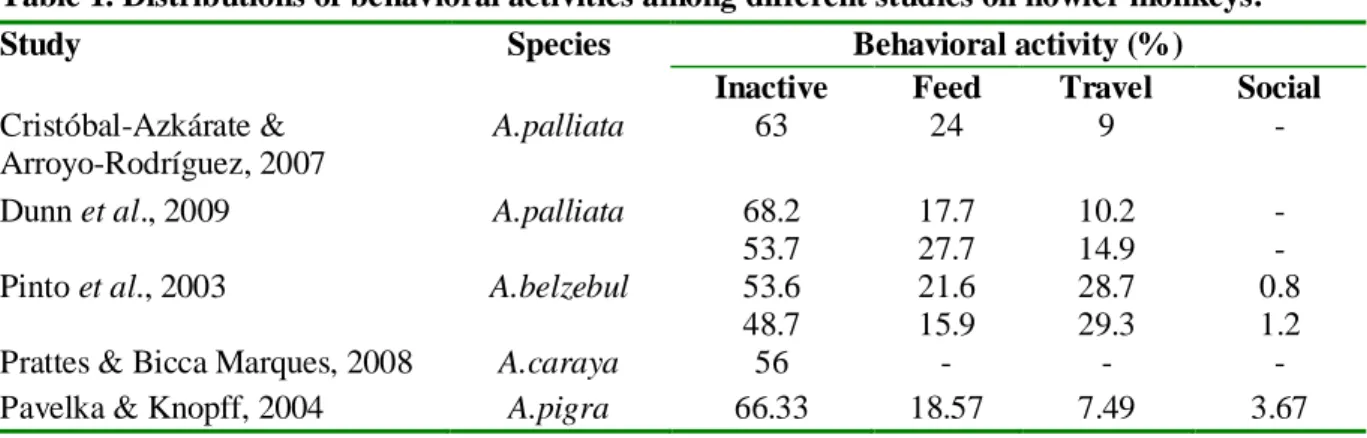
Inactive is the most commonly seen behavior in all species of the genus, followed generally by feeding (excepting in a study of A. belzebul), travelling and rare social interactions such as playing and grooming. Table 1 presents an overview of the distributions of behavioral activities among different studies and species.
Table 1. Distributions of behavioral activities among different studies on howler monkeys.
Study Species Behavioral activity (%)
Inactive Feed Travel Social Cristóbal-Azkárate &
Arroyo-Rodríguez, 2007
A.palliata 63 24 9 -
Dunn et al., 2009 A.palliata 68.2
53.7 17.7 27.7 10.2 14.9 - -
Pinto et al., 2003 A.belzebul 53.6
48.7 21.6 15.9 28.7 29.3 0.8 1.2
Prattes & Bicca Marques, 2008 A.caraya 56 - - -
Pavelka & Knopff, 2004 A.pigra 66.33 18.57 7.49 3.67 It has been long thought that howlers, being the most folivorous of the new world primates (Eisenberg et al., 1972) and thus having a low quality diet, behaved according to a characteristic low-energy strategy (Horwich et al., 1993). This is well explained by the fact that leaves are energetically poor and difficult to digest forcing folivores to consume them in high quantities and to spend long periods of fermentative digestion (Milton & McBee, 1983). A highly folivorous diet affecting energy expenditure is well illustrated by the black-and-white Colobus (Colobus polykomos) (Da Silva, 1992), however, Pavelka and Knopff (2004) have demonstrated that even during periods of high consumption of fruits, black howler monkeys maintained high a level of inactivity, calling into question the causes of this energy minimizing lifestyle. Time spent traveling seems directly affected by the availability in food in the habitat and by the size of the home range in which monkeys have to travel. Indeed, a study on A. palliata shows that the shortest daily range was recorded during period of high fruit abundance (Palacios & Rodrigues, 2001) and the authors suggest that the abundance of fruits available allow the monkeys to meet their nutritional needs over a smaller area and allow them to travel less. This increase in time traveling with an increase in fragment size has been found for the same species in three forest fragments in Mexico (Juan et al. 2000). Also, Dunn (2009) and Juan et al., (2000) found a positive correlation with between the number of species in the diet and time spent traveling. This is explained by the fact that monkeys have to travel more to get to different tree species.
Social interactions are very rare in the genus Alouatta in general (Cristobal-Azkarate, 2004), which is thought to be the consequence of the energy-minimizing lifestyle of howlers and the lack of relatives in same social groups. Time spent in social interactions appears to be affected by other predominant activities such as traveling and inactivity. A comparative study shows that groups of A. pigra spending more time travelling had less time to devote to social interactions such as playing and grooming (Pavelka & Knopff, 2004). According to Baldwin and Baldwin (1978), infants and juveniles are the age classes that spend the highest amount of time in social playing. This is well illustrated by the drop in social interactions among black
3 howlers seen after a hurricane caused a decrease in the number infants in the population (Behie & Pavelka, 2005).
Another behavior for which howlers are famous is their long call vocalizations. The function of such vocalizations is generally thought to be agonistic displays informing other groups about their respective location rather than a defined territory (Gavazzi et al., 2008). This allows them to regulate their distances (Carpenter, 1934; Chivers, 1969; Whitehead, 1987) and therefore to minimize the probabilities of potentially aggressive encounters (Whitehead, 1987, 1995). Indeed, Gavazzi et al. (2008) observed more vocal confrontation around locations that were visited by several troops and Ostro et al. (1999) noted higher level of intergroup aggressions in habitat with relatively high population density, suggesting that howlers defend their current group space and especially when other groups are around.
1.2.4. Habitat and home range
The flexibility of howler’s diet seems to allow them to survive in a variety of different habitats. Indeed, howlers can be found in intensive cultivated land (Muñoz et al, 2006), mangrove swamp forests, primary and secondary forests, tropical rain forest, and evergreen, semi-deciduous and deciduous forests (Estrada, et al. 2005, 2006). Moreover, those monkeys live in fragmented (eg: Pozo-Montuy & Serio Silva, 2006; Zunino et al., 2007; Arroyo-Rodriguez & Dias, 2009) as well as in continuous habitats (eg: Palacios & Arroyo-Rodriguez, 2001; Gonzalez-Kirchner, 1998; Coelho et al., 1976; Schlichte, 1978).In general, their home range size is comprised between 8 to 21 ha for A.pigra (Ostro et al., 1999; Gavazzi et al., 2008) or between 4 to 67 ha for A. seniculus (Sekulic, 1982; Stevenson et al., 1991). This wide variation of home range size likely depends on ecological factors characterizing the habitat such as food availability and population density. According to Dunbar (1987) and Chapman (1988a, 1988b), groups of monkeys living in habitat with lower food availability would need larger home ranges to answer their nutritional needs. For example, the population of A. seniculus studied by Palacios & Rodriguez (2001) shows a huge home range of 185 ha probably resulting from “the poor quality of the soil and the consequent diminished productivity of the forest”. Also, in their study on reintroduced A. pigra in Belize, Ostro et al. (1999) showed that a low diversity and abundance of food contributed to the increase in home range size. Indeed, it is generally thought that habitat and vegetation attributes such as abundance, diversity and basal area of top food resources are related to the presence and abundance of primates (Estrada & Coates-Estrada 1996, Cristobal-Azkarate et al. 2005). Thus, food abundance has an effect on home range size and primate abundance which in turn can affect home range size (Crockett & Eisenberg, 1987). Indeed, indirect evidences show that when howler population density increases, home range size decreases and degree of overlap increases (Baldwin & Baldwin, 1972; Chivers, 1969; Crockett & Eisenberg, 1987). In a study at Lamanai, were A. pigra population density is very high, Gavazzi et al. (2008) recorded a 52% mean and up to 63% of overlapping between home ranges.
4 1.2.5. Population density
Ostro et al. (1999) showed that population density was inversely correlated to home range size for A.pigra with higher population density in smaller home ranges. Other studies show that high densities of monkeys force groups to diminish their home ranges area due to the presence of competing neighboring groups (Dunbar, 1987; Dobson & Lyles, 1989). Inversely, very large home ranges such as notified previously for A. seniculus could also be found in conditions of the very low population density (4ind./km² (Palacios, 1997)) that allow the monkeys to use much larger area (Palacios & Rodriguez, 2001).
1.2.6 .Group size and composition
Social groups in the genus Alouatta generally include between 6 to 11 individuals for A. seniculus (Chapman & Balcomb, 1998), 6 to 18 individuals for A. caraya (Aguiar et al. 2009), and 6 to 23 individuals for A. palliata (Chapman & Balcomb, 1998). The species A. pigra is known to have the smallest social groups with 4 to 7 individuals (Chapman & Balcomb, 1998). Variations in group size between and within species have been documented for primate in general (Clutton-Brock & Harvey, 1977; Dunbar, 1988) but also for A. pigra and especially for different populations living in extensive and fragmented forests (Van Belle & Estrada, 2005). Such variations are generally attributed to the variation in ecological factors such as predation pressure or competition for food resources. For instance, a higher predation pressure would select for larger groups (Cheney & Wrangham, 1987; Hamilton, 1971) and inversely, marked competition for limited food resources would select for smaller groups (Chapman & Chapman, 2000; van Schaik, 1989). However, a study on A. pigra in Monkey River (Belize) did not find any correlation between mean group size and level of competition for food (Knopff & Pavelka, 2006) suggesting other factors related to the relatively small group size found in black howler monkeys. It is also generally accepted that population density is correlated with mean group size as more monkeys are found in groups living at high population density in A. palliata and A. seniculus (Crockett & Eisenberg, 1987) and A. pigra (Horwich et al., 2001; Pavelka et al., 2007).
Group composition can be measured according to different ratios. The most commonly used is the sex ratio, defining the mean number of adult males per adult female in a group. Sex ratio shows great variability between different species of the genus as heterosexual pairs, unimale-multifemal groups and multimale-multifemale groups have been observed in A. palliata, A. seniculus, A. caraya and A. pigra (Thorington et al., 1984; Crockett, 1985; Rumiz, 1990; Ostro et al., 2001). Such variations can be partly attributed to variations in population density as significant increases in the number of adult females and males in groups with an increase in population density have been recorded (A. palliata and A. seniculus: Crockett & Eisenberg, 1987; A. pigra: Ostro et al., 2001). Also Pavelka et al. (2007) found a relationship between population density, group size and multimale groups for A. pigra.
Inversely, after a translocation of groups of A. pigra from a forest with high population density condition to a forest with low population density condition, all multimale groups became unimale groups and the number of adult female per group did not exceed 2 (Ostro et al., 2001). The authors concluded that at low population density condition, it was more beneficial for males living in multimale groups to establish new home ranges and form
5 unimale groups rather than staying in a multimale group. For the same species, Jones (2008) found that groups were larger and more often of the type multimale at higher than at lower population density. Also, for A. palliata, Ryan et al. (2008) found that larger groups had more male-biased sex ratios.
The relative abundance of females and males in a group seems to be correlated with female reproductive success and survival of immatures. The number of infants in a group is indeed subject to variations among the genus Alouatta (Treves, 2001). More females in a group are known to attract more extragroup invasive males (Van Belle & Estrada, 2008) that are potentially infanticide (Crockett & Janson, 2000; van Schaik & Janson, 2000). Inversely, more males in a group are thought to represent a better protection for females against invading infanticide males (Treves, 2001; Van Belle & Estrada, 2008) and contribute to an increase in female’s reproductive success (Ryan et al., 2008; Van Belle & Estrada, 2008). Thus groups with more males than females would know higher survival of infants.
1.2.7. Context of the study
Knowing that howler monkeys show intraspecific variations in population density (Ostro et al., 2001; Van Belle & Estrada, 2005), group size and composition (Ostro et al., 2001; Van Belle & Estrada, 2005), ranging behavior (Ostro et al., 1999, 2000, Arrowood et al., 2003), feeding behavior (Silver et al., 1998), vocalizations patterns (Cornick & Markowitz 2002), and home range size (Cristobal-Azkarate & Arroyo-Rodriguez, 2007) across different habitat type, it would be interesting to drive a comparison of the variables discussed above known to be inter-correlated. To date, only three comparative studies have been done on A. pigra; Ostro et al. (1999, 2000) compared the ranging behavior of monkeys living in different types of secondary forests (Community Baboon Sanctuary) with those of monkeys translocated from that same forest to semi-evergreen and evergreen broadleaf tropical forests (Cockscomb Bassin Wildlife Sanctuary). Jones (2008) compared the effect of the forest type (riparian Vs deciduous) on male residence. Finally, Gavazzi et al. (2008) although they did not actually compare two sites, introduced the effect of forest type and food abundance on ranging behavior of black howlers. Moreover, most studies on A. pigra have been done in fragmented habitats (Van Belle & Estrada, 2005). To date, only three studies have been conducted on A. pigra inhabiting extensive undisturbed forest: two focused on group size and population density in Mexico (Muchukux forest (Gonzalez-Kirchner, 1998)), another in Guatemala (Tikal National Park (Coelho et al., 1976; Schlichte, 1978)) and a third one focused on population density, group size and age-sex ratio of 8 populations across Mexico and Guatemala (Van Belle & Estrada, 2005).
1.3. Study habitats
1.3.1. Monkey River
Monkey River is 52 ha site in southern Belize in a lowland semi-evergreen riparian forest in a subtropical moist life zone. The topography of this forest is more or less flat. The
6 average temperature is 26°C and the average rainfall is 4064mm (Belize Government, 2010). This site is part of a 96-km² forest fragment bordered on the north and south by coastal plain savanna, on the east by the Caribbean Sea and on the west by the Southern Highway and human settlements including agricultural fields.
7 Only one species of monkey, the black howler monkey (Alouatta pigra) is found at this site. Eight social groups have been closely monitored in the site from 1998 to 2001 when hurricane Iris struck the Belizean coastline, and the study site that was directly on its path. This category four hurricane (on a scale of five) caused massive damage to the ecosystem. The data collected the months following the hurricane showed that the monkey population has been reduced by 42% (Pavelka et al., 2003). A later study in 2004 showed a loss of population of 88% in the entire forest fragment (Pavelka et al., 2007). Indeed, the population continued to decline over the 29 months following the storm which can be partly explained by the decline in food availability (Pavelka & Chapman, 2005). Iris caused the complete loss of the canopy and the complete defoliation of the trees (Pavelka et al. 2003). According to data collected in 2002, 35% of the howlers food trees have been lost found following the hurricane. This constrained the howlers to feed on 14 species after the hurricane compared to 28 before, thus causing a heavier reliance on fewer species (Pavelka & Behie, 2005) and on a more folivorous diet as little fruit was available in the forest. Also, Geographic Information System (GIS) analyses of satellite data showed that the hurricane increased the amount of edge habitat, decreased patch size, and increased the number and isolation of patches within the study site (Alexander et al. 2006). Because of the cumulative effects of the hurricane and the human settlements around, this forest is therefore considered at secondary stage. However, it is important to consider that the data available have been collected within a year after the hurricane and that the data for this study have been collected more than 6 years after. This time must have allowed a minimum recovery of plants and monkey population and allow us to reconsider the monkey population and the food trees in this recovering forest.
1.3.2. Runaway Creek Nature Reserve (RCNR)
Runaway Creek is a private reserve located in central Belize. The average rain fall is 2000-2200 mm (Meerman, 1999). This reserve encompasses 2432 hectares andrepresents an important biological corridor between two of the largest remaining forest blocks in the country. There are a variety of different vegetation types found at RCNR including marshlands, pine savannah, riparian forest, limestone ridges, and tropical forests. A REA (Rapid Ecological Assessment) made by Meerman (1999), describes the vegetation in the forest as tall semi-evergreen or evergreen forest. Also the topography in RCNR consists of elevated karst limestone hills. Such limestone formations are considerably porous and
characterized by great variations in their topography and by steep and irregular ground
surfaces (Crowther, 1982). There is also a considerable level of drainage of nutrients (Furley & Newey, 1979) and runoff from upper to lower areas. Such patterns have been found in Belizean (Furley & Newey, 1979) and Malaysian karst hills. Indeed, lower areas in Belizean karst hills are proven to have more nutrients and moisture than upper area resulting in more potential for plant growth (Furley & Newey, 1979). Thereby, it appears that ecological conditions are not homogeneous in this forest and Meerman (1999) recorded a wide diversity of vegetation patterns. The tropical forest is relatively undisturbed as human impact on the reserve as well as on its periphery is minimal. The only known harmful effects are occasional poachers coming in the reserve and the proximity of the unpaved western highway. There are
8 two species of monkeys in RCNR: black howlers monkeys (A. pigra) and black handed spider monkeys (Ateles geoffroyi).
Figure 2. Topographic map of the Runaway Creek Nature Reserve and location of the study area.
An important characteristic of this ecosystem is the presence of those two primates species living sympatrically. The presence of Ateles geoffroyi in RCNR indicates it is probably an undisturbed habitat as spider monkeys are very sensitive to habitat disturbance and rely on ripe fruits and need large home ranges (Di Fiore & Campbell, 2007). Spider monkeys are primarily frugivorous (Chapman, 1990) but also eat new leaves and could represent therefore a competing species with howler monkeys that also feed on fruits and new leaves. As a result of this sympatry, one could expect indirect competition to force both species to forage over a greater area because of reduced foraging efficiency per patch (Terborgh & Janson, 1986). To a greater extent we can expect this sympatry to limit the howler monkey population as food abundance (Milton, 1980, 1982; Froehlich et al., 1981; Crockett, 1985) and the number of competing primate species (Struhsaker, 1978; Eisenberg, 1979; Crockett, 1985) have traditionally been thought to limit primate density and thereby to influence the structure of populations (Chapman & Balcomb, 1998). Also, the occurrence of direct competition through aggressive interactions between spider and howler monkeys have been previously recorded (Simmen, 1992; De Gusta & Milton 1998). Such competitions could
9 drive a species to avoid encounters with the other competing species which can in turns affect its ranging behavior in the habitat.
Figure 3. Aerial view of the rain forest and limestone karst hills in RCNR.
1.4 Objectives and Interests of the Study
The present study gives rise to two mains objectives. The first objective of this study is to report on the ecology of black howler monkeys in RCNR which is a previously unstudied population that live in a relatively undisturbed karst limestone hill ecosystem. To date there have been no howler monkeys studied in this type of ecosystem. This will allow us to report population parameters such as population density, age-sex ratio and group-size for a previously unstudied population of A. pigra in Belize. The second objective of this study is to compare those parameters as well as the diet, activity budget and ranging patterns with another population of howler monkeys living in Monkey River. RCNR and Monkey River are two habitats presenting different characteristics expected to influence black howler monkeys population parameters (density and structure) and ecology (diet, home range size and activity budget).
1.5. Hypothesis and Predictions
1.5.1 Hypothesis
In the present study we compare two forests that are very different regarding their ecological type, disturbance, annual rainfall, history and other factors that are not measured here. The main variable we use to contrast the two sites is the food availability for black
10 howler monkeys populations in their respective habitats. Following are hypothesis on how the studied variables should be correlated:
a. Food availability should affect diet.
b. Food availability should affect population density. c. Food availability should affect home range size.
d. Population density should affect group size and composition. e. Food availability should affect activity budget.
f. Population density should affect activity budget.
1.5.2 Predictions
Firstly, considering the amount of time elapsed between the hurricane in 2001 and the collection of the data in Monkey River used for this study (2007), we can considerer that if the forest is recovering, the monkey population would be recovering as well, and we should bee able to notice a difference in population parameters. Therefore, we predict that population density and mean group size should be higher in this study than soon after the hurricane.
Two points allow us to predict higher food availability in Monkey River. Firstly, the rain fall is higher in Monkey River and according to Chapman and Balcomb (1998) habitat productivity increases with rain fall. Therefore, primary productivity should be higher in Monkey River, which should translate into a higher abundance of plants (Chapman and Balcomb, 1998; Hall, 1977). Secondly, because of the specific topography and the heterogeneous distribution of nutrients in RCNR, primary productivity should be more homogeneous and higher in Monkey River and we therefore predict to find higher food availability in Monkey River.
As well, because of this higher productivity, more fruits should be available in this forest and we predict howlers in Monkey River to spend more time feeding on fruits and flowers than in RCNR.
Because of the diversity of ecological conditions found in the limestone karst hills (Meerman, 1999), more diverse vegetation patterns should result from it and we predict there to be higher plant species diversity in RCNR.
As a result of this higher diversity of plants, howlers should have more potential food species available and we predict them to have a more diverse diet in RNCR than in Monkey River.
We predict that the higher food availability in Monkey River should allow more howlers to live in this area (higher carrying capacity) (Milton, 1980; Crockett, 1985), resulting in a higher population density in Monkey River than in RCNR.
Regarding group size and composition, the higher population density in Monkey River should force howlers to live in larger groups. We predict therefore mean group size to be higher in Monkey River. We predict also to find more groups of the type multimale-multifemale in Monkey River whereas groups in RCNR should be of the type heterosexual
11 pairs and unimale-multifemale. We predict therefore to find relatively more males in Monkey River. As the result of this biased sex-ratio, we predict to find more infant in Monkey River.
The higher food availability in Monkey River should allow howlers to meet their nutritional needs over smaller area. Moreover, because of possible scramble competition for food in RCNR with the competing spider monkeys, and the potential resulting decreased food availability, we predict that home ranges in RCNR should be larger than in Monkey River.
Also, because of the higher population density predicted in Monkey River, we predict neighboring home ranges in Monkey River to present higher degree of overlapping.
Because of larger home ranges, lesser food availability and more diverse diet predicted in RCNR, we predict howlers in RCNR to spend more time travelling than in Monkey River. As a result, we predict howlers to be more active in RCNR and, also due to the lower number of infants predicted in RCNR, howlers should spend less time in social interactions.
Finally, because of a higher population density and higher degree of overlapping home ranges in Monkey River, howlers should have a more important need to inform neighboring groups about in their location and we predict thereby howlers in Monkey River to allocate more time to vocalization
12 2. METHODS
2.1. Study Sites and Groups
2.1.1. Monkey River
During the study in Monkey River a total of 70 hours of focal observation has been collected in the dry season of 2007, from February to May. The data have been collected on 5 howler groups named Q, A, B, N and G. A same group was not observed two days in a row.
2.1.2. RCNR
Within the RC NR, howler monkeys groups have been observed in a portion of the study area as shown in figure 2. During the study period in RNCR a total 76.5 hours of focal observation has been collected during the dry season of 2010, from February to May. The field work took place from Sunday to Thursday from either 6am to 2pm or from 10am to dark. We tried not to observe a same group two days in a row but as groups ranges were not known previous to this study, groups could not be found systematically. The total number of focals and scans and the number of days spent in the field in the morning and in the evening have been balanced between the two groups of study. A total of 3 groups have been found in this area but only 2 of them have been used to collect the data on a regular basis. Those are the groups Hn and Wn. The third group Mn has been found and observed one day but not again later. All of these groups have become used to the consistent presence of humans in the area doing research on spider monkeys since 2007, and are therefore considered to be habituated.
2.2. Data Collection
2.2.1. Vegetation sampling
To calculate plant species diversity in Monkey River, 48 quadrats of 20 meters by 20 meters have been established, representing a total of 1.92 ha of forest that has been sampled. In RCNR, 16 quadrats of 40 meters by 40 meters have been established, representing a total of 2.56 ha of forest that have been sampled.. The same collection protocol was used in both habitats: a measuring tape has been used to measure out all of the sides, each corners have been flagged and marks at half the length of each side have been made on each side. From those, distances of half the length of a side have been measured in order to mark the center of each quadrat, thus separating the quadrat into 4 sections. We then went systematically through each section identifying and measuring trees at breast height that had a DBH (diameter at breast height) of 30cm or more. The locations of the quadrats were randomly selected, but we tried to get a representation of the different habitat types in the area.
13 2.2.2. Behavioral observations
Behavioral data collection has been conducted using the frequency scan method as described by Struhsaker (1975) and the focal animal sampling as described by Altmann (1974). Scans have been done every 30 minutes and those included the weather, the GPS coordinates of the group being observed, the composition of the group, the spread of the group and the behavior of all individuals within the group. A maximum length of 5 minutes was allowed to record the behavior of all individuals and behavior was not recorded for five seconds after an individual was spotted, in order to remove the bias of recording movement as the behavioural state. Between two scans, focals were conducted, each for a duration of 10 minutes per individual during which all behaviors of the focal animal were recorded. The same individual was not sampled within the next 30 minutes following his last focal sampling. Infants dependant on their mother were not sampled as their behavior is strongly influenced by their mother. The difference between state behaviors and events is made. When the monkeys where observed feeding, the species and plant part being eaten was recorded whenever possible.
2.3. Data Processing and Analysis
All statistical tests were run using the software Statistica 7.0 (StatSoft. Inc). Previous to statistical tests, normal distribution of the variables was tested and in consequence, parametric or non-parametric tests were run. Significant difference were considered at a p-value <0.05.
2.3.1. Diet
The total amount of time spent feeding on each food species have been calculated and the sum of the most commonly eaten food species were calculated to obtain the food species accounting for 80% of the total feeding time.
In order to get the diet composition, plants parts such as new leaves (NL), mature leaves (ML), unknown leaves (UL) and leaf buds (LB) where combined into the category called “leaf” and used to assess the proportion of leafy material in the diet of the monkeys. Then, fruits (Fr) were combined into the category “Fruit” and flowers (Fl) into the category “Flower” and respectively used to assess the proportion of fruits and flowers in the diet. Finally, plant parts such as stem (St) and seeds (Se) were combined into the category “other” but this part was excluded from the statistical analysis as it was rare and so little that it could not account for a significant difference in the diet composition. Feeding behaviors when the plants part where unknown were not considered for the analysis of diet composition but all the food species recorded were used to assess time spent feeding on each diet category. The amount of time monkeys have been observed each day can vary widely and lead to considerable numbers of 0% and 100% of daily time spent in either diet category. This great variance obtained for each habitat does not allow us to highlight eventual statistical differences between times spent eating on each diet category. Therefore, we cumulated daily values into weekly values in order to obtain the weekly proportion of time spent eating on
14 each category to get more accurate variance for each habitat. Thus, a total of 16 weeks have been used for each habitat as the unit sample for comparison. Then, in order to test for the difference in mean time spent in the category “leaf” an independent t-test have been run whereas for the categories “fruit” and “flower” a Mann-Whitney U-test has been run. Finally, we compare the dietary similarity in the respective habitat of the monkeys using the Sorensen’s coefficient (S) as defined by: S=2C/A+B where C is the number of species shared in both habitats and A and B the number of species specific for both habitats (Cristobal-Azkarate & Arroyo-Rodriguez, 2007). When different species could not be specified, they were included into a food source category which was considered as one species for this analysis. This is to avoid an observation bias, as species included in a food source were differentiated in one habitat (such as vines in RCNR) but not in the other.
2.3.2. Food availability
Food availability is defined as the amount of food available for the monkeys in their habitat. The amount of food available is based on the diet composition recorded in respective habitats.It is measured by the proportion of total basal area of food tree species relative to the total basal area of all trees sampled in the quadrats. According to Chapman et al. (1992), DBH (diameters at breast height) is directly related to the basal area of the trunk and provides the best estimates of fruit abundance in trees. As a result, basal area is used to measure fruit and leaf abundance in the present study. Then, higher the percentage of relative basal area is, higher the food availability is in a given area. The food species accounting for 80% of the total feeding time, as well as all the food species were considered to compare food availability. Species diversity present in each habitat was calculated and the similarity of species present in both habitats was tested using the Sorensen’s coefficient (S). The vines and epiphytes (Philodendron) were not considered in the quadrats so they were not included in the calculation of food availability.
2.3.3. Population density
We express population density (individuals/km²) in terms of number of individuals present in the area sampled during the study periods. Thus, numerators include all individuals studied in social groups as well as spotted solitary individuals. Denominators are not home range sizes of the observed social groups but total areas including areas between observed home ranges that have been checked for presence of howlers on a regular basis. Those were plotted using GPS coordinates collected in the field and calculated using the GIS software Arc View.
2.3.4 Groups size and composition
Group size is defined here by the total number of individuals within a social group, including infants. Group composition is defined by the sex ratio, so by the number of males per female. We also look at the mean number of infants per group.
A Mann-Whitney U-test has been run to test for the difference in group size between the two habitats.
15 2.3.5. Home range
GPS coordinates of observed social groups have been recorded every 30 minutes over entire study periods. Then, home ranges have been plotted using the minimum convex polygon technique thanks to the GIS software Arc View. Percentage of overlapping was calculated as the ratio of the surface area in which different social groups have been sighted to the surface area in which one given social group have been sighted (Gavazzi et al., 2008)
A Mann-Whitney U-test has been run to test for the difference in home range size between the two habitats.
2.3.6. Activity budget
For the analysis, behaviors were categorized into five different categories: inactive (includes resting, sitting in body contact, sitting near another individual and scanning), travel (includes locomote and travel), feed, social (includes grooming and social play behavior) and vocalization (including only long distance vocalizations and not quick vocalizations). In order to test for the difference in mean time allocated to each behavioral activity between the two habitats, Mann-Whitney U-tests have been run.
16 3. RESULTS
3.1. Food Availability
In Monkey River, the total basal area of the food tree species accounting for 80% of the diet represents 25.48% of the total basal area of the trees present in the habitat (table 2). When taking into account all food species that have been sampled, this habitat has a food availability of 40.14% resulting in an increase of 14.66% when all food species are included
In RCNR, the total basal area of the food tree species accounting for 80% of the diet represents 19.7% of the total basal area of the trees present in the habitat (table 3). While taking into account all food species sampled, this habitat has a food availability of 27.91%, resulting in an increase of 8.2% when all the food species are included. However, it appeared that one species (Chaparro) in Monkey River and three species (Swamp Kaway, Welliam, and Copna) in RCNR were not found in the quadrats and were not therefore included in the total basal area of food trees.
Table 2. Relative basal area (%) of howler’s food species in Monkey River relative to the total basal area of all the tree sampled.
Common name Relative basal area (%)
Black Bay Ceddara 6.24
Breadfruit 0.55 Cabbage Barka 0.28 Chaparoc - Cochito 0.05 Fiddle Wooda 0.78 Figa 0.47 Freshwater Moho 0.08 Hogplum 3.68 Inga 0.71 Swamp Kawaya 0.23 Prickly Yellow 0.23 Provision 1.03 Royal Palma 1.94 Sering 0.21 Strangler figa 1.21 Trumpeta 1.20 Vinesab -
Yellow Bay Cedar 8.11
Totala Total
25.48 40.14
a
Species accounting for 80% of the diet.
b
Non-tree growth form that was not included in the quadrats
c
17 Table 3. Relative basal area (%) of food species of howlers diet in RCNR compare to the total basal area of all the tree sampled.
Common name Relative basal area (%)
Acaciaa 0.82
Ball Seed tree 0.20
Copala 2.18 Copnac - Cream wood 0.22 Fiddle Wood 5.91 Figa 2.96 Jobillo 1.68 Iron wooda 1.21 Swamp Kawayc - Mammee Cirella 0.42 Negritoa 1.30 Philodendronb - Rain treea 1.24 Red Gumbolimbo 0.89 Red Ramon 0.70 Red sillion 0.36 Tamatama bribri 0.19 Vinesab - Warrie wood 4.74 Welliamc - Wild Breadnuta 1.79 Wild Cherrya 1.10 Totala Total 19.70 27.91 a
Species accounting for 80% of the diet.
b
Non-tree growth form that was not included in the quadrats
c
18 3.2. Diet
3.2.1. Food species in Monkey River
Howler monkeys diet in Monkey River is composed of 20 food sources, including different unspecified species of vines included into the category “Vines” (table 4). At least one species of fig (Strangler Fig) have been differentiated here but not in RCNR then, in order to compare more accurately with the diet in RCNR, we can include this species into the category “Fig”. At least one species of vine (Catclaw) have been differentiated here but it is included into the category “Vines”. Thus we consider 18 different food sources for this habitat. Eight different food sources account for about 80% of their diet (table 5). Of those 80%, three food sources are shared with the other habitat (Swamp Kaway, Fig and Vines), which are by the way the only food sources shared between the two habitats within their whole diet.
Table 4. Common and scientific names and families of food plant species accounting for the diet of A. pigra in Monkey River, Belize.
* Food sources that are shared in the two habitats.
a
Unspecified food source that may includes different species.
Common name Family Genus and species name
Black Bay Cedar Anacardiaceae Guazuma ulmfolia
Breadfruits - -
Cabbage bark Fabaceae Andira enermis
Catclaw - Uncaria tomentosa -
Chaparro - Curatella americana
Cochito Myrtaceae Myriciara floribunda
Fiddle wood* Verbenaceae Vitex gaumeri
Fig*a Moraceae Ficus spp
Freshwater Moho - -
Hog Plum Anacardiaceae Spondias mombin
Inga Fabaceae Inga edulis
Swamp Kaway* Fabaceae Pterocarpus officinalis
Prickly Yellow Rutaceae Zanthoxylum kellermanii
Provision Bombaceae Pachira aquatica
Royal Palm Arecaeae Roystonia regia
Sering Melastomaceae Miconia argentea
Strangler Fig Moraceae Ficus crassiuscula
Trumpet tree Moraceae Cecropia obtusifolia
Vines* a - -
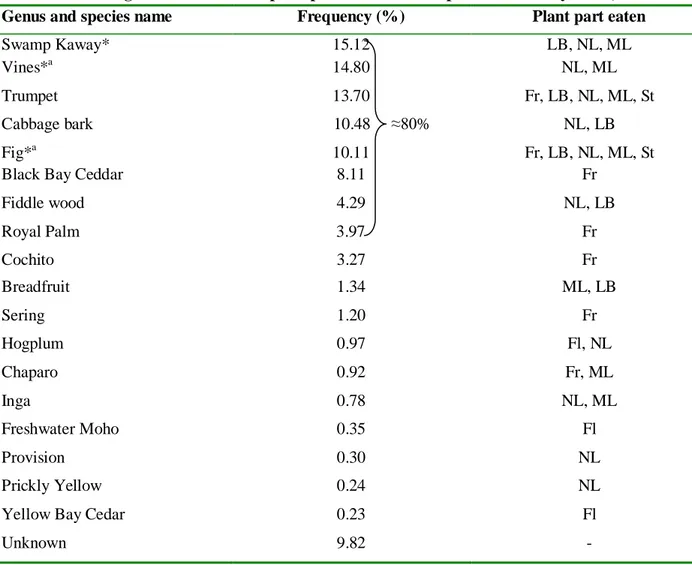
19 Table 5. Percentage of time eaten and plant part eaten of food species in Monkey River, Belize.
Genus and species name Frequency (%) Plant part eaten
Swamp Kaway* 15.12 LB, NL, ML
Vines*a 14.80 NL, ML
Trumpet 13.70 Fr, LB, NL, ML, St
Cabbage bark 10.48 ≈80% NL, LB
Fig*a 10.11 Fr, LB, NL, ML, St
Black Bay Ceddar 8.11 Fr
Fiddle wood 4.29 NL, LB Royal Palm 3.97 Fr Cochito 3.27 Fr Breadfruit 1.34 ML, LB Sering 1.20 Fr Hogplum 0.97 Fl, NL Chaparo 0.92 Fr, ML Inga 0.78 NL, ML Freshwater Moho 0.35 Fl Provision 0.30 NL Prickly Yellow 0.24 NL
Yellow Bay Cedar 0.23 Fl
Unknown 9.82 -
*Food sources that are shared in the two habitats.
a
20 3.2.2 Food species in RCNR
The diet in RCNR it composed of a total of 26 food plants, including different unspecified species of fig included into the category “Fig” (table 6). Four different species of vines (Blood vine, Sapintaceae vine, Sandpaper vine and Snake vine) have been here differentiated, then, in order to compare more accurately with the diet in Monkey River, we can include those four species into the category “Vines”. Thus we consider a total of 23 food sources in this habitat. In RCNR, nine food sources account for about 80% of the diet (table 7) which is more than in Monkey River. Among those, only two food sources (Fig and Vines) are shared with the diet in Monkey River. Swamp Kaway which is the most commonly eaten species in Monkey River and account for 15.12% of the total feeding time accounts for only 1.59% of the total feeding time in RCNR.
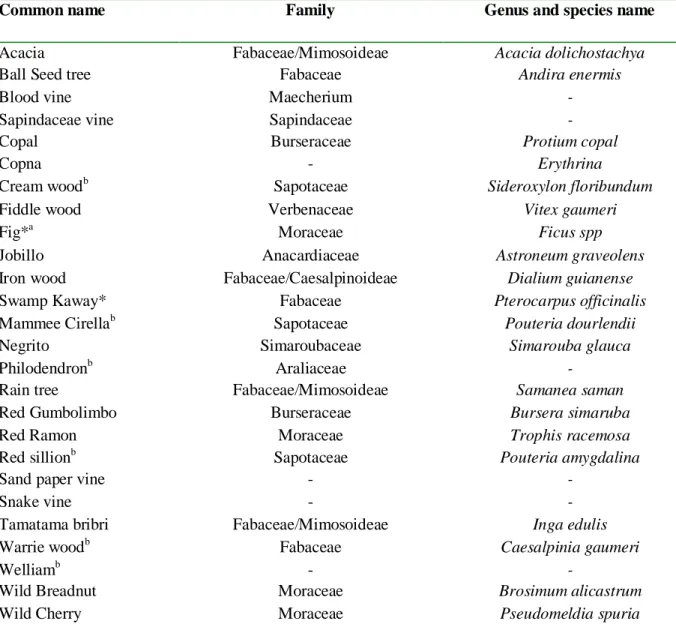
Table 6. Common and scientific names of food plant species accounting for the diet of A.pigra in RCNR, Belize.
Common name Family Genus and species name
Acacia Fabaceae/Mimosoideae Acacia dolichostachya
Ball Seed tree Fabaceae Andira enermis
Blood vine Maecherium -
Sapindaceae vine Sapindaceae -
Copal Burseraceae Protium copal
Copna - Erythrina
Cream woodb Sapotaceae Sideroxylon floribundum
Fiddle wood Verbenaceae Vitex gaumeri
Fig*a Moraceae Ficus spp
Jobillo Anacardiaceae Astroneum graveolens
Iron wood Fabaceae/Caesalpinoideae Dialium guianense
Swamp Kaway* Fabaceae Pterocarpus officinalis
Mammee Cirellab Sapotaceae Pouteria dourlendii
Negrito Simaroubaceae Simarouba glauca
Philodendronb Araliaceae -
Rain tree Fabaceae/Mimosoideae Samanea saman
Red Gumbolimbo Burseraceae Bursera simaruba
Red Ramon Moraceae Trophis racemosa
Red sillionb Sapotaceae Pouteria amygdalina
Sand paper vine - -
Snake vine - -
Tamatama bribri Fabaceae/Mimosoideae Inga edulis
Warrie woodb Fabaceae Caesalpinia gaumeri
Welliamb - -
Wild Breadnut Moraceae Brosimum alicastrum
Wild Cherry Moraceae Pseudomeldia spuria
* Food sources that are shared in the two habitats.
a
Unspecified food source that may includes different species.
b
Species that have been observed to be briefly consumed during the study period but not recorded into the feeding behavior for use in the analysis.
21 Table 7. Frequencies as percentage of the diet and plant part eaten of food plant species accounting for the diet of A.pigra in RCNR.
Genus and species name Percentage in the diet Plant part eaten
Fig* 28.92 Fr, NL, St Vines* 20.43 Fl, LB, NL, St Copal 8.90 NL Negrito 4.88 Fr, NL Wild Breadnut 4.72 ≈80% Fl, Fr, NL Iron Wood 3.56 Fr, NL Acacia 3.42 Fl, NL Rain tree 2.23 NL, ML Wild Cherry 2.19 Fr, Fl Tamatama bribri 1.99 Fl, UL Red Ramon 1.79 NL Red Gumbolimbo 1.61 NL Swamp Kaway* 1.59 LB, NL Gobillo 1.49 NL Bastard Rose 1.14 NL Fiddle wood* 0.89 NL Ballseed tree 0.68 NL Copna 0.58 Fl, Fr, NL RoyalPalm 0.43 NL Philodendronb - - Red sillionb - - Warrie woodb - - Welliamb - - Unknown 8.39 -
* Food sources that are shared in the two habitats.
b
Species that have been observed to be briefly consumed during the study period but not recorded into the feeding behavior for use in the analysis.
3.2.3. Similarity in habitats and diets
According to the quadrats made in both habitats, 42 species of plants have been identified in Monkey River and 90 in RCNR, 18 of them are shared between the two habitats. Thus, with Sorensen’s index of similarity, it appears that 27.3% of plants species are shared between the two habitats.
Howlers in the two habitats share a total of 4 food sources (Fig, Vines, Swamp Kaway and Fiddle wood). According to the Sorensen’s coefficient, those represent 19.5% of their food sources.
22 3.2.4. Diet composition in Monkey River and RCNR
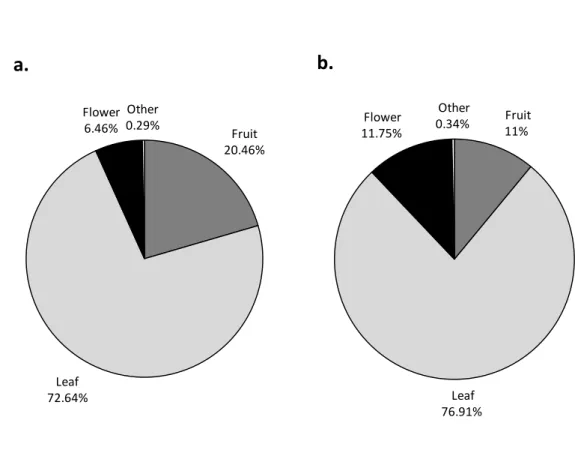
Diet in Monkey River (figure 4a.) is principally composed of leaves, 72.64%, then of fruits, 20.46%, flowers with 6.46% and other food items with 0.29% of total feeding time. Diet in RCNR (figure 4b.) is also principally composed of leaves with 76.91%, then of fruits with 11%, flowers with 11.75% and other food items with 0.34% of total feeding time. The time spent feeding on leaves between the two habitat is not statistically significant (independent t-test: t=-0.57, p=0.57), neither for fruit (Mann-Withney U-test: U=89.5, p=0.13), nor for flower (Mann-Whitney U-test: U=110.5, p=0.52).
Figure 4. Diet composition of black howler monkeys in Monkey River (a.) and RCNR (b.), Belize.
Fruit 20.46% Leaf 72.64% Flower 6.46% Other 0.29%
a.
Fruit 11% Leaf 76.91% Flower 11.75% Other 0.34%b.
23 3.3. Population Density
3.3.1. Variations in population densities in Monkey River
Total area that has been sampled for the calculation of population density in Monkey River in the present study measures 58.35 ha. Table 8 presents different population densities that have been measured at different periods in the study area.
Table 8. Population densities in the Monkey River study area at different periods.
Period Year Population density (ind./km²)
Pre-hurricane 1999-20011 101.92 Post hurricane 2002 (Feb)2 60 2002 (May)2 56 20041 23 20073 44.82 1
From Pavelka & Chapman, 2005.
2
From Pavelka et al., 2003.
3
Present study.
3.3.2. Population density in RCNR
Total area that has been sampled for the calculation of population density measures 61.39 ha in RCNR. Population density is 26 individuals/km².
24 3.4. Group Size and Composition
3.4.1. Variation in mean group size in Monkey River
As we see in table 9, results from different studies show that mean group size in Monkey River was 6.4 before the hurricane, and decreased until 3.7 in 2004. Since then, mean group size seems to have increase to reach 5.2 in 2007.
Table 9. Mean group size in the Monkey River study area at different periods.
Period Year Mean group size
Pre-hurricane 1999-20011 6.4 Post hurricane 2002 (Feb)2 5.2 2002 (May)2 5 20041 3.7 20073 5.2 1
From Pavelka & Chapman, 2005.
2
From Pavelka et al., 2003.
3
Present study.
3.4.2. Group size and composition in Monkey River and RCNR
As shown in table 10, mean group size is slightly larger in Monkey River with 5.2 individuals against 5 individuals in RCNR. This difference is not statistically significant (Mann-Whitney U-test: U=7.5, p=1.0). In total there are 8 adult females, 5 adults in Monkey River and 4 adult females and 3 adult males in RCNR. In RCNR there is an average of 1 infant per group whereas in Monkey River there is an average of 0.6 infant per group. Sex ratio (adult males per adult female) is higher in Monkey River (1:1.6) meaning there are more males per females in RCNR (1:1.3).
Table 10. Mean group size and composition for black howler monkeys in Monkey River and RCNR.
Habitat Mean
group size
# Adult F # Adult M Mean # infants
Sex ratio (M:F)
Monkey River 5.2 8 5 0.6 1:1.6
25 3.5. Home Range
Home ranges in Monkey River are smaller and present more overlapping area than in RCNR. The difference in home range size is not statistically significant (U Man-Whitney test: U=0, p=0.10).
3.5.1. Home ranges in Monkey River
Home ranges for the dry season of 2007 in Monkey River are illustrated in figure 5. Home range size and situation are available only for four groups (N, B, Q , A) as the group G has not been followed enough time to get an home range size estimate that would be proportional with the other groups. Group N, composed of 6 individuals, has a home range of 3.76 ha. Group N is not overlapping with the other groups but it is worth noting a road separates group N from the other groups. Group B, composed of 6 individuals has a home range of 3.43 ha and 11.8% (0.4 ha) of overlapping with the group A. Group Q composed of 4 individuals has a home range of 2.64 ha and 5.3% (0.14 ha) of overlapping with group A. Finally, group A composed of 3 individuals has a home range of 3.05 ha and 17.9% of overlapping (0.4 ha with the group B and 0.4 ha with the group Q). Mean size of home ranges in Monkey River is therefore 3.22 ha and mean overlap is 11.7%.
26 3.5.2. Home ranges in RCNR
Home ranges in RCNR for the dry season of 2010 are as illustrated in figure 6. Group Wn composed of 3 individuals has a home range of 4.61 ha and the group Hn composed of 7 individuals has a home range of 19.13 ha so four times larger than Wn home range. Mean size of home range in RCNR is therefore 11.87 ha. The group Mn have been observed only one day in the area so its home range can not be illustrated. Over the study period, 0% of overlap of home ranges between the neighboring groups Hn and Wn have been recorded and no other howler group have been observed in the area between Hn and Wn home ranges where researchers have been circulating on a daily basis.
Figure 6. Map of the study area in RCNR with Wn and Hn groups home ranges and location of Mn group.
27 3.6. Activity Budget
When looking at activity budgets in both habitats (figure 7) it appears that monkeys in Monkey River spend 64.54% of their time inactive, whereas monkeys in RCNR spend 70.84% of their time inactive. This difference is not statistically significant (Mann-Whitney U-test: U=89; p=0.22). Monkeys forage for 22.96% of their time in Monkey River against 21.97% in RCNR, a slight difference which is not statistically significant (Mann-Whitney U-test: U=116, p=0.89). Howlers in Monkey River travel significantly more than those in RCNR with 9.45 and 5.49% respectively (independent t-test: t=2.84, dl=29, p=0.008). Howlers in Monkey River spend 1.14% of their time in social interactions against 1.44% in RCNR, a slight difference which is not significant (Mann-Whitney U-test: U=88, p=0.39). Finally, howlers in Monkey River spend 1.5% of their time howling whereas they spend only 0.23% in RCNR (figure 8). A difference which is statistically significant (Mann-Whitney U-test: U=76.5, p=0.047).
Figure 7. Activity budget of black howler monkeys in Monkey River and RCNR, Belize. Activity budget is categorized into Inactive, Feed, Travel and Social. Each activity is measured as percentage of time observed.
0,00 10,00 20,00 30,00 40,00 50,00 60,00 70,00 80,00 Monkey River RCNR Ac ti vi ty (% ) Habitat Inactive Feed Travel Social
28
Figure 8. Amount of vocalisation measured as percentage of time observed for black howler monkeys in Monkey River and RCNR, Belize.
0 0,2 0,4 0,6 0,8 1 1,2 1,4 1,6 Monkey River RCNR V oc al is at ion (% ) Habitats
29 4. DISCUSSION
We asked ourselves what the differences between black howler monkeys populations living in disturbed riparian habitat with those living in undisturbed coastal limestone karst hills are. In a general way it appears that some aspects of their ecology show significant variations between the two populations while some others seem not to vary significantly, allowing us to discuss about how the studied variables actually influence each other and how relationships between ecological variables can be interfered.
We used the t-test and Mann-Whitney U-test to test for significant differences between the mean values of the ecological variables studied. The sample sizes used were pretty small. It is important to note that the p-value of a test depends on the sample size and that an important difference may not be statistically significant if the sample size is too small (Freedman et al., 1998).
4.1. Food Availability
We predicted that food availability would be higher in Monkey River. According to the relative basal area of the food tree species, this prediction is confirmed when considering the most commonly eaten species accounting for 80% of the total feeding time and also when considering all the species from the diet.
However, it is important to note that the results obtained are underestimated as they do not include some food species because of their absence from the quadrats. Indeed, the vines, that account for 14.22% of the total feeding time in Monkey River and the vines and epiphyte (Philodendron), that account for 20.43% of the total feeding time in RCNR were not included in the quadrats. This is because they could not be analyzed with the same protocol as the one used for the species presenting an actual trunk, from which a basal area could be calculated. Moreover, one tree species in Monkey River and three tree species were not found in the quadrats probably because of their apparently low density in the forests. Thus, the higher percentage of vines and epiphytes eaten and the highest number of tree species not considered to calculate food availability in RCNR could partly account for the lower percentage of relative basal area of food tree species found.
4.2. Diet
We predicted that dietary diversity and plant diversity would be higher in RCNR due to the higher variation of ecological conditions at that site. Both of those predictions are well confirmed. The specific variations in topography of the karst hills offer a range of different environments and vegetations patterns (Crowther, 1982; Furley & Newey, 1979). This could explain the higher diversity of plant species found compare to Monkey River where the topography is more or less flat and where the chemical and physical composition of the soil is more homogeneous. Therefore one could expect to find a limited number of species of which chemical and physical needs are those offered by this homogenous riparian forest. However, it