Status: Postprint (Author’s version)
Development and validation of a 3D kinematic-based method for determining
gait events during overground walking
Mohamed Boutaayamou
1,2, Cédric Schwartz
1, Vincent Denoël
1, Bénédicte Forthomme
1,
Jean-Louis Croisier
1, Gaëtan Garraux
3,4, Jacques G. Verly
2, and Olivier Brüls
1 1Laboratory of Human Motion Analysis, University of Liège (ULg), Liège, Belgium
2
INTELSIG Laboratory, Dept. of Electrical Engineering and Computer Science, ULg, Liège, Belgium
3Movere Group, Cyclotron Research Center, ULg, Liège, Belgium
4
Department of Neurology, University Hospital Center, Liège, Belgium
ABSTRACT
A new signal processing algorithm is developed for quantifying heel strike (HS) and toe-off (TO) event times solely from measured heel and toe coordinates during overground walking. It is based on a rough estimation of relevant local 3D position signals. An original piecewise linear fitting method is applied to these local signals to accurately identify HS and TO times without the need of using arbitrary experimental coefficients. We validated the proposed method with nine healthy subjects and a total of 322 trials. The extracted temporal gait events were compared to reference data obtained from a force plate. HS and TO times were identified with a temporal accuracy ± precision of 0.3 ms ± 7.1 ms, and –2.8 ms ± 7.2 ms in comparison with reference data defined with a force threshold of 10 N. This algorithm improves the accuracy of the HS and TO detection. Furthermore, it can be used to perform stride-by-stride analysis during overground walking with only recorded heel and toe coordinates.
Index Terms—3D, kinematic-based method, gait events, heel strike, toe-off, validation, walking. 1. INTRODUCTION
Accurate detection of temporal heel strike (HS) and toe-off (TO) events is a crucial step in 3D gait analysis. HS and TO are needed to determine the stance and the swing phases, which constitute essential data that could distinguish normal gait and pathological gait [1] and contribute to the understanding of motion disorders [2,3].
The HS and TO event times can be accurately determined by a force plate measuring ground reaction forces. However, the size and the relative position of the force plate are not always suitable for subjects with short step lengths (e.g., children, and patients with gait disorders), or with long step lengths (e.g., athletes) [4]. A trial with the force plate is considered successful when the subject is able to land with only one foot on the force plate, with this foot fully within it. In addition, an individual force plate can only measure the gait events from a single step, and thus the number of steps analyzed is limited by the number of available force plates [5,6].
Several kinematic-based methods have been proposed to extract HS and TO times during overground walking. ("Overground walking" is used by contrast with "treadmill walking".) Algorithms have been developed for identifying gait features from velocity [4,7,8] and acceleration derived from heel and toe positions [9]. These methods rely, however, on the numerical differentiation of position data, and may require that the data be smoothed as pointed out in [9]. Very few publications report both a method that extracts gait events directly from heel and toe coordinates and its validation against reference data provided by, e.g., a force plate. In [10], Zeni et al. introduced algorithms using the relative displacement between the sacral and foot markers to determine treadmill and overground gait events from coordinate data. Novel techniques based on miniature inertial sensors have also been validated and used to determine gait events during overground walking, e.g., [11,12].
This work is part of a project that deals with the 3D analysis of normal and pathological gait [12]. Neurologists specialized in human motion disorders are indeed very interested in the development of innovative, quantitative techniques, and their possible use in clinical practice, e.g. in the diagnostic and analysis of Parkinson’s disease.
In this paper, we present a new signal processing algorithm that automatically extracts HSkin and TOkin times
from only heel and toe coordinates measured by a kinematic 3D analysis system. We validate this kinematic-based method using nine healthy volunteers and a total of 322 trials against reference data (denoted HSref and TOref) provided by a force plate. Throughout the paper, the subscripts kin and ref refer to the developed method and to the reference method, respectively.
Status: Postprint (Author’s version)
2. METHODS AND MATERIALS 2.1. Participants and gait test procedure
Kinematic and force plate data were recorded during overground walking tests performed by nine healthy participants (8 males; 1 female; (mean ± standard deviation) age = 27±2.5 years; height = 180±7 cm; weight = 79±12 kg). All of them gave informed consent. The gait procedure of this paper is similar to the one reported in [12]. None of the participants suffered from any known gait and lower limb pathology. The participants started the walking tests after taking sufficient time to get used to the gait procedure. During the tests, they were asked to walk on a 12–m long track, at their preferred, self-selected usual speed, while looking forward (in the walking direction) and thus not paying attention to hitting the force plate. The duration of a single gait test was 60 s. The participants wore their own regular shoes. All of the walking tests were performed at the Laboratory of Human Motion Analysis (LAMH) of the University of Liège, Belgium.
2.2. 3D analysis systems and reference gait events
Simultaneous measurements of heel and toe marker coordinates and ground reaction forces were performed by a kinematic 3D analysis system (Codamotion system; Charnwood Dynamics; Rothley, UK), and a force plate (Kistler force plate; Kistler Instrument Corp.; Amherst, NY, USA), respectively.
The kinematic system is based on active optical technology; it can accurately measure the 3D positions of active markers placed in the body locations of interest. The force plate consists of a rectangular metal plate (400 mm x 600 mm), which is inserted into the track in the middle of the distance selected for walking tests [12]. Each corner of the plate is fitted with a piezoelectrical transducer capable of measuring ground reaction forces in the direction of the x-axis (horizontal), y-axis (transverse), and z-axis (vertical).
A force plate trial is considered successful when one whole foot (either left or right) hits the force plate, whereas the other foot does not hit this force plate. During each overground walking test, we collected simultaneous vertical ground reaction force data at 1,000 Hz, and marker position data at 400 Hz, both for heel (calcaneus) and toe (hallux) markers. The kinematic data were upsampled in order to match the sampling frequency of the plate force data (1,000 Hz).
The reference gait timing, HSref, is defined as being the timing of the first frame where the vertical force rises
above a given force threshold. TOref is defined as being the timing of the first frame where the vertical force drops
below a given force threshold. In this paper, the extraction of reference data is based on the following force thresholds: 5 % of BW (body weight) [12,13], 2% of BW, and 1% of BW, 10 N [1,4,7–9], and 5 N [1,4,8].
2.3. New signal processing algorithm
We developed a new signal processing algorithm to detect HS and TO times using recorded kinematic data. In this paper, we consider position signals in the sagittal plane. The proposed algorithm/method extracts automatically HS and TO from z-axis positions used in conjunction with x-axis positions.
The algorithm first detects the time intervals during which the right and left feet are on the ground, i.e., when the heel and toe markers are at rest. In this paper, we call "heel flat phase" the interval during which the heel marker is at rest, and "toe flat phase" that when the toe marker is at rest. These "flat phases" are characterized by x-axis position signals that are almost constant (Figs. 1(a)-(b)). Throughout, xh (xt) and zh (zt) are the measured positions along the x-axis and z-axis, respectively. The subscripts h and t refer to heel and toe, respectively.
The algorithm exploits, as follows, the endpoints of the flat phases to locally extract the gait events:
HSkin is automatically extracted using xh and zh (Fig. 1(a)). A time subinterval [t1 t7] is first determined: t1 is
the time of the local maximum of zh occurring before the heel flat phase; and t7 is the time of the middle of the heel
flat phase. The signals xh and zh are then restricted to [t1 t7] defining local signals in [t1 t7]. In order to estimate the locations of convex curvature in these local position signals (i.e., the transition regions of these segmented signals), we use a piecewise linear fitting method using two linear segments that best fit these position signals in the least-square sense (a detailed description is provided in Appendix A). These locations of convex curvature correspond to
the breakpoints I1 and I2. Their times are t2 and t3, respectively. We apply the previous linear fitting method twice
on the interval [max(t2, t3) t6], where t6 is the middle of [(max(t2, t3) t7]; the time of the corresponding breakpoint is
t4. It is then assumed that HSkin is estimated as follows
(1)
where t5 is the time of the local minimum in zh reached by the heel marker as the foot hits the ground.
TOkin is automatically identified using xt, zt, and zh (Fig. 1(b)). A time subinterval [t8 t11] is first determined: t8
is the time of the middle of the toe flat phase; and t11 is the time of the first local maximum of zh after the toe flat
Status: Postprint (Author’s version)
fitting method (see Appendix A) to the resulting local signal in order to estimate the location of convex curvature,
I3, in that local signal. The time of I3 is t10. We define TOkin as
(2)
where t9 is the time of the local minimum in zt reached by the toe marker as the toe leaves the ground.
Table 1
Accuracy (mean of the differences), precision (std. dev. of the differences), limits of agreement, 95% confidence interval (CI) of the differences, and 95% CI of the lower and the upper limits of agreement between the developed 3D kinematic-based method and the reference method (with various force thresholds), for gait events obtained in a total of n=322 trials.
Thresholds defining HSref and TOref
Accuracy (ms)
(Precision (ms)) agreement (ms) Limits of differences (ms) 95% CI of the lower limit (ms) 95% CI of the upper limit (ms) 95% CI of the Nbr. of trials
HS 5% of BW 2% of BW 1% of BW 10N 5N TO 5% of BW 2% of BW 1% of BW 10N 5N
3. RESULTS AND DISCUSSION
The developed 3D kinematic-based method was successfully employed to automatically extract the HSs and TOs from a total of 322 trials performed by nine healthy volunteers. The agreement between the new method and the reference method was investigated using Bland-Altman analysis. In addition, the accuracy and the precision of detection are computed as the mean and the standard deviation (std. dev.) of the differences between these gait event times, i.e., HSkin – HSref and TOkin – TOref.
Table 1 provides a quantitative one-by-one comparison of gait events considering different force thresholds.
Because of the limited number of extracted TOref, the number of trials was not always the same but was
either 266 or 322.
Results of HSkin and TOkin were comparable across the different force thresholds. The accuracy and precision of
HSkin detection ranged from −6.0 ms to 1.2 ms, and 6.9 ms to 7.6 ms, respectively. The accuracy and precision of
TOkin detection ranged from −6.4 ms to 15.9 ms, and 6.9 ms to 8.1 ms, respectively. Given the sampling frequency
400 Hz of the recorded marker positions, the accuracy and the precision of detection are less than the durations of 1 frame (2.5 ms) and 3 frames (7.5 ms) for a force threshold of 10 N, respectively.
Figs. 2(a)–(b) show the Bland-Altman plots with reference data defined by a threshold force of 10 N. We observe very small systematic biases in accordance with the accuracy of detection provided in Table 1. In addition,
the limits of agreement (i.e., mean ± 1.96 std. dev. limits of agreement of the differences HSkin – HSref and TOkin –
TOref) and their associated 95% confidence interval exhibit small variations in the times of gait events (see table 1).
The experimental results show a good agreement between the new signal processing algorithm and the reference, and demonstrate an accurate and precise detection of HS and TO times in a group of healthy people.
The validation of the extraction of HSkin relies on the existence of a local minimum (in zh) reached by the heel
marker as the foot hits the ground. This local minimum was present in all subjects. We also verified the presence of this local minimum in five gait trials performed by one subject who walked barefoot. Similarly, the local minimum (in zt) reached by the toe marker as the toe leaves the ground was consistent in all subjects. In addition, the proposed algorithm/method is robust with respect to the type of insoles, which can be either quite stiff or quite soft.
The piecewise linear fitting method is completely automatic since it only uses the associated subinterval boundaries as inputs without, e.g., the need for empirical threshold values. To underline the benefit of the detection of HSkin, as proposed in [14,15], we introduce HSkin2 as a new definition of HSkin based only on the time of the
Status: Postprint (Author’s version)
(3)
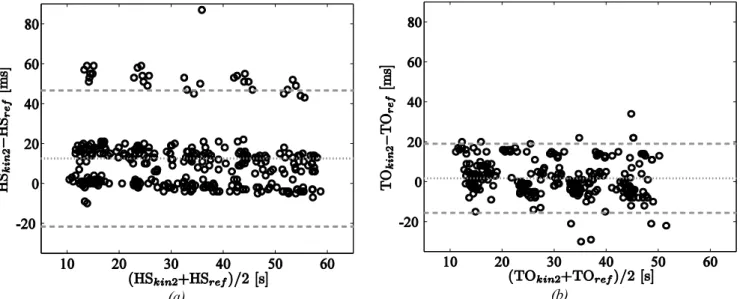
Fig. 3(a) shows the Bland-Altman plot of HSkin2 against reference data obtained with a force threshold of 10 N.
HSkin2 was detected with an error of 12.5 ms ± 17.4 ms, limits of agreement of [−21.6 ms 47.3 ms] (i.e., mean ±
1.96 std. dev. limits of agreement of the difference HSkin2 – HSref), and the 95% confidence interval of the difference, HSkin2 – HSref, of [10.6 ms 14.4 ms]. The comparison of these results with those of HSkin given in Table 1 and in Fig. 2(a) (for the same force threshold, i.e., 10 N), reveals that the proposed piecewise linear fitting
method improves significantly the accuracy and precision of detection of HSkin.
Similarly, TOkin can be replaced by TOkin2 defined as [11]
(4)
TOkin2 does not then take into account the result of the piecewise linear fitting method. The results of its comparison
to reference data (with the force threshold of 10 N) are shown in Fig. 3(b). TOkin2 is determined with an error of
1.7 ms ± 8.8 ms, limits of agreement of [−15.6 ms 19.3 ms] (i.e., mean ± 1.96 std. dev. limits of agreement of the difference TOkin2 – TOref), and the 95% confidence interval of the difference, TOkin2 – TOref, of [0.6 ms 2.7 ms].
From these results and those of TOkin in Table 1 and in Fig. 2(b), we observe no relevant differences between TOkin
and TOkin2. Nevertheless, we could expect that TOkin would be better than TOkin2 in case of abnormal gait.
4. CONCLUSIONS AND FUTURE WORK
The proposed 3D kinematic-based method is suitable for the detection of HS and TO times from only measured heel and toe coordinates during overground walking. It is based on an innovative piecewise linear fitting method that identifies accurately HS and TO times in local position signals without the need of applying arbitrary experimental coefficients.
We validated the 3D kinematic-based method on a set of nine young and healthy subjects, with a total of 322 trials. Based on different force thresholds, the reference gait event times‒used in the validation‒were extracted from vertical ground reaction forces measured by a force plate. The experimental results show that the developed method has the advantage to define relevant signal subregions in which gait event times are locally extracted with high accuracy and precision. A stride-by-stride analysis can be then carried out accurately in normal overground gait using only heel and toe coordinates.
Because the validation is based on reproducible relevant signal subregions where HS and TO times are extracted, we could expect that the proposed method would be robust for pathological overground walking and for treadmill running. Further studies are needed to investigate these hypotheses.
APPENDIX A
We present the piecewise linear fitting method used to estimate the locations of the convex curvature in a signal
(Sec. 2.2.). For this, we consider a given signal defined in a time interval
, where N is the total number of samples of . This method first computes the coefficients of piecewise linear functions with two linear segments that best fit in the least-square sense, leading to the computation of least-square errors. The minimum of these least-square errors is then determined and the associated
piecewise linear function provides linear segments that intersect at the breakpoint An illustration of
this method is given in Fig. 1(a), where I corresponds to and to .
The main steps to determine the breakpoint are as follows:
For each , one computes the coefficients of a piecewise linear function that
best fits by minimizing
(5) where
This error can be expressed as
(6) where and
Status: Postprint (Author’s version)
The normal equations associated with (3) are
(7)
Solving (4) leads to the coefficients
Finally, one obtains the breakpoint by determining the minimum of the least-square errors, i.e.,
(8)
12. REFERENCES
[1] J.M. Hausdorff, Z. Ladin, and J.Y. Wei. Footswitch system for measurement of the temporal parameters of gait. Journal of Biomechanics, 28(3):347–351, 1995.
[2] M. Whittle. Gait analysis: an introduction. Butterworth-Heinemann, Oxford, UK, 1991.
[3] K. Endo and H. Herr. Human walking model predicts joint mechanics, electromyography and mechanical economy. IEEE/RSJ International Conference on Intelligent Robots and Systems, pages 4663–4668. IEEE, 2009.
[4] J. Mickelborough, M.L. Van der Linden, J. Richards, and A.R. Ennos. Validity and reliability of a kinematic protocol for determining foot contact events. Gait & Posture, 11(1):32–37, 2000.
[5] S.J. Stanhope, T.M. Kepple, D.A. McGuire, and N.L. Roman. Kinematic-based technique for event time determination during gait. Medical and Biological Engineering and Computing, 28(4):355–360, 1990.
[6] P.M. Mills, R.S. Barrett, and S. Morrison. Agreement between footswitch and ground reaction force techniques for identifying gait events: inter-session repeatability and the effect of walking speed. Gait &
Posture, 26(2):323–326, 2007.
[7] S. Ghoussayni, C. Stevens, S. Durham, and D. Ewins. Assessment and validation of a simple automated method for the detection of gait events and intervals. Gait & Posture, 20(3):266–272, 2004.
[8] C.M. O’Connor, S.K. Thorpe, M.J. O’Malley, and C.L. Vaughan. Automatic detection of gait events using kinematic data. Gait & Posture, 25(3):469–474, 2003.
[9] A. Hreljac and R.N. Marshall. Algorithms to determine event timing during normal walking using kinematic data. Journal of Biomechanics, 33(6):783–786, 2000.
[10] J.A. Zeni, J.G. Richards, and J.S. Higginson. Two simple methods for determining gait events during treadmill and overground walking using kinematic data. Gait & Posture, 27(4):710–714, 2008.
[11] B. Mariani, S. Rochat, C. Bula, and K. Aminian. Heel and toe clearance estimation for gait analysis using wireless inertial sensors. IEEE Transactions on Biomedical Engineering, 59(11):3162–3168, 2012.
[12] M. Boutaayamou, C. Schwartz, J. Stamatakis, V. Denoël, D. Maquet, B. Forthomme, J.-L. Croisier, B. Macq, J. Verly, G. Garraux, and O. Bruls. Validated extraction of gait events from 3D accelerometer recordings.
International Conference on 3D Imaging (IC3D), pages 1–4. IEEE, 2012.
[13] B. Mariani, H. Rouhani, X. Crevoisier, and K. Aminian. Quantitative estimation of foot-flat and stance phase of gait using foot-worn inertial sensors. Gait & Posture, 37(2):229–234, 2013.
[14] P.I. Pappas, M.R. Popovic, T. Keller, V. Dietz, and M. Morari. A reliable gait phase detection system. IEEE
Transactions on Neural Systems and Rehabilitation Engineering, 9(2):113–125, 2001.
[15] M. Roerdink, B.H. Coolen, B.H. Clairbois, C.J. Lamoth, and P.J. Beek. Online gait event detection using a large force platform embedded in a treadmill. Journal of Biomechanics, 41(12):2628–2632, 2008.
Status: Postprint (Author’s version)
(a) (b)
Fig. 1. The 3D kinematic-based method extracts (a) HS and (b) TO from position data of heel and toe makers (in the sagittal
plane). The reference data are extracted from vertical ground reaction force signals that are synchronized with the position signals.
(a) (b)
Fig. 2. Bland-Altman plots of (a) the HS and (b) the TO measured by the 3D kinematic-based method and by the reference
method for a force threshold of 10 N, with mean (dotted line) ± 1.96 std. dev. limits of agreement (dashed lines) of differences HSkin – HSref and TOkin – TOref.
(a) (b)
Fig. 3. Bland-Altman plots of (a) the HS and (b) the TO measured by the 3D kinematic-based method without using the
piecewise linear fitting method (see Appendix A) and by the reference method for a force threshold of 10 N, with mean (dotted line) ± 1.96 std. dev. limits of agreement (dashed lines) of differences HSkin2 – HSref and TOkin2 – TOref.