DEVELOPMENT OF A NEW DESIGN METHOD
TO DEFINE THE ROTATION CAPACITY OF
STEEL HOLLOW SECTIONS
A thesis
Submitted in fulfillment of the requirements for the degree
Of
Doctor in Applied Sciences
From Liège University
And
Doctor in Civil Engineering
From Saint-Joseph University
By
ELSY SALOUMI
– i –
MEMBERS OF THE JURY
M. Benjamin Dewals (President of the jury) University of Liège, Department Argenco Chemin des Chevreuils, 1 B52
B – 4000 LIEGE – Belgium M. Jean-Pierre Jaspart (Supervisor) University of Liège, Department Argenco Chemin des Chevreuils, 1 B52
B – 4000 LIEGE – Belgium M. Fadi Geara (Supervisor)
Saint-Joseph University USJ, Engineering Faculty ESIB Technologies and Sciences Campus, Mar Roukoz, Mkalles Riad El Solh, Beyrouth, 11 07 2050 – Lebanon
M. Nicolas Boissonnade (Supervisor)
Laval University, Civil and Water Engineering Department Adrien Pouliot Bldg., Office 2928G
1065, Avenue de la Médecine Quebec, Canada G1V 0A6 M. Graham Couchmann Steel Construction Institute
Imperial College London, Silwood Park Campus Buckhurst Rd, Ascot SL5 7QN
United Kingdom M. Markus Knobloch Bochum University
Faculty of Civil and Environmental Engineering Department of steel, light and Composite Construction Building IC 5-59
Universitätsstraße 150, 44801 Bochum, Germany M. Jean-Francois Demonceau
University of Liège, Department Argenco Chemin des Chevreuils, 1 B52
– iii –
‘Success is not final, failure is not fatal: it is the courage to continue that counts’
– v –
ACKNOWLEDGMENTS
The achievement of my PhD thesis: “Development of a new design method to define the rotation capacity of steel hollow sections” could not have been possible without the valuable contribution of a large number of people:
I would like to express my appreciation and thanks to my supervisor Prof. Nicolas Boissonnade, for his guidance and support during my PhD thesis and for increasing my knowledge throughout his expertise. I would also like to thank him for encouraging and motivating me.
I also express my gratitude for my PhD directors, Prof. Jean-Pierre Jaspart and Prof. Fadi Geara for their encouragements and advices that were necessary for my progress through my doctoral program.
I would also like to thank Dr Tak-Ming Chan for offering me the opportunity to do an exchange program at the Hong Kong Polytechnic University. I thank him for his valuable comments that have allowed me to question my results and to achieve better analysis. I would also like to thank him for making my stay there very enjoyable.
I am very grateful for my colleagues and friends for all the wonderful moment we spent together that distracted me from work, especially though the difficult moments of the PhD. Finally I would like to thank my family and my husband for their infinite support every step of the way, and for bearing with me during the most difficult times.
– vii –
ABSTRACT
The present PhD thesis is dedicated to the characterisation of hollow section shapes’ rotational capacity. More precisely, the effort was made towards suggesting new ways to resort to plastic analysis, by defining a new and accurate proposition to characterise the rotation capacity Rcap of sections, which could be associated with the rotation demand of a
structure Rdem. Therefore, the purpose of this thesis is to establish a direct dependence of the
rotation capacity Rcap with a newly defined cross-section slenderness CS. Hence, current
design standards disregard the rotation demand of the structure and allow plastic analysis based on a plate slenderness limit.
To achieve this purpose, an experimental campaign was performed consisting in 23 bending tests on square and rectangular hollow sections tested in bending, in addition to 8 stub columns. Then, a numerical model based on the finite element software FINELg was calibrated to well represent these experimental tests, as well as cold-formed bending tests from literature. Based on these results, a good agreement between experimental and numerical results was shown and the numerical software was therefore validated.
Accordingly, since the numerical software was proved to well represent the bending behaviour of hollow beams, around 8000 finite element simulations were performed while varying sections dimensions, material properties and loading configuration. These results reported that actual standards limitations were inappropriate, and stricter values were proposed. Moreover, based on the numerical computations, a continuous curve capable of describing the rotation capacity of sections as a function of the cross-section slenderness was proposed. The production route, loading application and yield strength were identified as key parameters having a major impact on the rotation capacity of sections. Consequently, different curves were proposed for each parameter; based on these curves, the rotation capacity of the section could be compared to the rotation demand of a structure in order to obtain a practical, safe, and reliable design calculation.
Table of content – 9 –
TABLE OF CONTENT
ACKNOWLEDGEMENTS ...v ABSTRACT ... vii NOTATIONS ... xiii 1 INTRODUCTION... 182 STATE OF THE ART ... 22
2.1 Plastic resistance ... 22
2.1.1 Brief review on the history of plastic behaviour of steel ... 22
2.1.2 Plastic moment calculation: ... 24
2.1.3 Elastic and inelastic behaviour of plates ... 25
2.1.4 Definition of rotation capacity ... 28
2.2 Plastic analysis ... 29
2.2.1 Behaviour of a simply supported beam: ... 29
2.2.1.1 Beam under uniform moment ... 30
2.2.1.2 Beams under moment gradient: ... 31
2.2.2 Rotation capacity quantification and sensibility ... 32
2.2.3 Basics of plastic design ... 34
2.2.4 Required rotation capacity ... 35
2.3 Plastic design ... 39
2.3.1 Treatment and background of main design codes ... 39
2.3.1.1 Slenderness limits ... 39
2.3.1.2 Material requirements ... 44
2.3.2 Currents shortcoming and aim of the thesis ... 45
Table of content
– 10 –
3 EXPERIMENTAL PROGRAM ... 51
3.1 General description, objective and test program ... 51
3.1.1 Cross-sectional dimensions ... 53
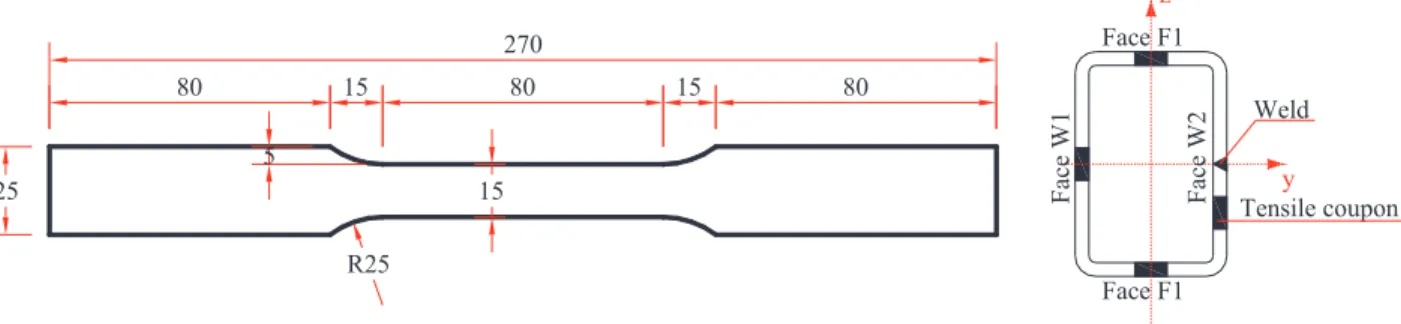
3.1.2 Tensile tests ... 56
3.1.3 Stub column tests ... 59
3.2 Bending tests ... 62
3.2.1 3-point bending tests ... 62
3.2.2 4-point bending tests ... 68
3.2.3 Propped-cantilever centrally loaded ... 74
3.2.4 Propped-cantilever off-centrally loaded ... 82
3.3 Conclusions ... 85
4 DEVELOPMENT AND VALIDATION OF FINITE ELEMENT MODELS ... 87
4.1 General scope ... 87
4.2 Assessment toward documented test data ... 87
4.2.1 Validation against tests performed at the University of Applied Sciences of Western Switzerland – Fribourg ... 87
4.2.1.1 Mesh density ... 90
4.2.1.2 Support conditions ... 94
4.2.1.3 Introduction of loading ... 96
4.2.1.4 Sensitivity to geometrical Imperfections ... 97
4.2.1.5 3-point and 4-point bending tests ... 101
4.2.1.6 Propped cantilever arrangements ... 107
4.2.2 Experimental tests performed at the University of Sydney ... 115
4.2.2.1 Numerical model characteristics ... 116
4.2.2.2 Validation of F.E. models ... 118
4.3 Conclusions ... 122
Table of content
– 11 –
5.1 Modelling considerations... 124
5.1.1 Material model for hot-formed and cold-formed tubes ... 124
5.1.2 Boundary conditions ... 128
5.2 Comprehensive analysis ... 129
5.2.1 Beam subject to a constant moment... 129
5.2.2 Mesh density studies ... 133
5.2.3 Length variation sensitivity when constant moment is applied ... 137
5.2.4 Effect of residual stresses ... 145
5.2.5 Imperfection variation ... 150
5.2.6 Influence of yield stress to ultimate stress ratio ... 159
5.3 Parametric analysis ... 163
5.3.1 Parameters considered ... 163
5.3.2 Results ... 165
5.3.2.1 Hot-formed sections – Constant bending moment ... 165
5.3.2.2 Cold-formed sections – Constant bending moment ... 171
5.3.2.3 Hot-formed sections in 3-pt bending configuration ... 177
5.3.2.4 Cold-formed sections in 3-point bending configuration ... 187
5.4 Conclusions ... 190
6 PROPOSED DESIGN FORMULATIONS ... 192
6.1 Hot-formed sections, constant bending moment ... 193
6.2 Cold-formed sections, constant bending moment ... 200
6.3 Hot-formed sections, moment gradient ... 209
6.4 Cold-formed sections, moment gradient ... 212
6.5 Summary of recommendations ... 218
6.5.1 Hot-formed sections ... 218
Table of content – 12 – 6.6 Worked example ... 220 6.6.1 Example 1 ... 220 6.6.2 Example 2 ... 221 6.7 Concluding remarks ... 222
7 CONCLUSIONS AND FUTURE STEPS ... 223
8 REFERENCES ... 227 9 LIST OF FIGURES ... 234 10 LIST OF TABLES ... 247 11 APPENDICES ... 249 11.1 APPENDIX 1 ... 249 11.2 APPENDIX 2 ... 255 11.3 APPENDIX 3 ... 260
– xiii –
NOTATIONS
Abbreviations:
AISC American Institute of Steel Construction
AS Australian standard
CF Cold-formed
CSM Continuous Strength Method
EC3 Eurocode 3
EN European Standard
FE Finite Element
GMNIA Geometrically, materially nonlinear analysis with imperfections
HF Hot-formed
LBA Linear buckling analysis
LVDT Linear Variable Displacement Transducer
OIC Overall Interaction Concept
PR_C Propped cantilever centrally loaded
PR_O Propped cantilever off-centrally loaded
RHS Rectangular Hollow Section
SHS Square Hollow Section
3pt Three point bending configuration
4pt Four point bending configuration
Latin letters:
A Section’s area
A0 Original cross-sectional area
– xiv –
bmes Experimental average measured width of a section
DM Beam deflection at mid span
DL Beam average deflection at the loading points
E Young’s modulus of elasticity
Et Tangent modulus of steel
ELVDT Young’s modulus from LVDTs
ESG Young’s modulus from strain gauges
f Stress
fu Material ultimate stress
fu,corner Material ultimate stress in the corner region of the section
fy Material yield stress
fy,corner Material yield stress in the corner region of the section
F Applied force
Fult,exp Applied force at ultimate load for experimental tests
Fult,FE Applied force at ultimate load for numerical simulations
h Section depth
hmes Experimental average measured depth of a section
Iy Moment of inertia about the strong axis
k, k Plate buckling coefficient
L Length
Mcrit Critical bending moment of a cross-section
MEd Design value of the applied bending moment
Mel Elastic cross-section resistance for pure bending moment Mpl Plastic cross-section resistance for pure bending moment
– xv –
Mult Bending moment at ultimate load
Mult,span Bending moment at ultimate load at span
Mult,fixed end Bending moment at ultimate load at the fixed-end
Mmax Maximum reached moment
N Axial force
Nx In plane stress according to x direction
Npl,fy Plastic cross-section resistance for pure axial force calculated from
actual measured material yield stress
Npl,fy=355 Plastic load for pure axial force calculated from nominal material yield
stress that is equal to 355 N/mm2
Pult Ultimate value of the applied load
Pult,exp Ultimate value of the applied load for experimental tests
Pult,FE Ultimate value of the applied load for numerical simulations
Ppl Theoretical plastic collapse load of the system
Py Elastic load of the system
r Corner radius at the neutral axis
re External curvature radius
ri Internal curvature radius
Rcap Rotation capacity of a section
Rdem Rotation demand of a structure
RRESIST Resistance load multiplier
RSTAB Critical load multiplier
RSTAB,CS Critical load multiplier of a cross section
RSTAB,MB Critical load multiplier of a member
t Thickness
– xvi –
tf thickness of the flange of an I section
tw thickness of the web of an I section
VEd design shear force
Vpl,Rd plastic design shear resistance
w Deflection of local panel
Wpl Plastic section modulus
Wel Elastic section modulus
Greek letters:
δc Corrected stub column end-shortening
δLVDT End-shortening recorded by LVDTs
Yield factor equal to 235
y
f
f Elongation at failure
y Material yield strain
y2 Material strain at end of the yield plateau
u Material strain at ultimate stress
50 Elongation on a 50.8 mm gauge length
ϕ Safety factor from AISC standard
M Safety factor from EC3 standard
Beam’s end rotation
y Yield rotation
pl Plastic rotation
pl2 Beam’s rotation after the ultimate load has been attained and when the
plastic moment is reached again
– xvii –
u,a Rotation at side a of the tested specimen at ultimate load
u,b Rotation at side b of the tested specimen at ultimate load
rel Generalised overall relative slenderness
λcs Cross-section slenderness λp Plate slenderness Curvature y Yield curvature ST
Curvature at the beginning of strain hardeningLVDT Measured curvature from LVDTs measurements
gauges Measured curvature from strain gauges recording
σ Stress
σ0.2 0.2% proof stress
σcr Critical stress
σult Ultimate stress
σy Yield stress
Poisson’s ratio
v Deflection
vu Deflection at ultimate load
vu,a Deflection under the loading point a of the tested specimen
vu,b Deflection under the loading point b of the tested specimen
Buckling reduction factor
CS Cross-section reduction factor
Introduction
– 18 –
1 INTRODUCTION
Steel hollow sections are being more and more used in structural applications. This is due to both their aesthetic and static properties. Hence, hollow structural sections require less paint than open profile and also less maintenance cost since, for example, the water cannot accumulate on the flanges… Moreover, hollow sections possess a high torsional stiffness compared to that of wide flange beams and thus require less lateral-torsional restraints. Nowadays, in order to take advantage of the full capacity of a structure, plastic design is starting to be more and more exploited mainly in the U.K. and North America. Structures loaded in bending, and where deflections are not significant, are the structures that benefit the most from plastic design.
Plastic analysis requires that a beam is able to attain its plastic moment Mpl and maintain it
through a range of deformations, in order for the moment to be redistributed. This will allow a collapse mechanism to form without exhibiting local buckling in the cross sections.
This thesis is related to the rotational capacity of rectangular and square hollow sections. The main aim of this research work is to investigate new ways of defining the possibility to resort to a plastic analysis in practical design, and to improve current procedures and recommendations, in order to obtain a more consistent and mechanical approach.
Nowadays, major design standards allow designers to resort to a so-called “plastic analysis and design” on the sole (direct or indirect) determination of the rotation capacity of a section while disregarding the rotation demand of the structure. Furthermore, most codes suggest individual b / t ratios of the individual plates comprised within the section to give the cross-section overall response, regardless of many parameters such as moment distribution (gradient), level of shear, ultimate-to-yield stress, height-to-length ration, ductility reserves…. In addition, the section’s constituent plates are being considered under ideal support conditions, i.e. webs and flanges are assumed as pinned-pinned.
Current developments take place in the context of the development of the Overall Interaction Concept (O.I.C.) [1]. One of the main features of the O.I.C. is the generalised overall relative slenderness λrel (Equation 1.1), that allows to account for the behaviour of the whole
Introduction – 19 – RESIST rel STAB R R l = 1.1
RRESIST represent the factor by which the initial loading has to be multiplied to reach the pure
resistance limit, and RSTAB is the factor used to reach the buckling load of the ideal member
(stability limit).
The O.I.C. is a new design approach that aims at a straightforward design check of the stability and resistance of steel members. Based on the use of a generalized relative slenderness λrel and so-called interaction buckling curves, it can be applied in a similar
manner to cross-section and to member verifications. The relative slenderness value λrel
would lead to the determination of a χ value called “reduction factor” that represents the penalty due to instability effects on the pure resistant behaviour. The O.I.C. steps and procedure is represented in Figure 1.1.
The O.I.C., among other things, is meant to remove the preliminary “Cross-section classification” design step, i.e. the classification of the cross-section into plastic (so-called “class 1” in European standards Eurocode 3), compact (class 2), semi-compact (class 3) or slender (class 4). This is achieved within the O.I.C. through the generalised overall relative slenderness λrel, and through associated cross-section interaction curves that lead to a smooth
and continuous definition of the cross-sectional capacity. Consequently, the classification step becomes obsolete and disappears in the O.I.C. approach, avoiding many practical difficulties, inaccuracies and inconsistencies.
Introduction
– 20 –
Figure 1.1 – OIC steps; CS represents the cross-section reduction factor; CS+MB represents the member
reduction factor; M and represent safety factors
With the disappearance of the classification system, the criterion allowing the designer to perform a plastic analysis (formerly allowed for class 1 sections) disappears as well. Therefore, the need to “re-introduce” such a criterion is clear, and is dealt with in this thesis. In current work, the generalised overall relative slenderness λrel will be referred to as the
cross-section slenderness CS, since only the cross section behaviour of hollow sections is
studied in simple bending. CS therefore constitutes a measure of the cross-section sensitivity
to local buckling.
The basic idea developed in the present thesis consists in an extended use of λCS factor to
define two families of sections:
sections allowing for plastic analysis and design (“class 1” sections, possessing sufficient rotational capacity for a plastic failure mechanism to develop);
Introduction
– 21 –
other sections for which the extent of local buckling precludes the attainment of sufficient ductile deformation for the development of a plastic mechanism, so that plastic analysis is to be avoided.
In other words, this thesis addresses the possibility to define limit values of λCS as a function
of key parameters in order to replace the Rdem vs. Rcap criterion (see Figure 1.2), where Rdem is
the rotation demand and Rcap is the rotation capacity.
Figure 1.2 – Criterion to allow for plastic analysis
In this respect, the state of the art of present research will be presented along with current codes shortcoming to justify the aim of this thesis. Then, an experimental campaign to characterise the rotation capacity of beams will be detailed, and the numerical software will be calibrated against these tests, in order to use it extensively in a numerical campaign. The numerical campaign will aim at characterizing the cross-section rotational capacity for which many parameters play a significant role such as section slenderness, shear, yield strength,
L / h ratio… After defining trends and lead parameters, the rotation capacity will be linked to
the cross section slenderness CS. In that way, sections that are capable to maintain their plastic moment to the minimum rotation requirements will be selected, i.e. depending on the rotation demand of a structure.
State of the art
– 22 –
2 STATE OF THE ART
2.1 Plastic resistance
2.1.1 Brief review on the history of plastic behaviour of steel
In the nineteenth century, the design concept of steel structures was only based on the theory of elasticity. The basis of elastic design is attributed to Hooke’s law (1635-1703), which states that stress is proportional to strain.
First tests were performed in order to affirm the elastic behaviour of steel beams, and the first yielding was considered as the limit load. According to Lay’s notes [2], the theory of elasticity was confirmed due to two factors. The first factor being that the non-linear (inelastic) behaviour of the beam (after it reached its yield moment) was regarded as the beam failure. Hence, the point when first yielding occurred was considered as the limit load. On this subject, Lyse and Godfrey (1934) [3] wrote: “Since the usefulness of beams is
determined by the maximum load it can contain without excessive deflection, the determination of its yield point becomes the most important factor in testing.... The ultimate load has little significance beyond the fact that it is a measure of the toughness of the beam after it has lost its usefulness.... The yield point strength of the beam was used as the criterion for its load-carrying capacity”. The second factor that led to confirm the elastic theory was
that since open section were preliminary tested, the specimen was insufficiently braced against lateral torsional buckling which resulted in premature yielding (before the beam reached the plastic moment).
In order to demonstrate the applicability of plastic analysis to structural design problems, intensive research, both theoretical and experimental, was performed worldwide. The experimental work conducted was mainly on prototype structures mostly constituted by standard wide flange and I sections made from structural steel.
Ewing (1899) [4] was the first to mention the plastic theory and suggested a plastic distribution of the stress along the section. His suggestion remained a theory since no recorded tests were performed to confirm it. He stated that if the bending moment was increased beyond the elastic moment Mel, then: “the outer layers of the beam are taking
State of the art
– 23 –
small addition to the stressproduces a relatively very large amount of strain”. Ewing [4] also
determined the full plastic moment of a rectangular cross-section to be equal to bh2 / 4 fy,
where b represents the width of the section, h the height and fy the yield stress.
Probably, Meyer (1908) [5] conducted the first experiments to evidence the plastic behaviour of beams. Meyer tested simply supported beams of rectangular cross section with single point loads and noticed that once the plastic moment Mpl is reached, the deflection increases
rapidly.
Kazinczy (1914) [6] may have been the first to suggest that due to the section plastification, a plastic hinge is developed. He tested H-shaped beams loaded uniformly and fixed on both ends by encasing them in concrete. He concluded that the system ultimate load is not reached until three plastic hinges are formed. He proposed to analyse static indeterminate structures with the use of a ‘plastic solution’.
Kist (1920) [7] proposed the elastic-perfectly plastic law material (which is still used nowadays for hot formed steel) in order to calculate the ultimate load. In 1926, moment redistribution and the ultimate load theory was developed theoretically by Grüning (1926) [8].
The most known of the early researchers on plastic behaviour of beams was Maier-Leibnitz (1928, 1929) [9], [10]. He performed tests on simple, continuous and fixed-end beams and observed a considerable ductile behaviour. He then underwent some theoretical investigations based on the ideal plastic material law.
In 1930, Fritsche [11] was the first to derive equations for the plastic bending moment Mpl of
rectangular and H-shaped cross-sections in the case of pure bending. He also concluded that for hot formed sections, no strain hardening is to be expected at low levels of strains and that 99% of the plastic moment Mpl is reached at a strain of 4-5%. Moreover, based on test by
Meyer (1908) [5], Maier-Leibnitz (1928) [9] and Schaim (1930) [12], Fritsche concluded that the yield stress of mild steel represents the most critical parameter for the calculation of the ultimate load.
In 1931 and 1932, Girkmann [13] suggested a plastic design method for indeterminate frameworks that were based on his own tests, and wrote: ‘Apart from the savings in weight
State of the art
– 24 –
moments, to even out the differences in the thicknesses of the cross-sections required and hence to simplify the construction details and reduce their costs’.
Being inspired by the ultimate load test performed by Maier-Leibnitz, Baker and Roderick (1938, 1940) [14], [15] extended plastic analysis to complete structures, and tested small scales portal frames. They found that portal frames had a big reserve in strength compared to the point were the first yield is developed, and that large deflections only occur after a mechanism is formed. Their research resulted in the incorporation of the design of steel structures according to the ultimate load method in the British standard 449 in 1948.
Research into plastic design continued in Cambridge after World War 2. The first book on plastic theory of structural steel work was then published in 1956 by Baker &al [16]. This book summarised 10 years of research in the Cambridge University, the fundamental theorem of the ultimate load theory and provided a large list of references. By 1960, the plastic design method was widely accepted by the engineering community although some critics still remained.
In the 1970s, and even while some critics remained, the plastic theory was solid enough, and was promoted in the European recommendations for the plastic design of structural steel structures, mainly by Massonnet (1976) [17].
In the United States and at Lehigh University, a wide scope of investigation on plastic design of structures constructed from I-sections was performed in 1940-1960. The research program included tests on beams, large scale multi-story braced and unbraced frames, and developed design aids for use in plastic design. Results are mainly summarised by Driscoll et al. (1965) [18] and Galambos (1968) [19]. The Lehigh research forms the basis of the plastic design rules found in many steel design specifications in America and in Australia.
2.1.2 Plastic moment calculation:
When a beam is tested in bending, its deformation induce beam rotation denoted , curvature
and strains . All these values that quantify the beam deformation are proportional and can be linked altogether. These deformations result in internal forces within the beam such as bending moments.
The plastic moment denoted Mpl is defined as the moment at which the entire cross section
State of the art
– 25 –
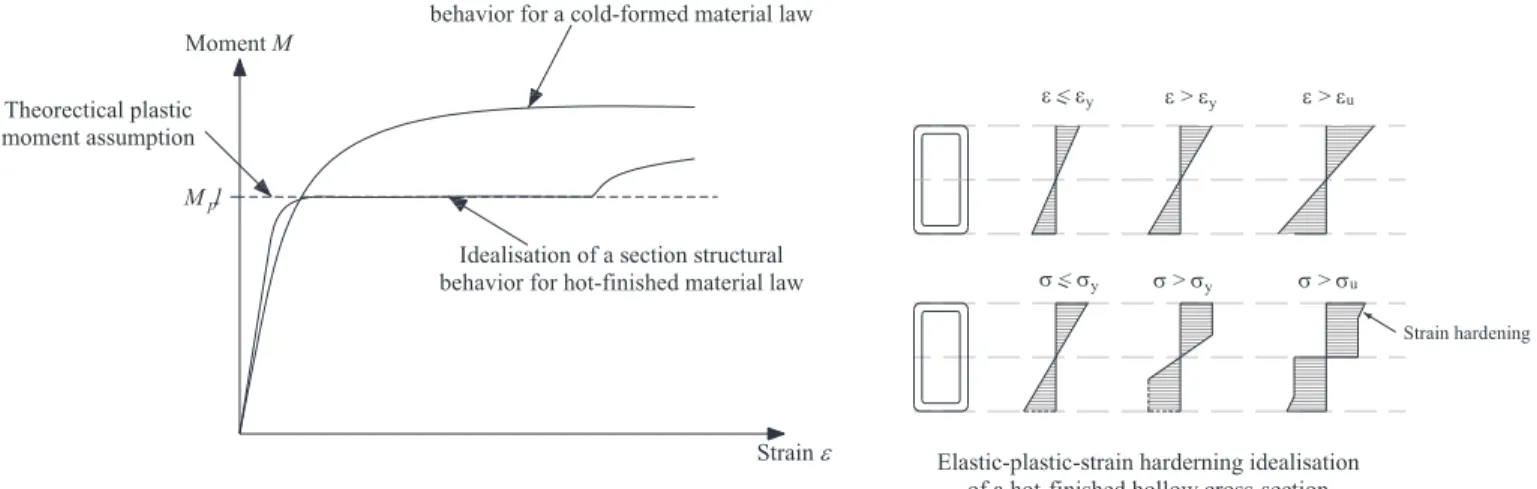
tested in bending, when strain hardening is reached, the plastic moment is exceeded. For hot-formed sections, strain hardening is initiated at high rotations values (also high strains and high curvatures); it is at this moment that the stress can exceed the yield stress. In the case of cold-formed RHS, strain hardening is reached directly after yielding; since there is no plastic plateau, the stress increases beyond the plastic moment Mpl at low strains.
In this thesis, for determining the plastic moment, steel is idealised as an elastic-perfectly plastic material for both hot-formed and cold-formed material law.
< y > y > u
Moment M
Mpl
Strain Idealisation of a section structural behavior for hot-finished material law
Idealisation of a section structural behavior for a cold-formed material law
Theorectical plastic moment assumption
< y > y > u
Strain hardening
Elastic-plastic-strain harderning idealisation of a hot-finished hollow cross-section
Figure 2.1 – Idealised moment-strain behaviour of a hollow cross-section
2.1.3 Elastic and inelastic behaviour of plates
To determine the ultimate capacity of a section, two primary concerns should be investigated: the first one deals with the strength of the section, i.e. the section plastic resistance defined in § 2.1.2; the second one deals with the ability of the section to support a specified load without undergoing instabilities. A brief review on the elastic and inelastic behaviour of plates is described hereafter.
To determine the elastic local buckling of thin rectangular plate, we can consider a long plate of width b and thickness t, with in plane stressN , asx shown in Figure 2.2. The plate can
State of the art – 26 –
b
w Nx NxFigure 2.2 – Local buckling of a rectangular plate
The differential equation for elastic local buckling of the plate is given by Bryan (1891) [20], where E is the modulus of elasticity, υ is poisson’s ratio:
3 4 4 2 2 2 4 2 2 2 4 2 12(1 ) x Et w w w w N x x y y x 2.1
The solution for the elastic local buckling stress cris given by:
2 2 2 2 2 12 1 / / cr k E H b t b t 2.2Where k is the plate buckling coefficient which depends on the nature of the stress distribution across the plate and on the support conditions of the plate. Figure 2.3 shows the k values for simply supported plates subject to compression or bending. These two loading cases represent the cases of flanges and webs of rectangular and square hollow sections (RHS and SHS).
State of the art – 27 – Boundary conditions 4.00 23.9 30 20 10 0 0 1.0 2.0 3.0 kmin=4.00 kmin=23.9 k [-] a/b [-] a a b b bending compression Loading k
Figure 2.3 – Plate buckling coefficient
During the yielding process the material is heterogeneous since yielding takes place in so-called slip bands; the strain jumps from the yield strain to that at the beginning of strain hardening. Because of the yielding process, the material cannot be expected to remain isotropic. Therefore, general expressions for the buckling strength are derived assuming the material to have become orthogonally anisotropic [21]. When all the material has been strained to the strain hardening range, the material again becomes homogeneous. The differential equation that describes the inelastic local buckling load for thin rectangular plate subject to compression in the x direction may be written as given in Equation 2.3:
4 4 4 2 4 2 2 2 4 2 0 x N t w w w w x x y y D x 2.3
Where E Et/ (E is the tangent modulus of steel), and t
3 2 12(1 ) Et D
There are many other sources of information on elastic and inelastic local buckling of plates. Bleich (1952) [22], Haaijer (1956) [21], Galambos (1968) [19], Johnston (1976) [23], Ostapenko (1983) [24], and Timoshenko & Gere (1969) [25] provide significant summaries of plate local buckling.
State of the art
– 28 – 2.1.4 Definition of rotation capacity
The capacity of a section has been exposed before; here, ways to define their reserve in ductility are investigated. This is made through the definition of the rotation capacity Rcap of a
section, which is a mean to quantify the reserve in ductility of a section.
In the practice of plastic design of structures, ductility is defined as the capacity of a structure to undergo deformations after reaching its initial yield without any significant reduction in its ultimate strength. Hence, a steel beam cannot sustain infinite curvature, so, at a certain curvature, failure occurs. The most common mode of failure is local instability (buckling) of the plate elements in the section. The rotation capacity Rcap is defined as in Equation 2.4,
where represents the beam end sections’ rotation and its limit values pl, u and pl2 are
defined in Figure 2.4 below. pl2is the limiting rotation at which the moment drops below
Mpl. 2 2 1 pl pl pl cap pl pl R
2.4 Moment M Mu Rotation pl u pl2 Mpl Rcap= -1 pl2 plFigure 2.4 – Generalized moment-rotation curve and definition of the rotation capacity
Moreover, some beams may fail before reaching the yield moment or the plastic moment. The rotation capacity Rcap is only calculated once the plastic moment is reached. It is a
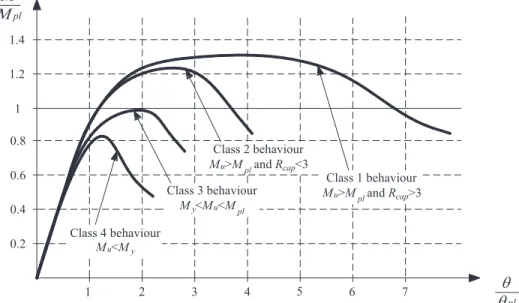
measure of how much the plastic hinge can rotate before failure occurs. Figure 2.5 exhibits typical normalised moment-rotation curves for different sections. These sections are classified into groups depending on their behaviour under bending according to EC3 cross-section classification system. From Figure 2.5 we can see that a cross-section is classified as
State of the art
– 29 –
“class 2” if it can reach its plastic moment, but fail to attain a rotation capacity of 3; whereas a section is classified as “class 1” if it can reach a rotation capacity that is larger than 3.
1 pl pl Class 1 behaviour Mu>Mpl and Rcap>3 Class 2 behaviour Mu>Mpl and Rcap<3 Class 4 behaviour Mu<My Class 3 behaviour My<Mu<Mpl 0.8 0.6 0.4 0.2 1.2 1.4
Figure 2.5 – Moment-rotation curve for different sections with the EC3 classification
2.2 Plastic analysis
In the previous section, we detailed the history of the plastic behaviour of steel and the cross-section capacity in term of resistance and instability for the case of bending. In the following section, the behaviour of simply supported beams will be detailed to explore how a beam with known cross-section properties will behave under a specified load and distribution. Then the basics of plastic design will be detailed along with the plastic rotation requirements for practical indeterminate structures.
2.2.1 Behaviour of a simply supported beam:
In this section, we present a brief review of the behaviour of beams loaded under major bending axis. Both cases of beams loaded under a moment gradient and the ones loaded under a uniform moment are presented. The plastification process is important for steel in plastic design, as it ensures that the plastic moments at yielded sections can be maintainedfor the cross section to sustain loading beyond its elastic limit. This section was mainly influenced by the paper of Kerfoot [26].
State of the art
– 30 – 2.2.1.1 Beam under uniform moment
When a beam is loaded under uniform moment, a plastified region forms. Due to the discontinuous stress-strain relationship of steel, yielding takes place in small slip bands by a sudden jump of strain. Therefore yield lines occur at intervals along the region of uniform moment as shown in Figure 2.6 and additional deformation result in additional yield lines. The occurrence of yielding at discrete points results in discontinuities in the curvature. Some portions of the region of uniform moment are at curvature corresponding to the first yield y and others are at the curvature corresponding to complete yield ST (strain hardening).
Mel
L
Beam at first yield
M>Mel
L
Beam at intermediate load
Mpl
L
Beam at ultimate load
Curvature at ultimate load
ST y A pl B C D u
In the case of a very stocky section, strain hardening is reached
Mpl pl B C D M pl2
Moment-Rotation for a hot-formed material law
Moment-Rotation for a cold-formed material law
Yielded regions u A First Yielding Proportional limit Mel M>Mel Mpl Mpl Mpl Mpl M
Figure 2.6 – Beam under uniform moment
Figure 2.6 shows the case of a beam under uniform moment. The applied load is plotted as a function of the rotation occurring on the beam end and consists in four parts:
The elastic range (segment OA) in which the beam behaviour is linear
The contained plastic flow region (segment AB) in which the curve becomes non-linear because of the effect of residual stresses, and of partial yielding. For cold formed cases, residual stresses are more important and affect the beam behaviour. For this case, the curve departs from the predicted curve at the proportional limit, which is
State of the art
– 31 –
indicative of initial yielding of some fibres, and reveals a significant influence of residual stresses at the beginning of the plastic range.
The segment BC in which large rotation occurs with little increase in load. For the case of the hot-formed material law, a plastic plateau is witnessed where the beam is yielded. In this range, the theoretical plastic moment is not fully reached due to some unyielded zones; for very stocky sections strain hardening occur, and values beyond
Mpl are reached. For cold formed sections, and since the material law exhibit a
rounded response, the moment-rotation curve exhibit this same tendency and moments beyond Mpl are reached.
The unloading region (segment DC) where the reduction in load is accompanied by large buckling of the individual plate elements of the section.
For beams under uniform moment, the moment remains constant at Mpl until the
average strain in the compressive flange reaches the strain hardening strain ST value along the entire region of the uniform moment. Only then can the steel strain harden and the moment can exceed Mpl [27].
The rotation capacity of this beam is the difference in rotation between point A and C. it is the portion of the curve in which the plastic moment Mpl is exceeded.
Since hot-formed sections only achieve the plastic moment at high strains, due to their very large yield plateau, Stranghöner [28], Lay & Galambos [29], Sedlacek [30] and Chan & Gardner [31] based the rotation capacity on achieving 95% of the plastic moment.
2.2.1.2 Beams under moment gradient:
The behaviour of the beam under moment gradient differs significantly from that of a uniform moment distribution. In the moment gradient case, due to the stress strain relationship of the material, a discontinuity of the curvature function is witnessed at the boundaries of the yielded zone (Figure 2.7). The strain, and thus the curvature, are at excess of the strain hardening value over the entire yielded region.
State of the art
– 32 – P
L
Beam at first yield
L
Beam at intermediate load
L
Beam at ultimate load
Curvature at ultimate load ST y Mpl A pl B C D M pl2
Moment-Rotation for beam under moment gradient
Yielded region
u
Pult>P>Py
Pult
P
Initiation of local buckling
ST
u
Figure 2.7 – Beam under moment gradient
The Moment rotation curve represents the influence of residual stresses, the shape factor, and strain hardening. Hence yielding start to occur at point A because of the presence of residual stresses which cause a slight reduction in stiffness. Then, the rotation start to increase rapidly once the plastic moment is reached and local buckling is observed. However, local buckling does not induce strength degradation, but the moment continues to increase. Under a moment gradient, yielding of the beam is confined to the region of maximum moment and cannot spread along the length of the beam unless the moment increases. Therefore, as soon as the plastic moment Mpl is reached, the steel strain hardens and the load can be increased and
yielding can spread along the length. The onset of local buckling is only initiated when the compression flange has yielded over a length sufficient to form a buckled shape, and will continue to increase until the yielded length is equal to a full local buckling wavelength. 2.2.2 Rotation capacity quantification and sensibility
The behaviour of beams under bending have been detailed before, and the beam response was seen to vary depending on the load introduction, in terms of ultimate capacity and of ductility
State of the art
– 33 –
(i.e. rotation capacity); therefore, ways to quantify and asses the sensibility of the rotation capacity to different parameters is investigated.
To date, many Researchers developed equations to quantify the plastic rotation capacity of steel members. To cite a few, Lay and Galambos (1967) [32], Kemp (1984) [33], Kato (1989) [34], , Ziemian & al (1992) [35]… proposed analytical expression for determining the plastic rotation capacity of I and H sections.
Moreover, efforts were also made to experimentally define key parameters that affect the rotation capacity.
In 1969, Luckey & Adams [36] identified from experimental tests that a section possess reserve in strength even after the local buckling load has been reached.
Kuhlmann (1989) [37] indicated three governing parameters for the rotation capacity: the flange slenderness, the web stiffness and the steepness of the moment gradient. She observed that the flange slenderness was the most important parameter. Khulmann also stated that higher rotation capacities were achieved for steep moment gradient. This observation was also reported theoretically by Lay & Galambos (1967) [32] and experimentally by Stranghoner & al (1994) [38].
Moreover, Khulmann [37], Ricles &al [39] and Wang & al [40] indicated that the yield to ultimate strength ratio of the material (also named strain hardening modulus) improves the postbuckling behaviour.
Wilkinson (1999) [41] assessed the plastic behaviour of cold formed rectangular hollow sections and found that class 1 slenderness limit for RHS were unconservative and proposed a new limit that incorporates flange-web interaction. He also found that the magnitude of the imperfection had an unexpectedly significant impact on the rotation capacity especially for stockier sections.
Boeraeve & Lognard (1993) [42] also stated that the initial geometrical imperfections of a beam influence the moment rotation curve and the plastic hinge formation mainly in its decreasing part (after the maximum bending moment has been reached).
More recently, the trend to define the rotation capacity of sections has been mainly investigated through numerical (finite element) methods. Current developments that consist
State of the art
– 34 –
in determining the inelastic deformation capacity of a section are mainly developed as a preliminary step aimed to calculate the moment capacity of a section.
Shifferaw and Schafer (2007) [43] presented a relationship between the ultimate strain u to the yield strains y ratioand the cross-section slenderness for the case of pure bending. This method was used for the calculation of the inelastic moment capacity of cold-formed members, considering the influence of local buckling.
Moreover, strain based approached have also been extensively developed for stainless steel and extended to carbon steel at Imperial college and resulted in the continuous strain method CSM [44]. The CSM features two key components: a base curve that defines the level of strain that a cross-section can carry and a material model that, combined with the proposed strain curve, is used to determine the cross-section resistance.
2.2.3 Basics of plastic design
Following the characterisation of the rotation capacity of sections, the rotation demand of indeterminate structures should be investigated in order to define recommendations to permit the use of a plastic analysis. Sections that are capable to maintain their plastic moment to the minimum rotation requirements would be eligible for plastic design. In this section, methods to define the plastic demand of structures are briefly detailed.
For a statically indeterminate structure, failure does not necessarily occur when the plastic moment is reached at a certain position. However, at this location, a plastic hinge is formed that maintain this plastic moment and undergo rotation so that loading is transferred to other parts of the structure. The structure fails when a collapse mechanism forms, that is when there is a sufficient number of plastic hinges.
The general methods to find the plastic limit load of a structure are based on two fundamental theorems: i) the lower bound, or Static theorem, where the load factor is computed based on an arbitrarily assumed bending moment diagram, due to external applied loading, and on the fact that the plastic moment Mpl is nowhere exceeded; ii) The upper bound, or Kinematic
theorem, where the load factor is computed on the basis of an arbitrarily assumed mechanism. The most commonly used analytical method for plastic analysis of indeterminate structures consists in the virtual work method. This method consists in equating the external work
State of the art
– 35 –
(produced by loading) to the internal work (produced by the plastic moment at the plastic hinge), during a virtual movement of the collapse mechanism.
In order to perform a plastic analysis of a structure, many assumptions are made in the virtual work procedure:
It is assumed that no instabilities can occur in term of plate buckling or global buckling of the beams or structure.
The elastic deformations of the beam are disregarded.
The hinge is considered of zero width, thus, the curvature is assumed infinite at the plastic hinge location.
Strain hardening is disregarded. This lead to the assumption that the plastic moment is never exceeded (the reserve in strength from strain hardening is ignored), and that plastic hinges rotate with zero flexural stiffness. This approximation is however safe sided and generally induces small errors as stated by Neal (1977) [45].
The plastic moment value of a section is not influenced by normal force or by high level of stress concentration induced by point loads.
Second order effects due to the formation of hinges are disregarded. Initial geometrical imperfection are ignored.
Following these analytical and manual methods, early development of plasticity problems in a general finite element approach started in the late sixties. Nowadays, mathematical programming methods have become an important area of research in engineering plasticity. However, computer programs for plastic analysis of framed structures have been written as specialist programs and are consequently not available commercially. Therefore, very few are being used for daily routine design [46].
2.2.4 Required rotation capacity
In this section, the rotation demand of structures is investigated. Plastic rotation starts when a section reaches its plastic moment. Then, plastic hinges must be able to rotate a certain amount in order to redistribute the bending moment, and eventually form a plastic collapse mechanism in a particular structural situation. This rotation for which the plastic moment is maintained is called the rotation capacity requirement (or rotation demand). The required hinge rotation depends on the nature of the loading, the properties of the section, the structure
State of the art
– 36 –
geometry and so on. Analytical studies have been performed throughout the years to determine maximum plastic rotation requirements for practical structures.
Kerfoot (1965) [26] analysed wide flange beams with three span and two point loadings per span. He found that only in extreme cases a rotation capacity greater than MplL/EI, where L is
the span length, would be required to form a plastic collapse mechanism. Kerfoot replaced the term MplL/EI with the term 2ySL/d in order to show that the rotation capacity required to
form a mechanism, is directly proportional to the yield strain and to the length-to-depth ratio (where d is the height of the section, S is the shape factor defined as S = Mpl/Mel and y is the
yield strain). Hence, Kerfoot showed that a beam with high strength steel would require more rotation in order to form a plastic mechanism.
Driscoll (1958) [47] considered three span beams with distributed loads and extended the analysis to frames. He stated that higher rotations were required for multi-span frames than for single-span frames. This is expected in highly redundant structures, since a more extensive redistribution of moment is required in order for many hinges to form.
Moreover, for a highly redundant structure, the load-deflection curve converges towards the maximum load with large deflections. It happens that large rotations are sometimes required from some of the hinges to only create small increases in the capacity of the structure. Driscoll (1958) [47] analysed a double frame structure with dead loads and wind loads as represented in Figure 2.8. Wilkinson [41] summarised his results and stated that: “at the
ultimate load and formation of the plastic collapse mechanism, the first hinge had to rotate
1.52 MplL/EI. At 98% of the ultimate load, the first hinge had rotated 0.54 MplL/EI. In design
situations, achieving slightly under the calculated maximum load is acceptable, and therefore the practical rotation capacity requirements can be less than the very large theoretical values of rotation calculated in some highly redundant frames.”
State of the art
– 37 –
Figure 2.8 – Theoretical load-deflection curve for two-span pitched frame [47]
Since the required rotation capacity differ according to the loading and geometry of a structure and since the calculation of this value for complex structures can sometimes be complicated, time consuming and unreliable, as stated by Galambos (1968) [27] and Yura et al. (1978) [48], a limit value that covers most common practical situations was established. The Eurocode 3 Editorial Group [49] summaries the maximum rotation requirements for different systems after varying a set of parameters (see Figure 2.9). They found that a value of Rdem = 3 was suitable, and was therefore chosen to derive the b / t ratios for I-sections.
State of the art – 38 – Structure Rotation requirement 3.0 1.3 2.5 3.0 2.5
Figure 2.9 – Rotation requirement for structures as summarised in [49]
Korol and Hudoba (1972) [50] considered hollow sections and stated that in order to cover most civil engineering structures for plastic design, a value of Rdem = 4 was recommended as
the minimum necessary to ensure that a mechanism could form. Based on this recommendation, Hasan and Hancock [51] and Zhao and Hancock [52] used the limitation of
Rdem = 4 to determine suitable plastic slenderness for the Australian Standard AS 4100.
Kuhlmann [37] analysed continuous beams on four supports loaded by a point load at mid-span, and suggested that a value of Rdem = 2 was sufficient for continuous beams. Neal [45]
also gave the same recommendation for continuous beams.
Stranghöner, Sedlacek and Boeraeve [38] investigated the behaviour of hollow sections and highlighted that different rotation requirements are reached in this case, since the shape factor of hollow sections is different than I-sections. They found that Rdem = 3 was adequate for
continuous beams.
As a general comment, it can be noted here that in seismic regions, greater rotation capacity needs to be provided for plastic analysis; however, this area is not the subject of this thesis.
State of the art
– 39 –
As a summary, analysis was performed on the rotation capacity requirements for the most common structures and rotation of the order of 3 ~ 4 was found suitable and used in most standards for the derivation of plate slenderness limits.
It has also been outlined that the calculation of the required rotation capacity is difficult and time consuming. This process can also be sometimes unreliable (but generally always safe-sided), because some parameters that affect the results are neglected, and are listed below:
Strain hardening is ignored. However, if included, smaller rotations capacities are required.
In some extreme cases, the theoretical ideal hinge capacities are considerable due to zones of high moment gradient or to some extreme structures conception (single-story frames with very steep gables) where the ideal assumptions are invalid;
Moreover, for extreme situations, it was shown that the rotation requirements are greatly diminished for a load just a few percent below the system peak load.
Plastic analysis has been traditionally used under proportionally increasing loading. However, there are cases under which the traditional methods of plastic analysis cannot be applied (effect of foundation settlement, increasing temperature caused by fire…) [46].
Hence, the assumption made in current standards that defines the level of required rotation capacity is made for simplicity and rapidity of the design. This assumption (Rdem = 3 or 4) is
based on traditional and simple structures where the number of plastic hinges is small before collapse occurs. Nevertheless, for highly redundant steel structures, it is more realistic to check the actual plastic rotation demand of the structure, because of the high number of plastic hinges that would occur and lead to large plastic rotations. The rotation demand should then be compared to rotation capacity of the section: Rdem ≤ Rcap
2.3 Plastic design
2.3.1 Treatment and background of main design codes 2.3.1.1 Slenderness limits
Rules concerning local buckling are required for the design of structural steel members. Therefore, in any specification, the combination of cross-sectional dimensions and yield
State of the art
– 40 –
strength are taken into account, in order to determine limits at which local buckling can be expected to occur for a designer. In other words, to prevent premature local buckling, slenderness limits for the plate elements in members have been established, and sections are considered as being constituted of individual flat plate elements. The elastic buckling stress given in Equation 2.2 can be rearranged in terms of the geometrical slenderness limit b / t:
y b H t f or y b f H t 2.5
The plate relative slenderness λp is defined as follows:
2 2 2 . . 12 1 y y p cr f f E t k b 2.6Slenderness limit from different standard will be compared to point out the diversity among several specifications. The comparison will only be focused on rectangular sections subject to bending. The examined standards are listed below, and Table 2.1 summarises the terminology in these standards to avoid any confusion.
(i) Eurocode 3 [53], ( EC3 ), 1993, Common Unified code of practice for steel structures; (ii) AISC [54], ( AISC ), 2005, Specification for structural steel buildings;
(iii) BS 5950 Part 1 [55], ( BS 5950 ), 2000, Structural use of steelwork in building;
(iv) DIN 18800 Teil 1 [56], ( DIN 18 800 ), 1990, Steel structures, Design and construction; (v) AS 4100 [57], ( AS 4100 ), 1998, SAA Steel structures Code.
Table 2.1 – Denomination of cross-section classes in each specification Specification Types of classes
Eurocode 3 Class 1 Class 2 Class 3 Class 4
AISC Compact Non-compact Slender
DIN 18800 P-P E-P E-E
BS 5950 Plastic Compact Semi-compact Slender AS 4100 Compact Non-Compact Slender
Since plastic design is the object of study in the present thesis, only the background of the limit between class 1 and 2 will be detailed hereafter. It is therefore reminded here, that this limit was based on the fact that a cross-section is able to maintain the yield stress for a
State of the art
– 41 –
substantial amount of deformation to prevent premature local buckling, and hence allow moment redistribution and the formation of a plastic hinge.
Development of the plastic limit for plates in compression supported on both edges: Haaijer & Thurlimann (1958) [58] first examined theoretically the problem of inelastic plate buckling under uniform compression, with the object of deriving plate buckling equation which is applicable to the strain-hardening range. The plastic limit for compressed hot-formed elements supported on two edges was determined for 36 ksi (248 MPa) steel while assuming an inelastic rotation capacity R = 3:
32.3
b t t
2.7
Korol and Hudoba (1972) [50] investigated experimentally the behaviour of SHS, RHS and CHS in both hot-formed and cold-formed steel, with a total of 31 tests on single span and three span beams. Due to the lack of strain hardening and the high level of stress concentration induced by the load application method, most sections did not exceed the plastic moment calculated from measured properties. The proposed limit for RHS and SHS flanges was given for a rotation capacity of 4 and using the nominal yield stress guaranteed by the manufacturer: 2 25 250 y e f b r t 2.8
The experimental work of Hasan and Hancock (1989) [51] and Zhao and Hancock (1991) [52], who performed bending tests of Grade C350 and C450 on cold-formed SHS and RHS under uniform moment, was combined; and the flange slenderness limit for plastic design assuming an inelastic rotation capacity R = 4, was given as:
2 30 250 y f b t t 2.9
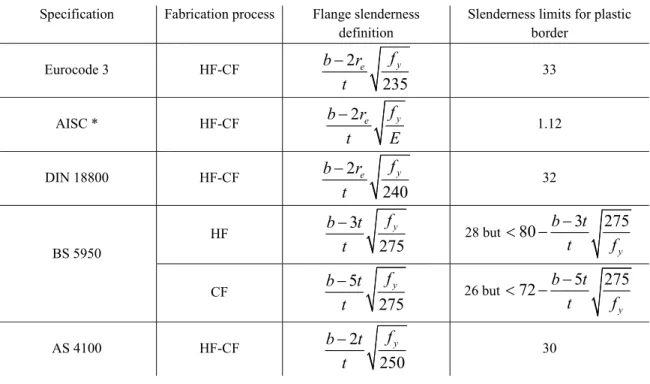
Following the research work detailed before, slenderness limit have been defined in design standards. Table 2.2 gives the flange slenderness definition and plastic limits for square and rectangular hollow sections under major axis bending (flange is in compression) for Eurocode 3, AISC, DIN 18800, BS 5950 and AS 4100. It is to be noted here that only the
State of the art
– 42 –
British standard BS 5950 takes into consideration the production route of the section, whether it is hot-rolled or cold-formed, and gives different slenderness limitations accordingly.
Table 2.2 – Plastic flange slenderness limits of RHS in bending Specification Fabrication process Flange slenderness
definition
Slenderness limits for plastic border Eurocode 3 HF-CF 2 235 y e f b r t 33 AISC * HF-CF b 2re fy t E 1.12 DIN 18800 HF-CF 2 240 y e f b r t 32 BS 5950 HF 3 275 y f b t t 28 but 80 3 275 y b t t f CF 5 275 y f b t t 26 but 72 5 275 y b t t f AS 4100 HF-CF 2 250 y f b t t 30
*AISC considers E =29000 Ksi (=200000MPa)
Development of the plastic limit for plates in bending supported on both edges:
Generally, in current design standards the same slenderness limits applies to the webs of RHS and I-sections. Most research on web slenderness limits consisted of tests of simple plates or I-sections. One can cite the main research performed: Lyse and Godfrey (1934) [3], Haaijer (1957) [59], and Haaijer and Thurlimann (1957) [60], Kerensky, Flint and Brown (1956) [61], Holtz and Kulak (1973, 1975) [62] [63], Perlynn and Kulak (1974) [64], Nash and Kulak (1976) [65], Horne (1979) [66], Dawe and Kulak (1986) [67], Della-Croce (1970) [68], Costley (1970) [69], Galambos (1976) [70], Edinger and Haaijer (1984) [71].
All of the previous research listed above indicates that the web slenderness limits are based on tests of I-sections. The slenderness limits in current design standards (see Table 2.3) are applicable to both RHS and I-sections, although the nature of the web restraint of an RHS is different to that of an I-section web: i) the centre of the flange of an I-section restrains the web, whereas the ends of the flange restrain the webs of an RHS, ii) the area of the two webs of an RHS consists of about 50 to 75 % of the total area of the section whereas for an
I-State of the art
– 43 –
section the web is typically 35 - 45% of the total area, so the influence of the web is greater in RHS and SHS than in I-sections.
Also it can be noted that since the first manufactured RHS were either square or rectangular with low aspect ratios, thus, in bending, flange buckling would prevail before web buckling and therefore not much attention was given to this problem. Nowadays, since RHS have been produced with higher aspect ratios, a more global approach, that takes into account the flange web interaction and propose new limit to allow for plastic analysis, should be introduced. Hence, it is usually conservative to assume that the webs of RHS sections are simply along their edges, since the flanges normally provide some torsional restraints.
Table 2.3 present the web slenderness definition and plastic slenderness limits for SHS and RHS under bending for Eurocode 3, AISC, DIN 18800, BS 5950 and AS 4100.
Table 2.3 – Plastic web slenderness limits of RHS in bending
Specification Fabrication process web slenderness definition Slenderness limits for plastic border Eurocode 3 HF-CF 2 235 y e f h r t 72 AISC HF-CF h 2re fy t E 3.76 DIN 18800 HF-CF 2 240 y e f h r t 64 BS 5950 HF 3 275 y f h t t 64 CF 5 275 y f h t t 56 AS 4100 HF-CF 2 250 y f h t t 82
Different hypothesis and experiments lie behind the derivation of the limits for each standard which explain the different limitation in the codes. A more complete summary of limits in several steel design specifications and their background can be found in Bild & Kulak [72] and Wilkinson [41].
Since diverse definitions lie behind the flange and web slenderness limitations of the different standards, all values has been converted to the EC3 definition in order to be able to compare
State of the art
– 44 –
the proposed limits. Table 2.4 shows the slenderness limit of the different standards according to the EC3 definition.
From Table 2.4, it can be shown that current standards display some disparities in their flange and web slenderness recommendations. It can also be pointed out that the AISC possesses the highest web slenderness limit in comparison with the other standards, while the AS 4100 has the lowest flange slenderness requirement. Based on these results that highlight the inconsistencies in the derivation of actual limits, new investigations should be performed to define more accurate propositions to allow the use of plastic design.
Table 2.4 – Class 1-2 slenderness limit according to EC3 definition
class 1-2 border according to EC3 definition => λp=?
Conditions Eurocode 3 AISC DIN 18800 BS 5950 AS 4100
33ε => λp=0.58 32.5ε => λp=0.57 30.8ε => λp=0.54 HF: 30.3ε => λp=0.53 24.0ε => λp=0.42 CF: 28.1ε => λp=0.49 72ε => λp=0.52 109.6ε => λp=0.79 61.7ε => λp=0.44 HF: 69.2ε => λp=0.50 65.6ε => λp=0.47 CF: 60.6ε => λp=0.44 2.3.1.2 Material requirements
In addition to the section slenderness specifications, current design standards have material ductility requirements in order for plastic analysis to be permitted. This is due to the fact that large strains are required so that moment is redistributed and a mechanism is formed. The material requirement of AISC, AS 4100 and Eurocode 3 design specifications are presented herein. These recommendations has been made following several investigations on the ductility requirement of the material for plastic design and their effect on the moment redistribution which are summarised by Wilkinson [41].
For the Eurocode 3, the ductility requirement is expressed in terms of limit for the fu / fyratio
![Figure 2.8 – Theoretical load-deflection curve for two-span pitched frame [47]](https://thumb-eu.123doks.com/thumbv2/123doknet/6664441.182475/39.918.259.665.95.509/figure-theoretical-load-deflection-curve-span-pitched-frame.webp)


![Figure 3.17 – 3-Point bending analysis / y [-]0.00.51.01.52.02.5 3.0 3.5 4.0M / Mpl[-]0.00.10.20.30.40.50.60.70.80.91.0RHS_220*120*6.3_SS_3PSHS_180*8_SS_3PRHS_180*80*4.5_SS_3P v [mm]0102030 40 50 60P / Ppl [-]0.00.20.40.60.81.0RHS_200*120*6.3_SS_3PSH](https://thumb-eu.123doks.com/thumbv2/123doknet/6664441.182475/69.918.209.700.231.542/figure-point-bending-analysis-mpl-rhs-pshs-prhs.webp)
