Development of an Evidence-Based Calibration Methodology Dedicated to
Energy Audit of Office Buildings. Part 2: Application to a typical office
building in Belgium
Philippe André1, Bertrand Fabry1, Stéphane Bertagnolio2, Pierre-Yves Franck1
1
BEMS, Department of Environmental Sciences and Management, University of Liège, Belgium
2
Thermodynamics Laboratory, University of Liège, Belgium Corresponding email: p.andre@ulg.ac.be
SUMMARY
This paper reports on the application of the tools within an audit procedure applied to a typical office building in Belgium, which is in operation for more than 20 years.
The first step of the work consisted in analyzing the current performance of the building which proved to point out a number of problems in the operation of the building. As it is not rarely the case for running office buildings, these problems were due to a lack of commissioning and a progressive decrease of the performances due to a poor management. Application of the first stage “Benchmark” tool to this building led to a very high discrepancy between the measured consumptions and the calculated ones. This appeared mainly for the electricity consumption but also for the gas consumption. Calibration of the simulation tool, mainly by representing more exactly the management of the building and the real internal gains improved the accuracy of the calculations to a large extent.
After calibration of the building and HVAC model, the application of a second tool (SimAudit) allowed to evaluate the savings obtained by the implementation of a number of Energy Conservation Opportunities (ECOs). In this case, the dominant ECOs were in relation with the operation of the building: change of schedules, modification of setpoints; implementation of free-cooling strategies; provision of heat recovery and move to reversibility of the chillers. Reasonable estimates of the savings can be obtained following the calibration/simulation process.
INTRODUCTION
To promote improvements in the HVAC installations of existing buildings, the article 9 of the EPBD directive establishes mandatory inspections of air-conditioning systems. Four audit stages are generally distinguished: (1) benchmarking, (2) inspection, (3) detailed audit and (4) investment grade audit. A detailed audit methodology, supported by the use of different simulation tools is presented in the companion paper [1]. This second paper will illustrate the application of this methodology to a specific case which is a very classical medium size office building located in Belgium.
BUILDING DESCRIPTION
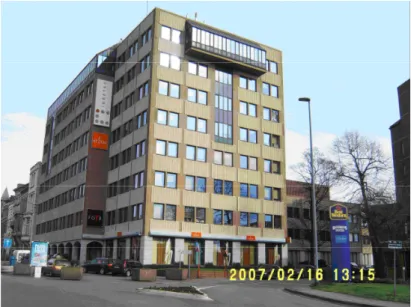
The analyzed building is a medium size building built in Charleroi (central part of Belgium) at the end of the eighties (fig. 1). It is a 9 storey building with about 7 220 m² of air-conditioned offices and meeting rooms and underground parking lots. It is surrounded by small buildings and streets.
Fig. 1: View of the analyzed building
The building is located at an altitude of 306 m where the climate is characterized by the following data:
Heating sizing temperature - 10°C
Cooling sizing temperature 30°C with 50 % relative humidity 15/ 15 heating degree-days 2000 K*d
A four storey zone of the building for which energy balances can be worked out has been identified (storey n° 4, 5, 6 and 7). 40 people occupy each of these floors from 8 am to 6 pm, 5 days per week, all the year. The HVAC system has an air handling unit (GP2-GE2) that supplies conditioned air through a duct work system to the different offices (See figure 2).
Air can be post heated through a total of 31 local coils distributed within the roof of the four floors. Local comfort temperature set points can independently be adjusted by occupants within a range of +/- 3°C around a fix value (21°C). A building energy management system (BEMS) handles all necessary data and implements the control strategies. The data can be remotely downloaded.
There are 3 classical gas boilers (318 kW - no condensation) and 2 chillers. Nominal water temperatures at the boilers are 70/90 °C. The 2 chillers have 2 compressors (4X30kW motors).
FIRST APPROACH OF THE AUDIT
Preliminary analysis and simulation-based benchmarking
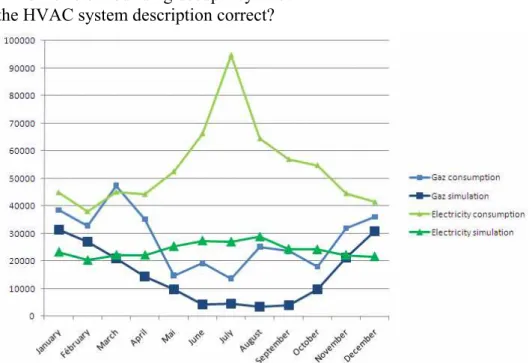
According to the methodology described in [1], a first tool (“Benchmark”) was used in order to get a first impression on how this building works and where it can be located on a performance scale. This analysis also allows to determine whether the measured energy consumptions correspond with the one evaluated by simulation.
As shown on figure 3, with the benchmark tool (BM) as an example, these simulations unfortunately always led to significant underestimation of the heat demand and further, of the
gas and electrical consumptions as obtained from actual energy bills.
With such huge differences, it got clear that the assumptions made to supply the simulation programs were probably wrong and the following points should be checked on site.
- Has the building envelope been correctly defined? - Is the geometrical description correct?
- Are the infiltration / exfiltration rates correct?
- What are the actual ambient temperatures set points in the offices? - What are the actual internal and solar gains in the office?
- What is the actual building occupancy rate? - Is the HVAC system description correct?
Figure 3: Comparison between measured energy consumptions (gas, electricity) and benchmark simulated consumptions
ADDITIONAL MONITORING
In order to address some of these questions, some additional monitoring equipment was deployed on the building.
Because the electrical energy consumption as evaluated by the energy bills is very high, and because it almost integrally converts into internal gains, it appears necessary to have a clear idea of the electrical energy consumption on several important consumption points.
Several electrical energy counters were installed to measure the consumption of the supply and extraction fans, chilling group, room air conditioners (RAC),… together with flow meters on hot and cold water distribution and meteorological station.
This equipment, in association with the data provided by the BEMS allowed getting a deeper understanding of the operation of the building.
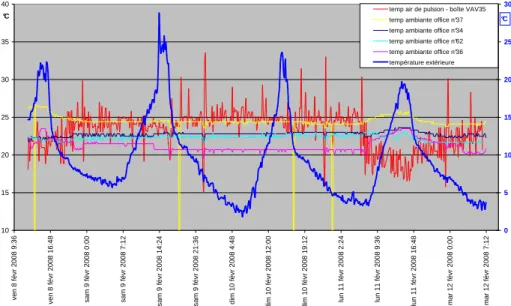
Figure 4 highlights the fact that the temperature in some typical offices is significantly higher than the pre-assumed value (between 21°C and 25°C, while the first calculations were assuming 22°C). 10 15 20 25 30 35 40 v e n 8 f é v r 2 0 0 8 9 :3 6 v e n 8 f é v r 2 0 0 8 1 6 :4 8 s a m 9 f é v r 2 0 0 8 0 :0 0 s a m 9 f é v r 2 0 0 8 7 :1 2 s a m 9 f é v r 2 0 0 8 1 4 :2 4 s a m 9 f é v r 2 0 0 8 2 1 :3 6 d im 1 0 f é v r 2 0 0 8 4 :4 8 d im 1 0 f é v r 2 0 0 8 1 2 :0 0 d im 1 0 f é v r 2 0 0 8 1 9 :1 2 lu n 1 1 f é v r 2 0 0 8 2 :2 4 lu n 1 1 f é v r 2 0 0 8 9 :3 6 lu n 1 1 f é v r 2 0 0 8 1 6 :4 8 m a r 1 2 f é v r 2 0 0 8 0 :0 0 m a r 1 2 f é v r 2 0 0 8 7 :1 2 °C 0 5 10 15 20 25 30 °C temp air de pulsion - boîte VAV35 temp ambiante office n°37 temp ambiante office n°34 temp ambiante office n°62 temp ambiante office n°36 température extérieure
Figure 4: Evolution of typical temperatures in the offices for 5 days in February 2008
Figure 5 shows that the supply temperature at the outlet of the Air handling Unit is higher in summer time (when there is a dominant cooling demand) than in winter time. This control strategy does not seem to be optimal.
These observations make that there is no clear correlation between the chiller consumption and the loads (internal and solar) applying on the building in summer time.
12 14 16 18 20 22 je u 7 /0 2 /0 8 m a r 1 2 /0 2 /0 8 d im 1 7 /0 2 /0 8 v e n 2 2 /0 2 /0 8 m e r 2 7 /0 2 /0 8 lu n 3 /0 3 /0 8 s a m 8 /0 3 /0 8 je u 1 3 /0 3 /0 8 m a r 1 8 /0 3 /0 8 d im 2 3 /0 3 /0 8 v e n 2 8 /0 3 /0 8 m e r 2 /0 4 /0 8 lu n 7 /0 4 /0 8 s a m 1 2 /0 4 /0 8 je u 1 7 /0 4 /0 8 m a r 2 2 /0 4 /0 8 d im 2 7 /0 4 /0 8 v e n 2 /0 5 /0 8 m e r 7 /0 5 /0 8 lu n 1 2 /0 5 /0 8 s a m 1 7 /0 5 /0 8 je u 2 2 /0 5 /0 8 m a r 2 7 /0 5 /0 8 d im 1 /0 6 /0 8 v e n 6 /0 6 /0 8 m e r 1 1 /0 6 /0 8 lu n 1 6 /0 6 /0 8 s a m 2 1 /0 6 /0 8 je u 2 6 /0 6 /0 8 m a r 1 /0 7 /0 8 d im 6 /0 7 /0 8 v e n 1 1 /0 7 /0 8 m e r 1 6 /0 7 /0 8 lu n 2 1 /0 7 /0 8 s a m 2 6 /0 7 /0 8 je u 3 1 /0 7 /0 8 m a r 5 /0 8 /0 8 d im 1 0 /0 8 /0 8 v e n 1 5 /0 8 /0 8 [°C] 17 Chaufferie\Chauff_TPulsGP2 °C 15.6 38 Chaufferie\Chauff_PDC_Puls_GP2 °C 14.9 Moy. mobile sur 200 pér. (17 Chaufferie\Chauff_TPulsGP2 °C 15.6) Moy. mobile sur 200 pér. (38 Chaufferie\Chauff_PDC_Puls_GP2 °C 14.9)
T air pulsé
hiver été
Pulser de l'air plus froid en hiver qu'en été?
Set point
Figure 5: Evolution of the AHU supply temperature between winter (March 2008) and summer (June 2008)
CALIBRATION OF SIMAUDIT
The next step of the work involve the use of the SimAudit tool in order to go deeper in the analysis. The very important difference between the observed behaviour of the building and the one which was assumed by the Benchmark simulation make a calibration of the tool mandatory. This calibration was carried out and mainly involved the modification of the following parameters: set points, infiltration rates….
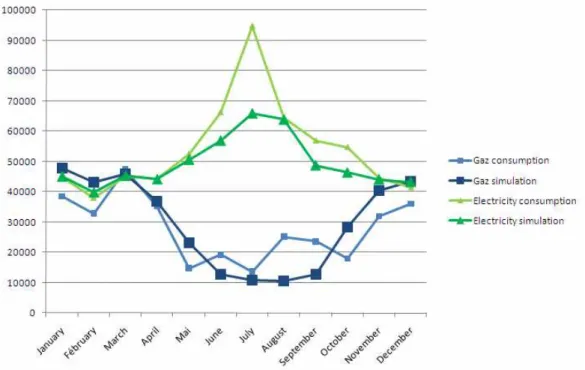
This calibration led to the results shown by figure 6, which again compares the electricity and gas consumptions as measured and calculated by SimAudit. This second confrontation between real and calculated consumption values gave some more encouraging results.
The annual gas consumptions (blue thick and thin lines) are more or less equal within 6%. There is still a 8% under-estimation of the annual electrical consumption (green thick and
thin lines).
[kWh/year] bills BenchMark SimAudit
gas 336 171 181 213 -46.1% 355 940 +5.88%
electricity 647 515 288 612 -55.4% 593963 -8.27%
Table 1: Comparison of Benchmark and SimAudit Results SELECTION OF ECOs
A number of ECOs were selected as being applicable in this building, either in reality (provided the manager of the building allows the realization of these) or in simulation (provided the system potentially offers the possibility to implement this ECO).
Simulated ECOs
Once the analysis tool is calibrated, it can be used in order to assess the impact of a number of ECOs (“Energy Conservation Opportunities”). The following ECOs were tested in simulation (the numbering corresponds to the one adopted in the HarmonAC project):
E4.8: introduce daylight/occupation sensors to operate lighting switches O1.1: generate instructions targeted to the occupants
E4.5: Replace electrical equipment with Energy Star or low consumption types E4.6: Replace lighting equipment with low consumption types
P2.6: Replace or upgrade cooling equipment and heat pumps O2.2: Shut off A/C equipments when not needed
O2.3: Shut off auxiliaries when not required O3.1: Shut chiller plant off when not required
O4.1: Consider modifying the supply air temperature (all–air and air–and–water systems) O2.4: Maintain proper system control set points
E2.4: Correct excessive envelope air leakages E3.9: Use double or triple glazing replacement E3.4: Add insulation to exterior wall externally
P1.7: Reduce power consumption of auxiliary equipment P3.3: Use the best EUROVENT class of fans
P4.1: Use the best class of pumps
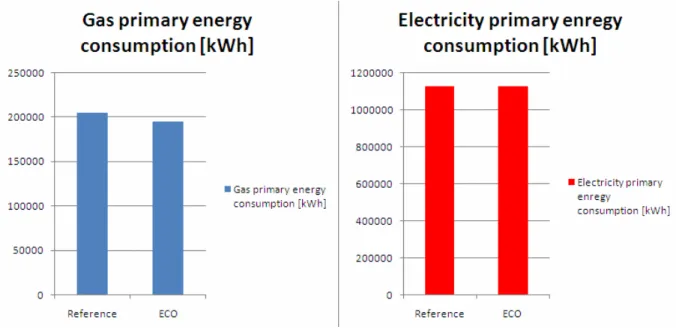
Figure 7 shows some exemplary results obtained with the SimAudit tool. The first illustrated result concerns the case where the combination of ECOs O2.2, O2.3 and O3.1 is implemented. The operation of the system is restricted to the occupation period of the building (week days between 6 and 20h). The impact on the electricity consumption is hardly noticeable, but there is a 5% economy in the gas consumption. These simulations are based on a very roughly calibrated version of SimAudit. A better calibration, based on recent consumption data, is currently in preparation.
Figure 7: example of ECO simulated with SimAudit ECOs implemented on-site (field trials)
A field trial was performed during the night of 25/26 September 2009, to simulate the behavior of the building when the HVAC system is turned on at 2 AM on Monday instead of 8 PM on Sunday (fig. 8). It appeared that the building could reach the good temperature range in the morning with a considerable decrease of the electrical consumption.
Figure 8: electricity consumption and temperatures (ambient, office) evolution during the field trial and during a classical week-end
This field trial also shows that it is not necessary to let the HVAC system on during the 4 other week nights and that the energy savings could therefore be multiplied. The building operator is very hesitant in implementing these changes because he fears for comfort issues. Indeed, comfort problems already occurred in some localized places, but they were rather due to a lack of insulation (glass wall).
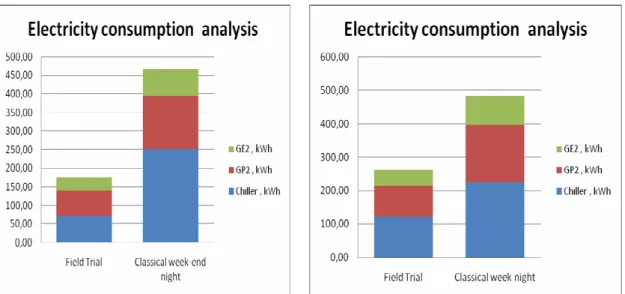
The energy savings are first measured for the Sunday to Monday night, and then for a classical week night (fig. 9).
Figure 9: energy savings obtained when changing the operating schedule of the plant The saving reaches 291 kWh for the Sunday to Monday night, and 220 kWh for the classical week night. By extrapolating these results for a complete week in the cooling season, the savings are 1171 kWh. Eventually, if we consider a cooling season of 18 weeks, the total amount of electrical energy saved would be 21078 kWh, that is 3 % of the global electricity consumption of the building.
DISCUSSION
This paper has illustrated the use of some dedicated simulation tools to the audit and benchmarking of a typical office building in Belgium. A precise calibration of the tools requires good energy consumption records as well as a rigorous check of the simulation hypothesis (indoor conditions, system schedule…). Results demonstrate the relevancy of the proposed methodology. The tools allow estimating the possible savings of different actions and it is thus possible to quickly choose the priority changes to implement.
ACKNOWLEDGEMENT
This work is performed with the support of the Walloon Region of Belgium and of Intelligent Energy Europe programme. The sole responsibility for the content of this document lies with the authors. It does not represent the opinion of the Community. The European Commission is not responsible for any use that may be made of the information contained therein.
REFERENCES
1. Bertagnolio, S., André, Ph. Development of an Evidence-based Calibration methodology
dedicated to the energy audit of office buildings. Part 1: Methodology and Modeling. Proceesdings of CLIMA 2010 conference, May 2010.
2. Knight, I.. 2009. HarmonAc: Harmonizing Air Conditioning Inspection and Audit Procedures
in the Tertiary Building Sector. Intelligent Energy Europe programme.
3. Bertagnolio S., Lebrun J. 2008. Simulation of a building and its HVAC system with an
equation solver. Application to benchmarking. Building Simulation : An International Journal. Vol. 1, pp 234-250.