PRO
OF
S
Effect of concrete surface treatment on adhesion
in repair systems
A. Garbacz*, M. Go´rka* and L. Courard†
Warsaw University of Technology; University of Liege
Existing concrete surfaces need to be roughened to a profile necessary to achieve mechanical interlocking with any repair material. In this study, different surface treatments (e.g. grinding, sandblasting, shotblasting, hand- and mechanical milling) were performed and the quality of the preparation established on the basis of three main parameters: surface geometry, superficial concrete microcracking and adhesion. Surface geometry was charac-terised on the basis of the measurement of surface profile—profilometry—and the analysis of statistical and amplitude parameters calculated from the waviness (lower frequencies) and the roughness (higher frequencies) profiles of the surface. Investigations were also performed to assess the quality of the superficial zone of concrete and cracks were systematically observed in relation to surface treatment where both scanning electron microscopy and light microscopy were used for analysis. Finally, a repair mortar, with or without bond coat, was applied to the concrete substrates in order to measure adhesion. Relationships clearly show the effect of roughness on adhesion in the case where no bond coat was used and also the influence of the power of the surface treatment on the waviness shape of the profile and the presence of microcracks in the near-surface layer, related to failure type.
Introduction
The adhesion between overlays and concrete sub-strate is one of the most important factors that affect the reliability and durability of repair.1,2 High adhesion causes higher tolerance on non-compatibility of proper-ties of both materials.3 A pull-off strength higher than 1.5 MPa is recommended in many standards and guide-lines.4–8 The adhesion depends on many phenomena taking place at the interface zone;9–11 for example, bond-detrimental layers (including bleeding), wettabil-ity of concrete substrate by repair materials, secondary physical attraction forces induced in the system, rough-ness of surface (interlocking mechanism), and moisture content in the concrete substrate versus the repair sys-tem (e.g. cement concrete or polymer composite).
The aim of the treatment of surface concrete is to remove any type of layer that causes a decrease in
adhesion as well as to enlarge the area of contact sur-face by increasing sursur-face roughness. Depending on local conditions of the specific building, surface rough-ness is obtained after sandblasting, milling, grinding, hydro-jetting or shotblasting. The chosen technique and the level of energy applied induce many different shapes and configurations. The effect of concrete sur-face roughness on adhesion is not quite clear.12–15 Fiebrich9 has shown that there is a relationship between the percentage of the surface of aggregates at the level of the concrete substrate after treatment and the adhe-sion of gunite; the best results were obtained for ratios between 30% and 40% of visible aggregates. Silfwerbrand16 showed that the influence of roughness is quite low. By comparing sandblasting and hydro-jetting effects, the values of adhesion strength are quite similar, even if the amount of adhesive rupture is high-er for sandblasting. Howevhigh-er, Fukuzawa17 has shown that there was a correlation between adhesion strength and some roughness parameters. Finally, a few authors12,18have concluded that surface roughness itself does not have significant influence but microcracks induced by surface treatment19 will mainly contribute to the deterioration of bond quality. The effect of a bond coat (PC or PCC type) is also under discussion. According to the present authors’ opinion,16,18the bond coat should be avoided because of creation of an extra 1
Article number = 41233 0024-9831 # 2004 Thomas Telford Ltd * Institute of Construction Engineering & Management, Faculty of
Civil Engineering, Warsaw University of Technology, PL-00-637 War-saw, Poland
† Department GeomaC, Building Materials Research Unit, University of Liege, Mechanical and Civil Engineering Institute, Chemin des Chevreuils, 1 (Baˆt. B 52/3), B - 4000 Liege (Belgium)
(MCR 1233) Paper received ???; last revised ???; accepted ???
PRO
OF
S
plane of weakness. Moreover, bond coat could have a negative effect with very rough surfaces because it could limit a good interlocking effect between substrate and repair material.16 However, some authors have shown that a presence of bond coat can significantly increase the adhesion.13,14,20
It is obvious, then, that no clear relationship has been established between adhesion and surface preparation. The aim of this study is to evaluate the effect of con-fcrete surface treatment on adhesion in a multi-layer system. Several mechanical methods of concrete surface preparation were selected to obtain various qualities of the surface concrete substrate. The quantification of sur-face roughness has been evaluated using mechanical profilometry.21
Experiment
Materials and treatment type
The concrete substrates (30 3 30 3 5 cm) of C20/25 class were made from the concrete mix: CEM I 32.5, 2/8 limestone, 0/2 quartz sand. The concrete substrates were prepared by the following types of the mechanical treatment
(a) grinding (GR) (b) sandblasting (SB)
(c) shotblasting (treatment time: 20 s (SHB20), 35 s (SHB35) and 45 s (SHB45))
(d) milling (by hand (HMIL) and mechanically (MMIL)).
Additionally, the concrete samples without treatment (NT) were tested as the control samples.
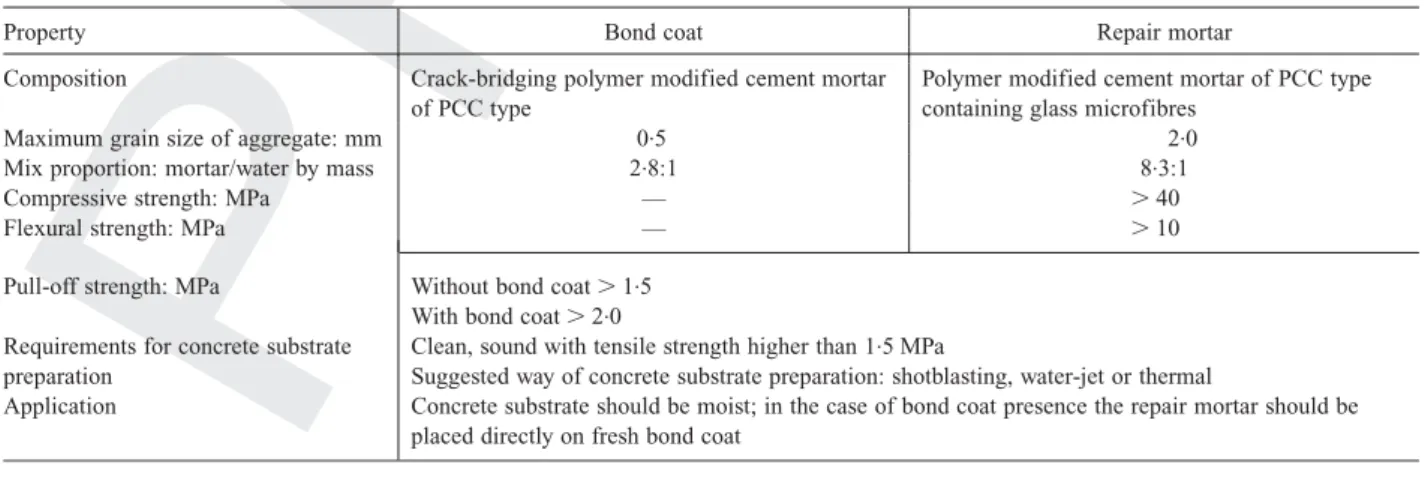
The commercial repair mortar of PCC-type rein-forced with glass microfibres and, as recommended by the producer, the PCC bond coat (Table 1) was used to prepare the overlays. The overlay was applied to the concrete substrate after various mechanical treatments in accordance with the producer’s guidelines, with and
without the bond coat. The 16 various combinations— eight preparation techniques and the bond coat—were tested. Three plates for each combination system were prepared. The adhesion was evaluated with the pull-off test (acc EN 12636:2001) after 28 days of curing.
Characterisation of concrete surface roughness
There are several methods for surface roughness description.9,18,22–25 In this work, the surface roughness of concrete was described with profilometry analysis. The basic problem with the implementation of profilo-metry to the concrete surfaces after various treatments is a large variation in their roughness. In this study an evaluation of concrete surface roughness was carried out with a commercial test device composed of a sty-lus, a conditioner/amplifier, a mechanical unit for ad-vancement and a computer unit for data acquisition. The registered profiles were first transformed to re-move effect of the profile orientation (‘shape’ filtra-tion). On the basis of the total profile obtained (Fig. 1(a)), parameters of Abbott’s curve were calculated (Fig. 1(b)). The total profile was then filtered and divided into low and high frequencies to separate para-meters of waviness (Fig. 1(c)) and roughness (Fig. 1(d)), respectively. The details of signal treatment are given elsewhere.21
At the first step, roughness of the profile was ana-lysed. In this case, a stylus with a diamond sphere radius of 6ìm was used. The length of measurement was 8 mm and the filter used to separate roughness from the total profile was fixed to 0.8 mm. The meas-urement of waviness was made with another stylus 79 mm long and a diamond of 1.5 mm radius. The length of the measurement was enlarged to 30 mm or more. The chosen filter to separate waviness from the total profile was 0.8 mm. In all cases, three profiles were registered on one sample of each kind of prepara-tion, and each profile on one sample was measured in different directions. The parameters of Abbott’s curve (CR, CF, CL), the waviness parameters (Wa, Wt, Wp), and
the roughness parameters (Ra, Rt, Rp) were used for the
Table 1. Characteristics of the repair materials used (acc. producer’s technical data)
Property Bond coat Repair mortar Composition Crack-bridging polymer modified cement mortar
of PCC type
Polymer modified cement mortar of PCC type containing glass microfibres
Maximum grain size of aggregate: mm 0.5 2.0 Mix proportion: mortar/water by mass 2.8:1 8.3:1 Compressive strength: MPa — . 40 Flexural strength: MPa — . 10 Pull-off strength: MPa Without bond coat . 1.5
With bond coat . 2.0 Requirements for concrete substrate
preparation
Clean, sound with tensile strength higher than 1.5 MPa
Suggested way of concrete substrate preparation: shotblasting, water-jet or thermal
Application Concrete substrate should be moist; in the case of bond coat presence the repair mortar should be placed directly on fresh bond coat
PRO
OF
S
Total profile (a) (b) Cutting depth 1p CR CF CL 1pCR – relative height of the peaks
CF – depth of the profile, excluding high peaks and holes
CL – relative height of the holes
(c)
Wa
Waviness of the profile
Abbot’s curve
Wp
Wt
1p
Wt⫽ total height of the waviness profile
Wa⫽ arithmetic mean of the deviation of the waviness profile from the mean line
Wp⫽ maximum height of the waviness profile
(d) Roughness of the profile
Ra
Rp
Rt
1p
Rt⫽ total height of the roughness profile
Ra⫽ arithmetic mean of the deviation of the roughness profile from the mean line
Rp ⫽ maximum height of the roughness profile
Filtration
Fig. 1. Parameters of profile analysis used in this work: (a) total profile; (b) Abbott’s curves and parameters; (c) waviness profile; and (d) roughness profile
PRO
OF
S
characterisation of surfaces after various treatments. Surfometry analyses realised in the same conditions on a series of profiles measured at 300ìm gives a three-dimensional (3-D) representation of the surfaces.
Results
Concrete surface quality
The results obtained for surface roughness evaluation as well as the observation of the microstructure with a scanning electron microscope (SEM) showed that con-crete surfaces were significantly different after various treatments (Table 2). On the basis of the results, the following conclusions can be drawn.
(a) The waviness parameters are about 5% smaller than the corresponding ones deduced from the total profile parameters for all types of treatment. This confirmed that the heights and holes of the total profile have not been ‘cut’ too much and the global shape of the profile has been preserved through the waviness.
(b) The ‘roughest’ surface was obtained after shotblast-ing (45 s) and the least rough for the sample with-out treatment. The waviness parameters Wt, Waand
Wp increased from five times for grinding up to 80
times for shotblasting compared with the roughness of concrete surface without treatment (Fig. 2). (c) The parameters of Abbott’s curve were rising in
the same order as the waviness parameters (Fig. 3). This means that the more aggressive method of concrete treatment makes the profile more rough, the relative height of the peaks is larger (CR) as
well as the depth of the profile (CF) and the
rela-tive height of the holes (CL). Abbott’s curves show
that the surfaces prepared by grinding, sandblasting as well as hand-milling have a similar geometry to the formworked concrete surface in which the roughness is relatively low. The surfaces resulting from shotblasting (20 and 35 s, respectively) and after mechanical milling belong to the second group of surface geometry with medium rough-ness. Significantly rougher surfaces with large peaks and holes were obtained after shotblasting for 45 s.
(d) The value of waviness parameters and parameters of Abbott’s curve increase with the time of shot-blasting and when hand-milling is replaced by mechanical milling.
(e) The roughness parameters Ra, Rp and Rt were
two-and-a-half to four times higher than those obtained for the formworked concrete surface. There was no significant difference for roughness parameters be-tween grinding, sandblasting, milling and shotblast-ing. This behaviour was already observed for the comparison between sandblasted and polished con-crete surfaces.22 Moreover, roughness parameters
for sandblasted surfaces are very close to those determined by Courard22 with the same stylus for quite different concrete; for example, Ra was equal
to 15 and 16ìm, respectively. The results confirm that the surface treatment technique has no major influence on the micro-roughness (‘high-frequency waves’) of the profile (Fig. 4).
Pull-off strength
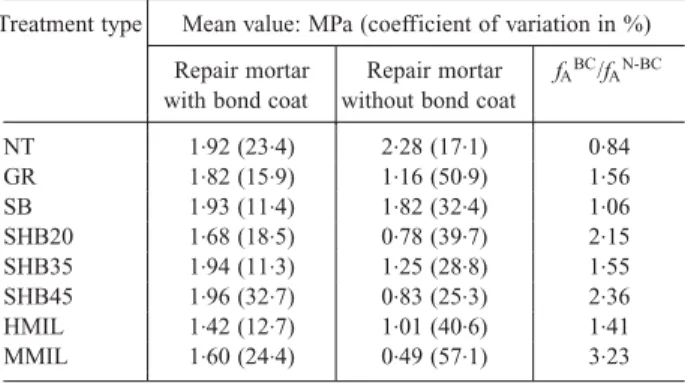
The results of pull-off strength measurements (Table 3) for the overlays prepared with bond coat in accor-dance with producer’s technical data, were relatively close to each other: 1.4 MPa being the lowest value and 2.0 MPa being the highest. In ‘bond coat’ group, the highest pull-off strength was obtained for the samples after shotblasting and sandblasting as well as the sam-ples without treatment. The lowest value in this group (1.4 MPa) was obtained for samples prepared by milling.
The application of the overlay without the bond coat generally induced a decrease in pull-off strength. The lowest value (0.5 MPa) was obtained for concrete after mechanical milling. For sandblasted and untreated sam-ples, the lack of bond coat did not induce significant changes in the pull-off strength values. In general, the application of the bond coat caused the decrease of the coefficient of variation of the pull-off strength, due to the surface ‘uniformisation’ by the bond coat. In the case of untreated surfaces and after shotblasting for 45 s, only the coefficient of variation increased. The highest variation in the pull-off strength was obtained for milling and shotblasting in the case of repair with bond coat and for grinding and sandblasting when bond coat was not applied.
The surface roughness and the presence of the bond coat had an effect on the type of failure (Fig. 5(a)). In the case of overlays with bond coat, cohesion failures were only observed in the concrete substrate. The inter-face failure mode was predominant for overlays applied without the bond coat. The percentage of interface fail-ure ranged from 50% for shotblasting to 80% for con-crete without treatment. However, the pull-off strength calculated for two different modes of failure (Fig. 5(b)) showed relatively low differences for both failure modes in the case of shotblasting and milling. This confirmed that vigorous treatments like shotblasting or milling, which produce microcracks in the near-surface layer (see Table 2), may induce the ‘unsoundness’ of concrete.18,19 This implies a relatively low value for pull-off strength in cohesive failure.
Analysis of the effect of surface concrete
treatment on the adhesion
The results (Fig. 6) showed that relationships be-tween surface roughness and pull-off strength does not
PRO
OF
S
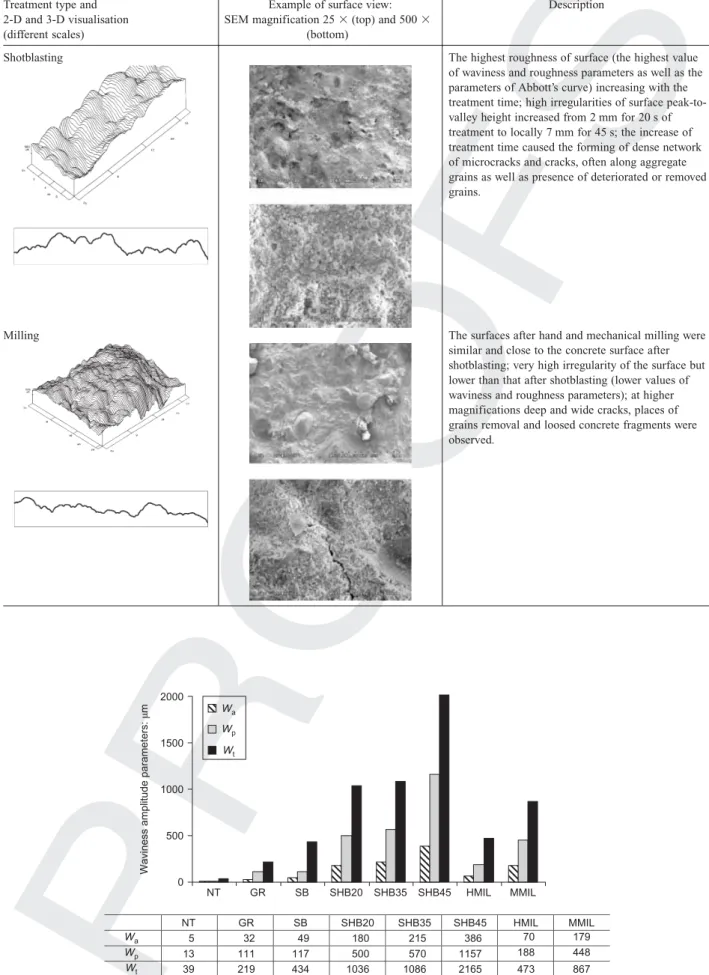
Table 2. Profile analysis and SEM observation
Treatment type and 2-D and 3-D visualisation (different scales)
Example of surface view: SEM magnification 25 3 (top) and 500 3
(bottom)
Description
No treatment (samples without bleeding) Typical roughness of formworked concrete: the flattest surface (the lowest value of waviness and roughness parameters) from tested ones, slightly undulated with shallow valleys without sharp edges (the lowest value of the parameters of Abbott’s curve); at higher magnifications small micro-cracks, probably formed during concrete setting, were observed.
Grinding Low, uniform roughness higher than in the case of samples without treatment (approx. five times higher value of the waviness and roughness parameters); surface without sharp edges with rarely and non-uniformly located valleys at the surface (parameter CFa little higher than for the surface without
treatment); at higher magnifications the narrow cracks were observed.
Sandblasting The surface similar to that after grinding (similar value of the Wpparameter and CRbut other
parameters were higher); relatively high value of CL
in comparison with the surface without treatment; shallow irregularities of surface peak-to-valley height did not exceed 1 mm; at higher magnifications sharp edges of aggregate grains and microcracks, very often forming non-uniform network, were observed.
(continued)
PRO
OF
S
Table 2. Continued
Treatment type and 2-D and 3-D visualisation (different scales)
Example of surface view: SEM magnification 25 3 (top) and 500 3
(bottom)
Description
Shotblasting The highest roughness of surface (the highest value of waviness and roughness parameters as well as the parameters of Abbott’s curve) increasing with the treatment time; high irregularities of surface peak-to-valley height increased from 2 mm for 20 s of treatment to locally 7 mm for 45 s; the increase of treatment time caused the forming of dense network of microcracks and cracks, often along aggregate grains as well as presence of deteriorated or removed grains.
Milling The surfaces after hand and mechanical milling were similar and close to the concrete surface after shotblasting; very high irregularity of the surface but lower than that after shotblasting (lower values of waviness and roughness parameters); at higher magnifications deep and wide cracks, places of grains removal and loosed concrete fragments were observed. NT GR SB SHB20 SHB35 SHB45 HMIL MMIL Wa Wp Wt NT GR SB SHB20 SHB35 SHB45 HMIL MMIL 5 32 49 180 215 386 70 179 13 111 117 500 570 1157 188 448 39 219 434 1036 1086 2165 473 867 Wa Wp Wt 2000 1500 1000 500 0
Waviness amplitude parameters:
µ
m
Fig. 2. Amplitude parameters: Wt, Waand Wpfor waviness profile
PRO
OF
S
SHB45 NT GR SB SHB20 SHB35 SHB45 HMIL MMIL NT GR SB SHB20 SHB35 SHB45 HMIL MMIL 6 57 50 291 289 698 116 188 9 55 77 318 406 619 107 351 19 69 144 316 291 669 196 248 Cr Cf Cl 800 600 400 200 0Abbot’s curve parameters:
µ m Cr Cf Cl (b) NT GR SB SHB20 SHB35 HMIL MMIL 3 2 1 0 20 40 60 80 100 Bearing ratio: % 0 500 1000 1500 2000 2500 3000 Cutting depth: µ m (a)
Fig. 3. Abbott’s curve and CL, CRand CFparameters for total profile. 1,2,3¼ explanation given in text
SHB45 NT GR SB SHB20 SHB35 HMIL MMIL Wa Wp Wt NT GR SB SHB20 SHB35 SHB45 HMIL MMIL 5 15 15 19 18 17 16 19 10 32 30 35 34 34 33 37 42 105 95 130 116 113 113 123 Ra Rp Rt 140 120 100 80 0
Roughness amplitude parameters:
µ
m
60
40
20
Fig. 4. Amplitude parameters Ra, Rpand Rtfor roughness profile
PRO
OF
S
exist in the case of repair systems with bond coat. For the samples without bond coat, the regression functions had relatively low correlation coefficients, ranging from r¼ 0.78 for Wt up to r¼ 0.84 for Wp. Similar
statistical significance of the relationships were ob-tained for parameters of Abbott’s curve. The best fitting was determined for the parameter CR(r¼ 0.84).
The regression functions showed, to some degree, unexpected trends. As the surface roughness increased, the pull-off strength for the systems without bond coat decreased. The most significant effect was observed for the parameters describing the height of the profile peaks. This indicates that surface roughness can be an important factor in influencing adhesion in repair sys-tems. The crucial point is suitable rheological proper-Table 3. Pull-off strength measurements of repair mortar with
and without bond coat
Treatment type Mean value: MPa (coefficient of variation in %) Repair mortar
with bond coat
Repair mortar without bond coat
fABC/fAN-BC NT 1.92 (23.4) 2.28 (17.1) 0.84 GR 1.82 (15.9) 1.16 (50.9) 1.56 SB 1.93 (11.4) 1.82 (32.4) 1.06 SHB20 1.68 (18.5) 0.78 (39.7) 2.15 SHB35 1.94 (11.3) 1.25 (28.8) 1.55 SHB45 1.96 (32.7) 0.83 (25.3) 2.36 HMIL 1.42 (12.7) 1.01 (40.6) 1.41 MMIL 1.60 (24.4) 0.49 (57.1) 3.23 fABC¼ the pull-off strength for repair with bond coat
fAN-BC¼ the pull-off strength for repair without bond coat
(a) Treatment type 3·5 3·0 2·5 2·0 1·5 1·0 0·5 0·0
Pull-off strength: MPa
Without BC – interface failure Without BC – interface failure Without BC – interface failure (b) 31 21 42 40 46 50 29 31 69 79 58 60 54 50 71 69 Cohesive failure % Adhesive failure % NT GR SB SHB20 SHB35 SHB45 HMIL MMIL 100% 90% 80% 70% 60% 50% 40% 30% 20% 10% 0% NT GR SB SHB20 SHB35 SHB45 HMIL MMIL 2·08 2·68 1·92 0·93 1·98 1·82 1·62 2·13 1·93 0·76 0·83 1·68 0·92 1·38 1·94 0·69 0·96 1·96 0·94 1·51 1·42 0·37 0·78 1·6
Fig. 5. Fraction of adhesive and cohesive failure for: (a) repair without bond coat; and (b) pull-off strength obtained at cohesive and adhesive failure modes. BC¼ bond coat
PRO
OF
S
ties of bond coat and/or repair mortar to fulfil irregula-rities at the interface zone. The repair material tested had a relatively low workability, partially due to the content of microfibres. Additionally, it was observed that the microfibres were blocked on the irregularities of the profile (Fig. 7). This caused the appearance of voids at the interface zone: an increase in roughness induces a high voids fraction (Fig. 8) The flat surfaces resulting from ‘soft’ treatments like sandblasting and grinding as well as surfaces without treatment, were characterised by a relatively low void content at the interface zone. For more ‘aggressive’ treatments, higher void content was observed. This kind of behaviour was observed also by Fukuzawa et al.17 in the case of chipping. They have obtained a statistically significant relationship between the pull-off strength and the para-meters of surface roughness for less vigorous treat-ments like sandblasting, disc-grinding and sandpaper polishing. The results of the pull-off strength for chip-ping were excluded because of their remarkably lower values in comparison with the results for the
sand-blasted surface with similar roughness. The authors have suggested that the lower adhesion is due to the presence of flaws at the interface created after chip-ping. r ⫽ 0·82 0 200 400 600 800 CF: µm 2·5 2·0 1·5 1·0 0·5 0 Pull-off: MPa (d) r ⫽ 0·82 0 100 200 300 400 500 Wa: µm 2·5 2·0 1·5 1·0 0·5 0 Pull-off: MPa (a) r ⫽ 0·84 0 200 400 600 800 CR: µm 2·5 2·0 1·5 1·0 0·5 0 Pull-off: MPa (e) r ⫽ 0·84 0 500 1000 1500 Wp: µm 2·5 2·0 1·5 1·0 0·5 0 Pull-off: MPa (b) r ⫽ 0·69 0 200 400 600 800 CL: µm 2·5 2·0 1·5 1·0 0·5 0 Pull-off: MPa (f ) r ⫽ 0·78 0 500 1000 1500 2000 2500 Wt: µm 2·5 2·0 1·5 1·0 0·5 0 Pull-off: MPa (c)
Fig. 6. Regression curves between pull-off strength and statistical and amplitude parameters of the waviness profile
Fig. 7. View of the glass microfibre at the interface surface
PRO
OF
S
This could confirm that some optimal threshold va-lue of roughness exists. Additionally, for the samples after aggressive treatment, a near-surface layer of un-sound concrete was observed. This microscopic obser-vation could be related to the low value of pull-off strengths in the case of cohesive failure for samples after shotblasting and milling. It also indicates that
quantitative information concerning cracks might re-duce scatter in statistical regressions. The results con-firmed that the creation of the adhesion in repair techniques is a complex phenomenon resulting from a synergic effect of the surface roughness of the concrete substrate, the presence of microcracks and deteriorated aggregates and the processing properties of the repair
R S R S R S R S R S R S R S R S R R BC BC BC Voids BC
Fig. 8. View of the interface between concrete substrate and repair material with bond coat (left) and without (right): (a) without treatment; (b) sandblasting; (c) mechanical milling. S¼ concrete substrate, BC ¼ bond coat, R ¼ repair mortar
PRO
OF
S
materials as well. The effect of lower workability of the repair material can be lowered by using treatments that give a relatively smooth surface (e.g. sandblasting) and the application of a suitable bond coat.
Conclusions
The following conclusions may be reached from the present investigations concerning the influence of sur-face treatment on the adhesion of repair material. (a) The creation of the adhesion in repair system is a
complex phenomenon resulted from a synergic ef-fect of the surface roughness of concrete substrate, the presence of microcracks in the near-surface layer and deteriorated grains of aggregate as well as processing properties of the repair materials including interfacial tension between the bond coat and/or repair materials.
(b) In the case of the tested repair systems, the rough-ness of concrete substrate influences the adhesion mainly in the case of overlays applied without bond coat; the bond coat unified the adhesion level irrespective of the surface roughness. This indi-cates that suitable rheological properties of bond coat and/or repair mortar are necessary to develop good bond by filling surface irregularities and bridging the cracks and loose concrete pieces. (c) The number and the size of cracks are dependent
on the surface treatment: shotblasting and milling produce more cracks and any increase in duration of the treatment induces higher deterioration of the near-surface layer.
(d) The surface roughness and the presence of bond coat have an effect on the type of failure. Cohesion failure is more frequent in the case of the use of a bond coat and is directly influenced by the micro-cracks.
(e) The treatment of the concrete surface has a profit-able impact when it is used to clean a concrete surface from bond-detrimental layers or to remove unbound concrete pieces. As the ‘aggressiveness’ of surface treatment increases (from sandblasting to milling, through shotblasting,) the necessity of using a bond coat increases.
From the results of the surfometry and profilometry analysis, the following conclusions can be formulated. (a) Amplitude parameters are able to quantitatively
characterise the profile by analysing holes, peaks, frequencies and amplitudes of the irregularities The difference between the profiles is more effec-tive at the level of waviness than roughness: on its own waviness profile, roughness amplitude is not statistically different for the different profiles. (b) Xa parameter (arithmetic mean of the departure of
the profile from the mean line) and the parameter CF deduced from Abbott’s curve are the most
dis-criminating parameters for the comparison of sur-face preparation techniques.
(c) Taking into account the waviness parameters Wa,
Wp and Wt as well as the parameters of Abbott’s
curve, the surface treatments can be classified in order of their ‘aggressiveness’ as follows (least aggressive first): grinding, sandblasting, hand milling, mechanical milling, shotblasting.
(d) The results of this work show also the need for improvement of the profilometry device used to test rough concrete surface by developing a new type of stylus or the use of a non-contact indicator.
Acknowledgements
The authors are grateful to Professor L. Czarnecki, head of the Building Materials Engineering Division at the Warsaw University of Technology and Professor R. Degeimbre, head of the Building Materials Laboratory at the University of Liege, for their valuable discussion and remarks. The authors express their sincere appre-ciation to Professor J. Bozet, head of the Mechanical Engineering and Tribology Department and M. Ne´lis, research engineer, for the opportunity to use the SUR-FASCAN test device. The research project was finan-cially supported by the Government of Poland (KBN) and the Regional Government of Wallonia (DRI), Bel-gium. Part of the experiments have been done in the framework of a project granted by the Polish Scientific Research Committee, grant number KBN 5T07E06622.
References
1. Czarnecki L. and Emmons P. H. Repair and Protection of Concrete Structures (in Polish). Polski Cement, Krakow, 2002. 2. Czarnecki L., Vaysburd A. M., Mailvaganam N. P.,
Em-monsP. H. and McDonald J. E. Repair and rehabilitation of structures—some random thoughts. Indian Concrete Journal, 2000, 74, 13–20.
3. Czarnecki L., Garbacz A., ŁukowskiP. and Clifton J. R. Polymer Composites for Repairing of Portland Cement Con-crete: Compatibility Project. United States Department of Com-merce, National Institute of Standards and Technology, Gaithersburg, 1999, NIST Report (NISTIR 6394).
4. Sasse H. R. and Czarnecki L. Repair and protection of con-crete structures in the light of European standard prEN 1504-10. Building Materials1999, 7, 30–33, (in Polish).
5. American Concrete Institute. ACI Manual of Concrete Practice, Part 4: Concrete Repair Guide. ACI, 1998, ACI Com-mittee 546, 41 pp.
6. Slater A. Simple guidelines to better surface preparation. Con-crete Repair Bulletin, 2001, Jan./Feb., 4–5.
7. Building Research Institute. Guidelines for Technical Ap-proval—ZUAT-15/VI.02 Products for Repair of Deteriorated Concrete Structures (in Polish). Building Research Institute, EOTA member, Warszawa, 1997.
8. Belgian Guidelines G0007: Agreement and Certification Guide-lines for Hydraulic Binder-Based Repair Mortars. Belgian Un-ion for Technical Agreement in ConstructUn-ion (UBAtc), Sector
PRO
OF
S
Civil Engineering, Walloon Ministry of Equipment and Trans-portation, Lie`ge, 2002.
9. Fiebrich M. H. Influence of the surface roughness on the adhesion between concrete and gunite mortars overlays. Pro-ceedings of the 2nd Bolomey Workshop on Adherence of Young and Old Concrete, Wittmann, Aedification Verlag, Untereng-stringen, 1994, 107–114.
10. Courard L. Parametric study for the creation of the interface between concrete and repairs products. Materials and Struc-tures, 2000, 33, 65–72.
11. Courard L. Evaluation of the thermodynamic properties of concrete substrates and cement slurries modified with admix-tures. Materials and Structures, 2002, 35, 149–155.
12. Courard L. Contribution a` l’Analyse des Parame`tres Influen-c¸ant la Cre´ation de l’Interface Entre un Be´ton et un Syste`me de Re´paration. Appe´tence et Adhe´rence: Cause et Effet d’une Liaison. PhD thesis, Universite´ de Lie`ge, Collection des Publications de la Faculte´ des Sciences Applique´es, 1999, No. 192, 213 pp. (in French).
13. Austin S., RobinsP. and Pan Y. Tensile bond testing of con-crete repairs. Materials and Structures, 1995, 28, 249–259. 14. Czarnecki L., Garbacz A. and Kostana K. The effect of
concrete surface roughness on adhesion in industrial floor sys-tems. Proceedings of the 5th Colloquium Industrial Floors, Esslingen, 2003.
15. Mackowski R. The effect of concrete surface treatment on the quality of the concrete structure repair. Proceedings of the 10th Conference on Corrosion and Durability of structures—Kontra 2000, Zakopane, 2000, pp. 221–226, (in Polish).
16. Silfwerbrand J. and Paulsson J. Better bonding of bridge deck overlays. Concrete International, 1998, 20, No. 10, 56–61. 17. Fukuzawa K., MitsuiM. and Numao T. Surface roughness indexes for evaluation of bond strengths between CRFP sheet and concrete. Proceedings of the 10th International Congress on
Polymers in Concrete—ICPIC 2001, Honolulu, 2001, paper no. 12.
18. Silfwerbrand J. Improving concrete bond in repaired bridge decks. Concrete International 12, 61–66.
19. Courard L. and Bissonnette B. Quantification of the influ-ence of concrete removal techniques upon residual cracking. Concrete International (submitted for publication).
20. Pretorius J. and Kruger D. The influence of surface rough-ness on the bond strength of concrete repairs. Proceedings of the 10th International Congress on Polymers in Concrete— ICPIC 2001, Honolulu, 2001, paper no. 13.
21. Courard L. and Nelis M. Surface analysis of mineral sub-strates for repair works: roughness evaluation by profilometry and surfometry analysis. Magazine of Concrete Research, 2003, 55, No. 4, 355–366.
22. Courard L. Parametric definition of sandblasted and polished concrete surfaces. Proceedings of the 9th International Congress on Polymers in Concrete, Bologna, 1998, pp. 771–778. 23. Czarnecki L., Garbacz A. and Kurach J. On the
character-ization of polymer concrete fracture surface. Cement and Con-crete Composites, 2001, 23, 399–409.
24. Perez F., Bissonnette B. and Courard L. Outils de caracte´r-isation parame´trique de la rugosite´ des surfaces en be´ton: nou-veaux de´veloppements. Journe´es Scientifiques du RF2B, 25–26
August, Sherbrooke, 2003.
25. SherringtonI. and Smith E. H. Modern measurement techni-ques in surface metrology—part I: stylus instruments, electron microscopy and non-optical comparators. Wear, 1988, 125, 271–288.
Discussion contributions on this paper should reach the editor by ???