A physico-chemical model to study the ion density
distribution in the inner coma of comet C/2016 R2
(Pan-STARRS)
Susarla Raghuram,
1?Anil Bhardwaj,
1Damien Hutsemékers,
2Cyrielle Opitom,
3Jean Manfroid,
2and Emmanuel Jehin
21Physical Research Laboratory, Ahmedabad, 380009, India.
2STAR Institute - University of Liège, Allée du 6 Août 19c, B-4000 Liège, Belgium.
3ESO (European Southern Observatory) - Alonso de Cordova 3107, Vitacura, Santiago Chile.
Accepted 2020 December 4. Received 2020 December 4; in original form 2020 August 23
ABSTRACT
The recent observations show that comet C/2016 R2 (Pan-Starrs) has a unique and peculiar composition when compared with several other comets observed at 2.8 au he-liocentric distance. Assuming solar resonance fluorescence is the only excitation source, the observed ionic emission intensity ratios are used to constrain the corresponding neutral abundances in this comet. We developed a physico-chemical model to study the ion density distribution in the inner coma of this comet by accounting for photon and electron impact ionization of neutrals, charge exchange and proton transfer re-actions between ions and neutrals, and electron-ion thermal recombination rere-actions. Our calculations show that CO+2 and CO+are the major ions in the inner coma, and close to the surface of nucleus CH3OH+, CH3OH+2 and O
+
2 are also important ions. By considering various excitation sources, we also studied the emission mechanisms of different excited states of CO+, CO+2, N+2, and H2O+. We found that the photon and electron impact ionization and excitation of corresponding neutrals significantly con-tribute to the observed ionic emissions for radial distances smaller than 300 km and at larger distances, solar resonance fluorescence is the major excitation source. Our mod-elled ion emission intensity ratios are consistent with the ground-based observations. Based on the modelled emission processes, we suggest that the observed ion emission intensity ratios can be used to derive the neutral composition in the cometary coma only when the ion densities are significantly controlled by photon and photoelectron impact ionization of neutrals rather than by the ion-neutral chemistry.
Key words: molecular processes – techniques: spectroscopic – methods: analytical – comets: individual: C/2016 R2 – ultraviolet: planetary systems
1 INTRODUCTION
Cometary nuclei are formed due to the agglomeration of dif-ferent icy grains and dust particles in the outer reaches of the Solar nebula. As the comet approaches the Sun, sublima-tion of these ices causes a giant gaseous transient atmosphere around the nucleus, which is called a cometary coma. At a given heliocentric distance, sublimation rate of the nucleus is the key deciding factor that determines the dynamical ac-tivity of the cometary coma. Most of the observations have shown that during the peak activity of a comet, water is the most dominant component of a cometary coma, whereas at
? E-mail:raghuramsusarla@gmail.com
larger heliocentric distances CO and CO2 are the dominant
species. The interaction of solar radiation with cometary species drives a chain of chemical reactions in the inner coma and also leads to various spectroscopic emissions. Remote observation of different spectroscopic emissions from neu-trals and ions is a potential tool to study the global com-position of comets and the dynamical activity of cometary plasma (Feldman et al. 2004;Bockelée-Morvan et al. 2004). For an active comet, like 1P/Halley, the solar wind starts to interact with cometary neutrals and ionic species more than a million kilometres away from the nucleus which leads to complex structures in the cometary plasma and magnetic fields (Ip 2004). Depending on the cometary activity and so-lar wind conditions, various dynamical plasma boundaries, such as bow shock, the cometopause, the collisionopause,
and the diamagnetic cavity, manifest in the cometary coma. A detailed description of these boundaries is provided in a tutorial byCravens(1989).
The study of cometary plasma composition has been subjected to a great interest after the ion mass spectrometer onboard Giotto spacecraft detected many peaks in the mass range 12 and 120 amu (Balsiger et al. 1986; Krankowsky
et al. 1986;Mitchell et al. 1987;Altwegg et al. 1993). By
de-veloping photochemical models, numerous studies focused on comet 1P/Halley explained the observed ion distribu-tion in a water-dominated coma. (Allen et al. 1987;
Weg-mann et al. 1987; Schmidt et al. 1988; Cravens 1989; Ip
et al. 1990; Gan & Cravens 1990; Bhardwaj et al. 1990,
1996;Bhardwaj 1999;Haider et al. 1993;Häberli et al. 1995;
Haider & Bhardwaj 1997,2005;Rubin et al. 2009;Cordiner
& Charnley 2014). By making two years of observations,
the recent Rosetta space mission on comet 67P/Churyumov-Gerasimenko has revolutionized our understanding of the ac-tivity of the cometary coma. During the Rosetta observation period, continuous measurements around the nucleus were helpful to study the evolution of ion and neutral distribution and also the driving photochemical processes in the coma. Several modelling works on this comet have shown that ion composition in the coma varies based on the sublimation rate of the nucleus (Vigren & Galand 2013;Fuselier et al.
2015,2016;Galand et al. 2016;Vigren et al. 2017;Heritier
et al. 2017,2018;Beth et al. 2019). All these studies show
that solar photons are the primary energy source that deter-mine the ion composition in the inner coma. Solar extreme ultraviolet photons having an energy more than 12 eV ion-ize H2O and produce H2O+, and the collisions among these
species quickly lead to the formation of H3O+. The
subli-mated parent species such as CH3OH, NH3, HCN, HCOOH,
CH3CHO, have high proton affinities compared to that of
H2O, causing the loss of H3O+ in the inner coma.Haider &
Bhardwaj(2005) developed a comprehensive chemical
net-work to study the ion distribution in comet 1P/Halley. Their calculations show that NH+4 is the most dominant ion in the inner coma followed by H3O+and CH3OH+2 ions. Similarly,
the model calculations of Heritier et al. (2017) on comet 67P/Churyumov-Gerasimenko showed that NH+4, CH3OH+2,
H3O+, H3S+, HCNH+ are the important ions in the inner
coma. They also showed that the densities of these ions vary with the relative mixing ratios of corresponding proton affin-ity species coming from the nucleus. Even if the mixing ra-tios of parent species, which have high proton affinity, are very low (<2%), they can play a significant role in modifying the ionospheric composition of the inner coma. Hence, the ion distribution in the cometary coma essentially depends on the neutral composition and photochemical reactions.
The main volatile constituent of the inner coma, H2O,
cannot be detected in the visible due to the lack of elec-tronic transition, which is also the case for CO2 and N2.
Several ground based observatories studied the composi-tion of cometary plasma by making spectroscopic obser-vation of different ions. The observed emission intensities of these ions were used to constrain their respective par-ent species abundances in the coma. H2O+ has been
ob-served in various comets from ground-based observatories
(Delsemme & Combi 1979;Disanti et al. 1990;Häberli et al.
1997;Wegmann et al. 1999). Spectroscopic emissions from
CO+have been used to study the dynamics of the plasma in
cometary ion tails (Ip 2004;Arpigny 1964;Krishna Swamy
1979;Swamy 1986;Combi & Delsemme 1980;Larson 1980;
Cochran & Cochran 1991; Cochran et al. 2000). So far
a few detections of N+2 emissions on comets from ground
based observations are reported (Wyckoff & Theobald 1989;
Lutz et al. 1993;Korsun et al. 2008, 2014). But the
pres-ence of N2 was more conclusive in comet
67P/Churyumov-Gerasimenko from Rosetta in situ measurements (Rubin
et al. 2015). As discussed before, besides the composition
of parent species, the collisional chemistry can significantly change the ion composition in the inner coma. Hence, the knowledge of formation and loss processes of different ions is essential to constrain their corresponding neutral abun-dances based on the observed ionic emission intensities.
Several recent observations of comet C/2016 R2 (Pan-Starrs) - hereafter C/2016 R2 - have shown that the cometary coma is predominantly composed of CO and re-markably depleted in water, when it was at 2.75 au away from the Sun (Biver et al. 2018; Cochran & McKay 2018;
Wierzchos & Womack 2018; Opitom et al. 2019; McKay
et al. 2019; Venkataramani et al. 2020). Several
multi-wavelength observations of this comet have shown that it has substantially low H2O production rate, which is
con-trary to many cometary observations made at this heliocen-tric distance (McKay et al. 2019;Biver et al. 2018).Cochran
& McKay(2018) were the first to report the strong
emis-sion features of CO+ comet tail bands (A2Π → X2Σ) and N+2 first negative bands (B2Σ+ → X2
Σ) in comet C/2016 R2, followed by Biver et al. (2018) and Opitom et al. (2019). Besides these emissions, Opitom et al. (2019) also observed CO+
2 Fox-Duffendack-Barker band system (Ae2Π → e
X2Π) in their high resolution optical spectra of this comet.
Venkataramani et al.(2020) reported a tentative detection
of H2O+(Ae 2
A1 →Xe 2
B1) (0-8-0) emission in their low
res-olution observed spectra. But they also claim that the de-tection is not conclusive due to the strong blend of CO+ doublet emission. However, it should be noted that these H2O+ emissions are not seen in other high resolution
opti-cal observations. Assuming that solar resonance florescence is the only excitation source, the measured ionic emission in-tensity ratios are used to constrain their respective neutral composition in the coma. As discussed before, besides the neutral composition, the ion density in the coma is strongly controlled by ion-neutral chemical reactions. In this case, the conversion of observed ion emission intensity ratios into corresponding neutral density ratios is not straightforward. In the light of recent observations of comet C/2016 R2
(Opitom et al. 2019), we aim to explore the
photochem-istry of CO-dominated and water-depleted comet and also the emission mechanisms of different ions. We developed a physico-chemical model for comet C/2016 R2 to study the ion density distribution in the inner coma by incorporating different excitation sources and various chemical reactions. Using our model, we also studied various photochemical pro-cesses of different ionic emissions in this comet, which were observed by various ground based observatories. We describe the model inputs such as the neutral composition of the coma, the atomic and molecular parameters, the chemical network of ion-neutral chemistry, and the photochemical re-actions of excited states of ions in Section3. In this section, we also explain the calculation of radial density profiles of
different ions and the emission intensity profiles of the ex-cited states of CO+2, CO+, N+2, and H2O+ as a function of
the nucleocentric projected distance. The modelled produc-tion and loss mechanisms of different ions and their density distribution, volume emissions rates of excited states, and intensity ratios of different ionic emissions are presented in Section4. The inferences of the model calculations are dis-cussed in Section 5. We summarize the current work and draw the conclusions in Section6.
2 OBSERVATIONS
Observations of comet C/ 2016 R2 were carried out on 2018 February 11–16 with the Ultraviolet-Visual Echelle Spec-trograph (UVES) mounted on the 8.2 m UT2 telescope of the European Southern Observatory Very Large Tele-scope. The slit width of 0.4400 gives a resolving power R ' 80000. Full account of the observations and data reduc-tions is given inOpitom et al.(2019).Opitom et al.(2019) used the measured fluxes for N+2 (B2Σ+→X2Σ) (0-0), CO+ 2
(Ae 2
Π→Xe 2
Π) (0-0), and CO+(A2Π→X2Σ) (2-0) band emis-sions, at respective wavelengths 391, 351 and 425 nm, to derive the ion density ratios in the coma. They also con-sidered H2O+(Ae2A1→Xe2B1) (0-8-0) band emission to
con-strain the upper limit of the H2O+abundance in the coma.
Assuming solar resonance fluorescence is the only excita-tion mechanism, the observed emission flux ratios are used to derive ionic abundance ratios. They derived ionic ratios of N+
2/CO +, CO+
2/CO
+, and H
2O+/CO+ in the cometary
coma of 0.06±0.01, 1.1±0.3, and <0.4, respectively. These ratios were computed using intensities averaged over the full slit length. For the UVES blue arm spectra where the ionic emissions of interest are located, the slit extends over ∼1.5 × 10⁴
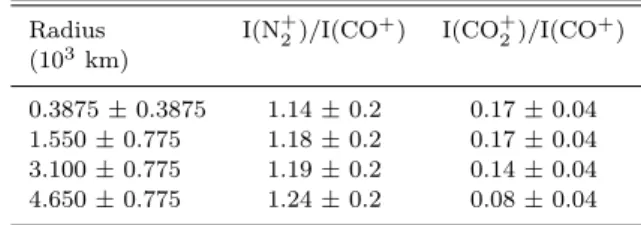
km at the comet distance. Surface brightnesses were also measured on the two-dimensional spectra, cutting the slit in chunks as done inRaghuram et al.(2020) for the [OI] spectral lines (which are located in the red arm spectra). For the blue settings, the spectra were rebinned along the spa-tial dimension so that the final pixel size projected onto the comet corresponds to 0.12500(about 220 km). Seven spatial chunks were defined, the central one ranging from -3 to +3 pixels, and the other ones corresponding to the pixel ranges [-24,-18], [-17,-11], [-10,-4], [4,10], [11,17], and [18,24]. The intensity ratios are given in Table1as a function of the pro-jected nucleocentric distance (radius). The radius is given as the central value in each subslit plus or minus the range divided by two. The measurements done on each side of the comet in a given range of nucleocentric distances were av-eraged. The errors are dominated by the uncertainties from the fitting procedure (Opitom et al. 2019). There is no sig-nificant variation of the I(N+2)/I(CO+) intensity ratio with the nucleocentric distance, while the I(CO+
2)/I(CO +) ratio
apparently decreases by a factor 2 at ∼5000 km from the nucleus.
3 MODEL INPUTS AND CALCULATIONS
The detailed description of model calculations is provided in our earlier work (Bhardwaj & Raghuram 2012;Raghuram &
Bhardwaj 2013,2014; Decock et al. 2015;Raghuram et al.
2016,2020). The model inputs such as the heliocentric and geocentric distances, the nucleus sublimation rate, and the
Table 1. The measured ionic emission intensity ratios on comet C/2016 R2 as a function of the projected distance when it was at 2.75 au heliocentric distance
Radius I(N+2)/I(CO+) I(CO+
2)/I(CO+) (103 km) 0.3875 ± 0.3875 1.14 ± 0.2 0.17 ± 0.04 1.550 ± 0.775 1.18 ± 0.2 0.17 ± 0.04 3.100 ± 0.775 1.19 ± 0.2 0.14 ± 0.04 4.650 ± 0.775 1.24 ± 0.2 0.08 ± 0.04
gaseous composition of C/2016 R2 coma are the same as de-scribed in our recent work (Raghuram et al. 2020). Here we briefly describe the neutral distribution of coma, the atomic and molecular parameters, and the chemical network used for calculating the ion density profiles and emission intensity profiles of various ions.
3.1 Neutral distribution
We consider eight neutral species viz., H2O, CO, CO2, N2,
CH3OH, CH4, NH3, and O2 as the primary composition
of the cometary coma. Abundances of these species are taken from the various ground-based observations which were made when the comet was at a heliocentric distance of 2.8 au. At this heliocentric distance,Biver et al. (2018) observed that CO is the most dominant species in the coma with a gas production rate of 1.1 × 1029s−1. We have taken the relative abundances of other neutral species viz., H2O,
CO2, N2, CH3OH, and CH4 as 0.3%, 18%, 7%, 1.1%, and
0.6%, respectively, with respect to CO production rate, from the observations of Biver et al. (2018) and McKay et al. (2019).
In a water-dominated comet, NH3 can play an
impor-tant role in modifying the ion-density distribution in the inner coma due to high proton affinity. In comet 1P/Halley, with a 1.5% mixing ratio in the coma (relative to water production rate), Haider & Bhardwaj (2005) showed that NH3 quickly reacts with water ion and produces NH+4 as
the dominant ion in the inner coma. Similarly, the mod-elling works ofVigren & Galand (2013) andHeritier et al. (2017) in comet 67P/Churyumov-Gerasimenko also showed that NH3 and CH3OH react with H2O+ and produce
pro-tonated ions. To explore the role of NH3and CH3OH in the
ion-neutral chemistry of CO-dominated coma, we incorpo-rated the abundance of these species based on the observa-tions of McKay et al. (2019) and Biver et al. (2018). We considered 0.01% of NH3 relative to CO production rate in
the model based on the derived upper limit byMcKay et al. (2019).
The detection of O2 in comets
67P/Churyumov-Gerasimenko and 1P/Halley suggest that this species might be a common and abundant primary species (Bieler et al.
2015;Rubin et al. 2015). To explore the role of this neutral
species in determining the O+2 ion density in the C/2016 R2 coma, we assumed 1% of O2 abundance with respect to
CO production rate (Raghuram et al. 2020). However, we show that the inclusion of this species in the model with a large abundance does not influence the modelled ion-density profiles.
Other species such as HCN, C2H6 and H2CO are also
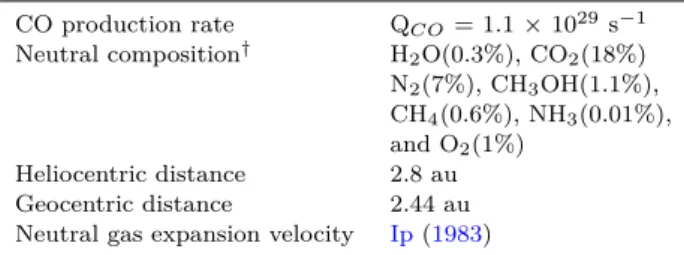
Table 2. Summary of the baseline input parameters used in the model CO production rate QCO= 1.1 × 1029s−1 Neutral composition† H 2O(0.3%), CO2(18%) N2(7%), CH3OH(1.1%), CH4(0.6%), NH3(0.01%), and O2(1%) Heliocentric distance 2.8 au Geocentric distance 2.44 au Neutral gas expansion velocity Ip(1983)
†The values in the brackets are the abundances of the species relative to the CO production rate
smaller by more than three orders of magnitude compared to that of CO (McKay et al. 2019). Due to their low rela-tive abundances in comet C/2016 R2, they do not play any significant role in the ion-neutral chemistry. Hence, we did not account for these species in our model.
Density profiles for the primary neutral species are de-termined using the Haser’s distribution formula and the model calculations are done under spherical symmetric as-sumption (Haser 1957). The neutral gas expansion velocity profile is taken from the hydro-dynamical calculations ofIp (1983) for the CO-dominated coma. We assumed that the electron temperature profile is the same as the thermal tem-perature profile derived byIp(1983) and the impact of this assumption on the modelled emission intensity ratios will be discussed later. Our baseline model input parameters are tabulated in Table2.
3.2 Atomic and molecular parameters
3.2.1 Cross sections
The photon absorption and ionization cross sections of various neutrals are taken from the compilation of
Hueb-ner et al. (1992), which are accessible from a web link
(https://phidrates.space.swri.edu). Electron impact
ioniza-tion and excitaioniza-tion cross secioniza-tions of neutral species are com-piled from different works (Itikawa & Mason 2005;Itikawa
2002;Itikawa 2009;Shirai et al. 2001;Tabata et al. 2006;Liu
& Victor 1994;Srivastava et al. 1996;Straub et al. 1997;Rao
& Srivastava 1992).
The branching ratios for the photoionization of H2O,
N2, CO2, and CO, producing the respective excited
H2O+(Ae2A1), N+2(B 2
Σ+u), CO+2(Ae2Πu,3/2) and CO+(A2Π)
are taken from Avakyan et al. (1998). Based on the mea-sured photon branching ratio, we assumed that about 50% of H2O+ is produced in the Ae
2
A1 excited state for
elec-tron impact ionization. Later we discuss the impact of this assumption on the modelled intensity profile. The electron impact cross sections for CO+2, CO+, and N+
2 producing in
the Ae 2
Πu,3/2, A2Π, and B2Σ+u excited states, respectively,
are taken fromShirai et al.(2001) andTabata et al.(2006). We obtained Frank-Condon factors and branching ratios for the observed electronic transition of CO+ (2-0), CO+2 (0-0), N+
2(0-0) and H2O+(8-0) from different theoretical works
(McCallum & Nicholls 1971;Kim 1999;Judge & Lee 1973;
Arqueros & Campos 1982; Jain & Sahni 1966;Lutz et al.
1993;Lofthus & Krupenie 1977;Lutz 1987). We multiplied
these branching ratios and Frank-Condon factors with
cor-responding volume emission rates, which are calculated for photon and electron impact excitation of neutral, to calcu-late the corresponding band emission intensities of the ions. The solar resonance fluorescence efficiencies (g-factors) of H2O+, CO+, N+2, and CO
+
2 for corresponding ionic band
emissions are taken as 4.2 × 10⁻³ (gH2O+), 3.55 × 10 −3 (gCO+), 7 × 10⁻²(g N2+), and 4.96 × 10 −4 (gCO+ 2 ) photons
s−1 mol−1 from Lutz et al. (1993), Magnani & A’Hearn
(1986), Lutz et al. (1993), and Kim (1999), respectively.
These excitation rate factors are scaled as a function of in-verse square of heliocentric distance of the comet.
3.2.2 Chemical network
We considered various ionization processes of neutrals by photons and photoelectrons which produce different ions in the coma. Various chemical reactions such as charge exchange, proton transfer, and thermal recombination are compiled from the literature. Most of these reactions are taken from the UMIST Rate2012 data base (McElroy et al.
2013, http://udfa.ajmarkwick.net) and their accuracy is
within 25%. The chemical network used to model ion density distribution in C/2016 R2 is presented in TablesA1andA2 of AppendixA. We calculated various photon and electron impact initiated photochemical reaction rates that produce the excited states of CO+2, CO+, H
2O+, and N+2 ions, which
are tabulated in TableB1of Appendix B.
3.3 Calculations
3.3.1 Ion density profiles
The degradation of the solar radiation and calculation of suprathermal electron flux in the cometary coma was de-scribed in our earlier work (Bhardwaj et al. 1990, 1996;
Bhardwaj & Raghuram 2012;Raghuram et al. 2020;
Raghu-ram & Bhardwaj 2020, 2013; Bhardwaj 1999). Using the
modelled solar photon and the suprathermal electron flux profiles and corresponding cross sections, we determined the volume production rates of different ions for photoion-ization and electron impact ionphotoion-ization of neutrals. Besides the photon and electron impact ionization, various chem-ical reactions are also accounted for to determine radial ion density profiles. Based on the observed neutral com-position, we modelled density distribution of thirteen ions viz., H2O+, H3O+, CO+2, CO +, O+ 2, N + 2, NH + 3, CH3OH+, CH+4, CH3OH+2, NH + 4, C +
, and O+ in the cometary coma. We solved the following time-dependent spherical continu-ity equation for all the ions simultaneously to determine the steady state ion density profiles :
∂ni ∂t + 1 r2 ∂(nivir2) ∂r = Pi− niLi (1)
where ni, Pi, and Li are the ion density, total production
rate, and loss frequency of the ith ion at radial distance r.
vi is the mean ion outflow velocity which is assumed to be
same as neutral velocity.
3.3.2 Emission intensities of CO+2, CO+, N+2, and H2O+
We accounted for photoionization, electron impact ioniza-tion of neutrals, and solar resonance fluorescence excitaioniza-tion mechanisms to calculate the volume emission rates (V ER)
of excited states of ions. To account for the resonance flu-orescence excitation mechanism, the modelled ion density profiles are multiplied with corresponding g-factors. The to-tal volume emission rates of CO+2(Ae
2
Πu,3/2), N+2(B 2
Σ+u),
H2O+(Ae2A1), and CO+(A2Π) are given by
V ER(CO+∗ 2 ) = If 1[CO2] + gCO+ 2 [CO+2] (2) V ER(N+∗ 2 ) = If 2[N2] + gN+ 2 [N2+] (3) V ER(H2O+∗) = If 3[H2O] + gH2O+[H2O + ] (4)
V ER(CO+∗) = If 4[CO2] + If 5[CO] + gCO+[CO+](5) where species in the brackets are corresponding neutral and ion densities. Species in the parenthesis are the excited states of ions. If 1 to If 5 are the total ionization and excitation
frequencies of the excited states of the ions via photon and electron impact ionization of the respective neutrals. The volume emission rates are integrated along the line of sight and surface brightness profiles are determined as a function of the nucleocentric projected distance. The ion emission intensity ratios are determined from the modelled surface brightness profiles and compared with the observations.
4 RESULTS
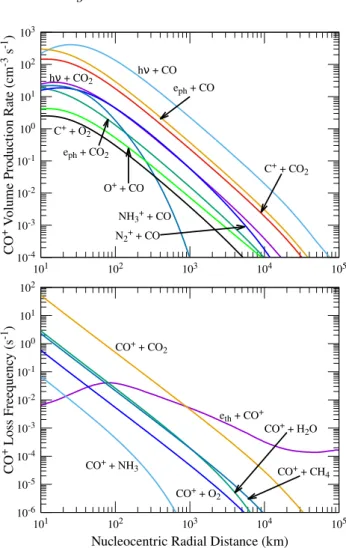
4.1 Production and loss mechanisms of CO+2
The modelled volume production rate and loss frequency profiles of CO+2 for different photochemical reactions are
pre-sented in the respective top and bottom panels of Figure1. Photoionization of CO2 and charge exchange between CO+
and CO2 are the important production sources of CO+2 in
this comet. Electron impact ionization of CO2 and charge
exchange of N+2 with CO2 contribute little to the total
for-mation of CO+
2. The modelled loss processes presented in
the lower panel of Figure 1 show that for radial distances smaller than 100 km, the collisions with H2O significantly
remove CO+2 in the coma. Above this distance, thermal
re-combination is the significant loss source for CO+2.
4.2 Production and loss mechanisms of CO+
Figure 2shows the modelled production rate and loss fre-quency profiles of CO+ for different photochemical pro-cesses. As shown in the top panel of this Figure, photoion-ization of CO is the major formation channel of CO+in the cometary coma. Close to the surface of the nucleus, electron impact ionization of CO and the collisions between C+ and
CO2 are also important production sources of CO+. The
formation rates of CO+ via dissociative ionization of CO 2
by photons and photoelectrons, and other charge exchange reactions are smaller by more than an order of magnitude compared to that of photoionization of CO. The calculated loss frequency profiles in the bottom panel of Figure2show that the collisions with CO2is major loss source of CO+for
radial distances smaller than 103 km. Above this distance, thermal recombination is the significant loss source of CO+.
Other charge exchange reactions play a minor role in the removal of CO+. 10-4 10-3 10-2 10-1 100 101 102 103 101 102 103 104 105 hν + CO2 CO+ + CO 2 eph + CO2 N2+ + CO2 C O2 + V olume Pr oduc tion Ra te (cm -3 s -1)
Nucleocentric Radial Distance (km)
10-5 10-4 10-3 10-2 10-1 100 101 101 102 103 104 105 CO2+ + eth CO2+ + H2O CO2+ + CH4 CO2+ + NH3 CO2+ + O2 C O2 + L os s F reeq uenc y (s -1)
Nucleocentric Radial Distance (km)
Figure 1. Modelled production rate (top panel) and loss fre-quency profiles (bottom panel) of CO+2 in the coma of comet C/2016 R2. Calculations are done at 2.8 au heliocentric distance using a CO production rate of 1.1 × 1029s−1. The relative abun-dances of other species viz., H2O, CO2, N2, CH3OH, CH4, O2, and NH3are taken as 0.3%, 18%, 7%, 1.1%, 0.6%, 1%, and 0.01%, respectively, with respect to CO production rate. hν, eph, and eth represent solar photon, photoelectron, and thermal electron, re-spectively.
4.3 Production and loss mechanisms of H2O+
Generally in comets, which are H2O dominated, the main
production source of H2O+ is photoionization and electron
impact ionization of H2O. Our model calculations in the top
panel of Figure3show that in comet C/2016 R2, charge ex-change between CO+2 and H2O is the major production of
source of H2O+ in the inner coma. Close to the surface of
the nucleus, charge exchange between CH3OH+and H2O is
also another important formation source of H2O+. It can be
noticed in this figure that for radial distances smaller than 1000 km, the formation rate of H2O+ via photoionization
of H2O is smaller by more than two orders of magnitude
compared to the production rate of H2O+due to charge
ex-change between CO+2 and H2O. At larger radial distances
(about 104km), charge exchange between O+ and H 2O
sig-nificantly produces H2O+and several other sources are also
involved in the production of this ion. As shown in the bot-tom panel of Figure 3, the collisions between H2O+ and
10-4 10-3 10-2 10-1 100 101 102 103 101 102 103 104 105 hν + CO2 hν + CO eph + CO NH3+ + CO eph + CO2 N2+ + CO C+ + CO 2 C+ + O2 O+ + CO C O + V olume Pr oduc tion Ra te (cm -3 s -1)
Nucleocentric Radial Distance (km)
10-6 10-5 10-4 10-3 10-2 10-1 100 101 102 101 102 103 104 105 eth + CO+ CO+ + NH3 CO+ + O2 CO+ + CO2 CO+ + H2O CO+ + CH4 C O + L os s F reeq uenc y (s -1)
Nucleocentric Radial Distance (km)
Figure 2. Modelled production rate (top panel) and loss fre-quency (bottom panel) profiles of CO+ in the coma of comet C/2016 R2. Input conditions are the same as explained in Fig-ure1. hν, eph, and ethrepresent solar photon, photoelectron, and thermal electron, respectively.
loss source of H2O+for radial distances below 3000 km and
other collisional loss frequencies are smaller by more than an order of magnitude compared to the former. Above this radial distance thermal recombination is a significant loss source of H2O+.
4.4 Production and loss mechanisms of N+2
The modelled production rate profiles in the top panel of Figure4show that N+2 is produced in the coma of C/2016
R2 via photon and electron impact ionization of N2.
Mod-elled loss profiles in the bottom panel of this Figure show that several collisional mechanisms are involved in the re-moval of N+
2 in the inner coma. The charge exchange of N + 2
with CO and CO2are the significant loss mechanisms for
ra-dial distances below 3000 km and above this rara-dial distance thermal recombination is the major loss source for this ion.
4.5 Production and loss mechanisms of CH3OH+
The modelled production rate and loss frequency profiles, which are presented in the respective top and bottom pan-els of Figure5, show that photoionization of CH3OH is the
10-6 10-5 10-4 10-3 10-2 10-1 100 101 102 103 101 102 103 104 105 hν + H2O eph + H2O CH3OH+ + H2O CO2+ + H2O CO+ + H2O N2+ + H2O O+ + H 2O H2 O + V olume Pr oduc tion Ra te (cm -3 s -1)
Nucleocentric Radial Distance (km)
10-5 10-4 10-3 10-2 10-1 100 101 102 101 102 103 104 105 eth + H2O+ H2O+ + CH 4 H2O+ + NH3 H2O+ + O2 H2O+ + H2O H2O+ + CO H2 O + L os s F reeq uenc y (s -1)
Nucleocentric Radial Distance (km)
Figure 3. Modelled production rate (top panel) and loss fre-quency (bottom panel) profiles of H2O+via various mechanisms in the coma of comet C/2016 R2. Input conditions are the same as explained in Figure1. hν, eph, and ethrepresent solar photon, photoelectron, and thermal electron, respectively.
most important formation source of CH3OH+for radial
dis-tances above 300 km. But below this radial distance, the charge exchange between O+2 and CH3OH is an important
source mechanism. As shown in the bottom panel, proton transfer between CH3OH+ and H2O removes this ion for
radial distances smaller than 50 km, above which thermal recombination takes over as the major loss source.
4.6 Production and loss mechanisms of NH+3
Modelled production and loss rate profiles of NH+3 for
dif-ferent mechanisms are presented in top and bottom panels of Figure6, respectively. Collisions of NH3with CO+2, CO
+
, and O+2 are the dominant production sources of NH+3 for ra-dial distances below 103km. The formation rate of NH+3 due
to photoionization of NH3 is smaller by more than a factor
of 5 compared to that from the charge exchange between CO+2 and NH3. For radial distances below 104km, collisions
with CO is the most significant loss process of NH+ 3 and at
larger radial distances thermal recombination removes this ion in the inner coma of comet C/2016 R2.
10-4 10-3 10-2 10-1 100 101 102 101 102 103 104 105 hν + N2 eph + N2 N2 + V olume Pr oduc tion Ra te (cm -3 s -1)
Nucleocentric Radial Distance (km)
10-7 10-6 10-5 10-4 10-3 10-2 10-1 100 101 102 101 102 103 104 105 eth + N2+ N2+ + NH3 N2+ + CO2 N2+ + CO N2+ + H2O N2+ + O2 N2+ + CH4 N2+ + N2 N2 + L os s F reeq uenc y (s -1)
Nucleocentric Radial Distance (km)
Figure 4. Modelled production rate (top panel) and loss fre-quency (bottom panel) profile of N+2 in the coma of comet C/2016 R2. Input conditions are same as explained in Figure1. hν, eph, and ethrepresents solar photon, photoelectron, and thermal elec-tron, respectively.
4.7 Production and loss mechanisms of CH+4
The top panel of Figure 7shows that charge exchange be-tween CO+2 and CH4is the major production source of CH+4
for radial distances below 1000 km and above this distance photoionization of CH4 and charge exchange between CO+
and CH4are the most significant sources of this ion. Several
collisional mechanisms are incorporated to determine the to-tal chemical loss frequency of CH+4. The modelled loss
fre-quency profiles of CH+4 in the bottom panel of Figure7show that collisional reaction between CH+4 and CO is the
domi-nant loss mechanism for the radial distances below 104 km
and above this distance thermal recombination is the major loss process for CH+4. Several other collisional processes play negligible role in the removal of CH+
4 in the inner coma.
4.8 Production and loss mechanisms of O+2
The modelled formation and loss profiles of O+
2 are
pre-sented in Figure8. The calculated production rates profiles in the top panel of this Figure show that collisional reaction between O+ and CO2 is the significant production source
of O+2 in the inner coma rather than photoionization of O2.
10-6 10-5 10-4 10-3 10-2 10-1 100 101 102 101 102 103 104 105 hν + CH3OH eph + CH3OH O2+ + CH3OH CH4+ + CH3OH O+ + CH 3OH CH 3 OH + V olume Pr oduc tion Ra te (cm -3 s -1)
Nucleocentric Radial Distance (km)
10-4 10-3 10-2 10-1 100 101 102 103 104 105 CH3OH+ + eth CH3OH+ + H2O CH 3 OH + L os s F req uenc y (s -1)
Nucleocentric Radial Distance (km)
Figure 5. Modelled production rate (top panel) and loss fre-quency profiles (bottom panel) of CH3OH+in the coma of comet C/2016 R2. Input conditions are same as explained in Figure1. hν, eph, and ethrepresent solar photon, photoelectron, and ther-mal electron, respectively.
Loss frequency profiles presented in the bottom panel of Fig-ure8show that collisions with CH3OH significantly remove
O+2 for radial distances below 100 km and at larger radial distances thermal recombination takes over as the dominant loss mechanism.
4.9 Production and loss mechanisms of protonated ions H3O+, CH3OH+2, and NH
+ 4
As shown in the top panel of Figure9, proton transfer reac-tions of H2O+ with H2O and CH4 ions produce H3O+with
equal production rates in the inner coma. At radial distances larger than 104 km proton transfer between H2O and CH+4
is also an important source of H3O+. The modelled loss
fre-quency profiles of H3O+ in the bottom panel of Figure 9
show that the proton transfer reaction between H3O+ and
CH3OH is the most significant loss source of H3O+ for
ra-dial distances smaller than 300 km and above this rara-dial distance thermal recombination takes over as the main loss source of this ion.
As shown in the top panel of Figure10, the formation of CH3OH+2 is mainly due to proton transfer reaction of
Fig-10-7 10-6 10-5 10-4 10-3 10-2 10-1 100 101 101 102 103 104 CO+ + NH3 CO2+ + NH3 hν + NH3 H2O+ + NH3 eph + NH3 NH 3 + V olume Pr oduc tion Ra te (cm -3 s -1)
Nucleocentric Radial Distance (km)
O2+ + NH3 10-5 10-4 10-3 10-2 10-1 100 101 102 103 101 102 103 104 105 eth + NH3+ NH3+ + CO NH3+ + H2O NH3+ + NH3 NH 3 + L os s F req uenc y (s -1)
Nucleocentric Radial Distance (km)
Figure 6. Modelled production rate (top panel) and loss fre-quency (bottom panel) profiles of NH+3 in the coma of comet R2. Input conditions are same as explained in Figure1. hν, eph, and ethrepresent solar photon, photoelectron, and thermal electron, respectively.
ure). Close to the surface of nucleus, the loss of this ion is sig-nificantly controlled by charge exchange between CH3OH+2
and NH3 which leads to NH+4 formation. Thermal
recom-bination is the dominant loss source of this ion compared to collisional removal processes in the inner coma of comet C/2016 R2.
Similarly, as shown in the bottom panel of Figure10, several proton transfer reactions are involved in the produc-tion of NH+4. As explained earlier, proton transfer between CH3OH+2 and NH3leads to the significant formation of NH+4
for radial distances below 100 km. Above this radial distance the proton transfer reactions of H3O+, H2O+, and CH+4 with
NH3 are the important formation sources of NH+4. Thermal
recombination is the most significant loss source of this ion throughout the cometary coma.
4.10 Production and loss mechanisms of atomic ions C+ and O+
The modelled formation and loss processes of C+in the inner coma of comet C/2016 R2 are presented in top and bottom panels of Figure11, respectively. Calculations in this Figure show that the major formation of C+ occurs due to the
10-6 10-5 10-4 10-3 10-2 10-1 100 101 102 101 102 103 104 105 hν + CH4 CO+ + CH 4 CO2 + + CH 4 eph + CH4 CH 4 + Pr oduc tion Ra te (cm -3 s -1)
Nucleocentric Radial Distance (km)
10-7 10-6 10-5 10-4 10-3 10-2 10-1 100 101 102 103 101 102 103 104 105 eth + CH4+ CH4+ + NH3 CH4+ + H2O CH4+ + O2 CH4+ + CO CH4+ + CO2 CH4+ + CH3OH CH4+ + CH4 CH 4 + L os s F req uenc y (s -1)
Nucleocentric Radial Distance (km)
Figure 7. The production rates (top panel) and loss frequency profiles (bottom panel) of CH+4 in the coma of comet R2. In-put conditions are same as explained in Figure1. hν, eph, and ethrepresent solar photon, photoelectron, and thermal electron, respectively.
photoionization of CO. Other production processes such as electron impact of CO and ionization of CO2 by photons
and photoelectrons together contribute to about 50% of the total C+ production. The calculated loss frequency profiles in the bottom panel of Figure11show that the collision with CO2 is the significant loss source of this ion throughout the
inner coma.
Similarly, the modelled formation rate and loss fre-quency profiles of O+are presented in top and bottom panels of Figure12, respectively. The production of O+ is majorly
due to photoionization of CO followed by photodissociative ionization of CO2. The contribution from other sources to
the O+ production rate is negligible. As shown in the bot-tom panel of this figure, the loss of this ion is mainly due to collisions with CO2 which leads to the formation of O+2.
Thermal recombination plays no significant role in the re-moval of this ion due to slow reaction rate.
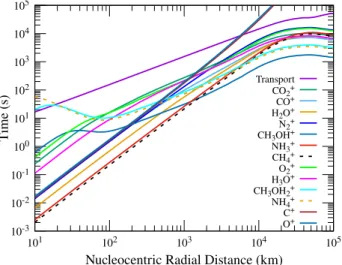
4.11 Time scales for ions
The calculated time scale profiles for the chemical loss of ions, which is due to collisions between species and thermal recombination, and transport due to advection are plotted
10-5 10-4 10-3 10-2 10-1 100 101 102 101 102 103 104 105 H2O+ + O2 eph + O2 CO+ + O2 O2 + V olume Pr oduc tion Ra te (cm -3 s -1)
Nucleocentric Radial Distance (km)
hν + O2 O+ + O2 O+ + CO2 CO2+ + O 2 CH4+ + O2 N2+ + O2 10-6 10-5 10-4 10-3 10-2 10-1 100 101 102 103 104 105 eth + O2+ O2+ + CH3OH O2+ + CH4 O2+ + NH3 O2 + L os s F req uenc y (s -1)
Nucleocentric Radial Distance (km)
Figure 8. Modelled production rate (top panel) and loss fre-quency (bottom panel) profiles of O+2 via different mechanisms in the coma of comet C/2016 R2. Input conditions are same as explained in Figure1. hν, eph, and ethrepresents solar photon, photoelectron, and thermal electron, respectively.
in Figure13. Since the chemical lifetimes of most of the ions are smaller than lifetime due to transport, they are under photochemical equilibrium condition. For radial distances below 50 km, CH3OH+2 and NH
+
4 have chemical lifetimes
longer than the transport time scales due to significantly lower collisional reaction rates with other species (see Fig-ure10). The radial transport of C+and O+is important for radial distances above 5000 km.
4.12 Ion density distribution
By incorporating the previously discussed formation and de-struction mechanisms the ion density profiles in the inner coma of comet C/2016 R2 are computed and presented in Figure 14. These calculations show that CO+2 is the
dom-inant ion for radial distances smaller than 3000 km. But close to the nucleus, CH3OH+, CH3OH+2, and O
+
2 are also
important ions. The peak density occurs at a radial distance around 100 km with CO+
2 as dominant ion. Above a radial
distance of 3000 km CO+ is the dominant ion in the inner coma. 10-7 10-6 10-5 10-4 10-3 10-2 10-1 100 101 101 102 103 104 105 H2O+ + CH4 H2O+ + H2O CH4+ + H2O H3 O + V olume Pr oduc tion Ra te (cm -3 s -1)
Nucleocentric Radial Distance (km)
10-5 10-4 10-3 10-2 10-1 100 101 101 102 103 104 105 eth + H3O+ H3O+ + CH3OH H3O+ + NH3 H3 O + L os s F reeq uenc y (s -1)
Nucleocentric Radial Distance (km)
Figure 9. Modelled production rate (top panel) and loss fre-quency (bottom panel) profiles of H3O+ in the coma of comet C/2016 R2. Input conditions are the same as explained in Fig-ure1. hν, eph, and ethrepresent solar photon, photoelectron, and thermal electron, respectively.
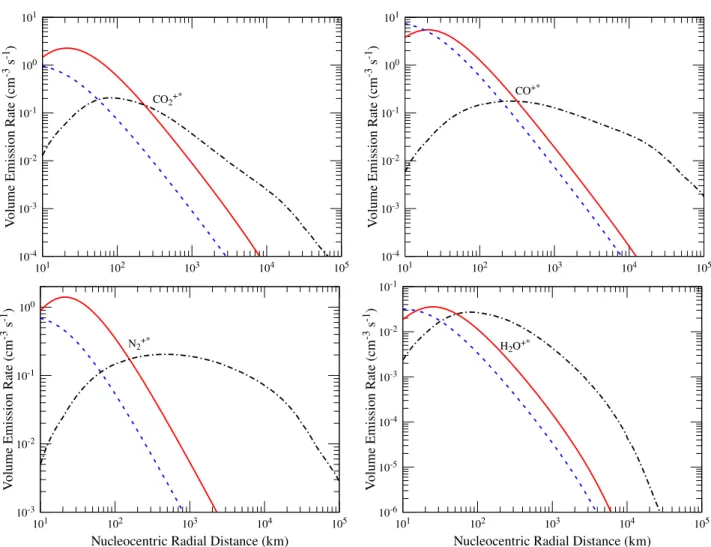
4.13 Volume emission rates and emission intensity ratios
Figure 15 shows the calculated volume emission rate pro-files for different excited states of CO+2, CO+, H
2O+, and
N+2. Photoionization and photoelectron impact ionization
of corresponding neutrals are the important sources for the formation excited states of these ions for radial distances smaller than 300 km. Above these radial distances solar res-onance fluorescence is the dominant excitation source. Close to the surface of the nucleus the electron impact ionization excitation is also a significant source for the excited states of ions.
We present the measured and modelled emission inten-sity ratios of N+2/CO
+
and CO+2/CO +
in comet C/2016 R2 as a function of the nucleocentric projected distance in Figure 16. In this Figure, the H2O+/CO+ upper limit is
also indicated. The solid curves in this figure are the mod-elled emission intensity ratios by accounting for ionization of neutrals by solar photons and photoelectrons, and also resonance fluorescence excitation, which we call a standard case. The computed intensity ratios (solid curves) are consis-tent with the observations within a factor 2 for CO+2/CO+
10-5 10-4 10-3 10-2 10-1 100 101 101 102 103 10410 -3 10-2 10-1 H3O+ + CH3OH CH4+ + CH3OH NH3 + CH3OH2+ CH3OH2+ + eth CH 3 OH 2 + Pr oduc tion Ra te (cm -3 s -1) CH 3 OH 2 + L os s F req uenc y (s -1 )
Nucleocentric Radial distance (km)
10-5 10-4 10-3 10-2 10-1 100 101 101 102 103 10410 -3 10-2 10-1 CH3OH2+ + NH3 H2O+ + NH3 NH3+ + NH3 CH4+ + NH3 NH3+ + H2O H3O+ + NH3 eth + NH4+ NH 4 + Pr oduc tion Ra te (cm -3 s -1) NH 4 + L os s F req uenc y (s -1 )
Nucleocentric Radial distance (km)
Figure 10. Calculated production rate and loss frequency profiles of CH3OH+2 (top panel) and NH
+
4 (bottom panel). Loss frequency profiles are plotted with dashed curves with scale on right y-axis. Input conditions are the same as explained in Figure1. eth represents the thermal electron.
and 50% for N+ 2/CO
+. Our calculated H
2O+/CO+
emis-sion intensity ratio profile is smaller by more than one order of magnitude compared to the derived upper limit of the observation.
We have also done several case studies to explore the impact of different excitation processes on the modelled ion emission intensity ratios. The implications of these calcula-tions are discussed in the later section. When we consider only photon and electron impact ionization and excitation of neutrals, the modelled N+2/CO
+
emission intensity ratio is significantly decreased by a factor of 5 or more compared to the standard case (see red dashed line in Figure16). In this case, the modelled CO+2/CO
+
emission intensity ratio pro-file is higher by a factor of about 2 for radial distances below 300 km, whereas, it is higher by an order of magnitude at large radial distances compared to standard case (see black dashed curve in Figure16). By neglecting the resonance flu-orescence excitation mechanism, the modelled H2O+/CO+
emission intensity ratio profile is nearly consistent with the standard case (see blue dashed curve in Figure16). We also calculated ion emission intensity ratio profiles by account-ing for resonance fluorescence as the only excitation mech-anism. As shown in Figure 16, the modelled H2O+/CO+
10-5 10-4 10-3 10-2 10-1 100 101 102 101 102 103 104 105 hν + CO eph + CO hν + CO2 eph + CO2 C + V olume Pr oduc tion Ra te (cm -3 s -1)
Nucleocentric Radial Distance (km)
10-8 10-7 10-6 10-5 10-4 10-3 10-2 10-1 100 101 102 101 102 103 104 105 eth + C+ C+ + O2 C+ + CH4 C+ + CO 2 C + L os s F req uenc y (s -1)
Nucleocentric Radial Distance (km)
C+ + H 2O
Figure 11. Modelled production rate (top panel) and loss fre-quency profiles (bottom panel) of C+in comet C/2016 R2. Input conditions are the same as explained in Figure1. hν, eph, and ethrepresent solar photon, photoelectron, and thermal electron, respectively.
(see blue dotted curve), CO+ 2/CO
+(see black dotted curve),
N+2/CO+(see red dotted curve) emission intensity ratios are in agreement with our standard case values.
5 DISCUSSION
5.1 Ion-neutral chemistry in CO-dominated coma
In a water-dominated cometary coma, photoionization of H2O produces H2O+ and the collisions between the former
and later species lead to the formation of H3O+. Even with a
small mixing ratio (about 1%), the molecules having higher proton affinity can quickly react with H3O+ and produce
NH+4 and CH3OH+2 as the dominant ions in the inner coma
(Haider & Bhardwaj 2005;Vigren & Galand 2013;Heritier
et al. 2017). But our modelled density profiles in Figure14
show that the ion composition in the inner coma of comet C/2016 R2 is completely different when compared to a reg-ular water-dominated comet. This unusual ionospheric com-position is mainly due to the peculiar neutral comcom-position of cometary coma. Unlike other comets, comet C/2016 R2 coma is dominantly composed of CO and remarkably de-pleted in water. In this peculiar coma composition, the mod-elled ion density profiles show that CO+2 is the dominant ion
10-5 10-4 10-3 10-2 10-1 100 101 102 103 101 102 103 104 105 hν + H2O eph + H2O hν + CO hν + CO2 eph + CO2 eph + CO hν + O2 eph + O2 C+ + O2 O + V olume Pr oduc tion Ra te (cm -3 s -1)
Nucleocentric Radial Distance (km)
10-8 10-7 10-6 10-5 10-4 10-3 10-2 10-1 100 101 102 101 102 103 104 105 eth + O+ O+ + CO O+ + CO2 O+ + H2O O+ + CH3OH O+ + NH3 O+ + O2 O+ + CH 4 O + L os s F req uenc y (s -1)
Nucleocentric Radial Distance (km)
O+ + N2
Figure 12. Calculated production rate (top panel) and loss fre-quency profiles (bottom panel) of O+in comet C/2016 R2. Input conditions are the same as explained in Figure1. hν, eph, and ethrepresent solar photon, photoelectron, and thermal electron, respectively. 10-3 10-2 10-1 100 101 102 103 104 105 101 102 103 104 105 T ime (s)
Nucleocentric Radial Distance (km) Transport CO2+ CO+ H2O+ N2+ CH3OH+ NH3+ CH4+ O2+ H3O+ CH3OH2+ NH4+ C+ O+
Figure 13. Calculated lifetime profiles of different ions due to transport and chemical reactions in C/2016 R2. Input conditions are the same as explained in Figure1.
10-2 10-1 100 101 102 103 101 102 103 104 105 H2O+ CO2+ CO+ O2+ N2+ CH3OH+ CH4+ NH4+ NH3+ CH3OH2+ C+ O+ Ion densit y (cm -3)
Nucleocentric Radial Distance (km)
H3O+
Figure 14. The modelled density profiles for different ions in the coma of comet C/2016 R2. Input conditions are the same as explained in Figure1.
for radial distances below 3000 km, with a peak ion density at around 100 km, whereas the CO+ density is significant
for radial distances above 5000 km (see Figure14).
The CO+2 and CO+ ion distribution can be explained
based on their corresponding formation and destruction pro-cesses in the inner coma. The loss of CO+ mainly depends
on the collisions with CO2, which is the major formation
channel for CO+2 for radial distances smaller than 103 km (see Figures2). But the loss of CO+
2 significantly depends
on the thermal recombination except for the radial distances smaller than 100 km. Our model calculation show that the destruction rate of CO+ is more than an order of magni-tude higher compared to that of CO+2 for radial distances smaller than 1000 km (see the lower panels of Figures 1 and 2). These calculations suggest that the collisions be-tween CO+ and CO2 strongly control both the CO+ and
CO+2 densities for radial distances smaller than 1000 km, whereas above this distance thermal recombination rates of these ions, which are nearly the same, determine the mod-elled ion densities. Our model calculations also show that the chemical loss of CO+, via CO2collisions, produces CO+2
about an order of magnitude more efficiently than photoion-ization of CO2. Thus, the significant collisional loss of CO+
substantially reduces its density in the coma and also leads to CO+
2 as the dominant ion. Above 1000 km radial distance,
CO+ is the dominant ion due to its higher formation rate compared to that of CO+
2. Due to its endothermic nature,
the charge transfer reaction between CO+2 and CO does not
occur hence, CO+2 can not be removed by the collisions with CO in the cometary coma.
The modelled ion density profiles suggest that close to the nucleus surface, besides CO+2, CH3OH+, CH3OH+2 and
O+2 are also important ions with significant densities. The larger abundance of CO2in the coma and the collision
reac-tion of O+with former species significantly produce O+2 be-low 100 km. Though we assumed a relatively large amount of O2 compared to several other detected species in this comet
(1% of CO production rate), the calculations in top panel of Figure8show that photoionization of O2 plays no role in
10-4 10-3 10-2 10-1 100 101 101 102 103 104 105 CO2+* V olume Emis sion R ate (cm -3 s -1) 10-4 10-3 10-2 10-1 100 101 101 102 103 104 105 CO+* V olume Emis sion R ate (cm -3 s -1) 10-3 10-2 10-1 100 101 102 103 104 105 N2+* V olume Emis sion R ate (cm -3 s -1)
Nucleocentric Radial Distance (km)
10-6 10-5 10-4 10-3 10-2 10-1 101 102 103 104 105 H2O+* V olume Emis sion R ate (cm -3 s -1)
Nucleocentric Radial Distance (km)
Figure 15. Modelled volume emission rates for CO+2 (0-0) (top left), CO+(2-0) (top right), N+
2(0-0) (bottom left), and H2O+ (8-0) (bottom right) transitions. Solid red, dashed blue, and dash-dotted black curves represent the modelled volume emission rate profiles due to photoionization, electron impact ionization, and solar resonance fluorescence of corresponding neutrals and ions, respectively. Input conditions are the same as explained in Figure1.
km, the formation rates of O+2 via charge exchange between
CO+2 and O2, and photoionization of O2 are smaller by a
factor 3 and 10 compared to formation rate via charge ex-change between O+and CO2, respectively (see Figure8). By
varying the O2 relative abundance between 1 and 3% with
respect to the CO production rate no significant change in the modelled O+
2 ion density is observed. These calculations
show that the formation of O+2 is possible due to the
col-lisional chemistry even in the absence of O2 in the C/2016
R2 inner coma. Hence, our assumed O2 relative abundance
has no impact on the modelled O+2 ion density.
For radial distances below 100 km, the contribution due to charge exchange between O+2 and CH3OH leads to a
sig-nificant amount of CH3OH+ formation when compared to
that due to the photoionization of CH3OH (see Figure 5).
The strong proton affinity between CH3OH+and H2O leads
to CH3OH+2 as an important ion close to the surface of
the nucleus (see Figure 10). All these calculations suggest that for radial distances below 100 km, the CO+2, CH3OH+,
CH3OH+2, and O +
2 ion densities are significantly determined
by collisional chemistry among the neutral species and ions rather than photon and electron impact driven processes.
The ion density profiles of N+2, C+, and O+ are almost
constant for radial distances between 100 and 104km. This can be explained on the basis of their corresponding pro-duction and loss mechanisms. The ground state energy of N+2 is 15.57 eV, which is the largest among the considered ions. Hence, this ion can interact with most of the neutral species via charge exchange mechanism. Our modelled loss frequency profiles show that N+
2 ion interacts strongly with
CO and CO2 for the radial distances up to 3 × 10³ km.
Though CO2 is less abundant than CO in the coma, the
modelled charge exchange rate of N+2 with CO2 is
compa-rable to that with CO (see the lower panel of Figure 4). This is because the rate coefficient for the charge exchange between N+2 and CO2 is higher by about an order of
magni-tude compared to that of N+
2 and CO (see the reaction rates
of R50 and R55 in TableA1). Hence, the strong collisional interaction of N+2 with major species in the coma makes the density profile of this ion almost constant for radial dis-tances between 100 and 104 km. Similarly, the constant C+ and O+ion density profiles are also due to strong collisional interaction of these ions with CO2 for radial distances up to
104km (see the lower panel of Figures11and12).
As explained earlier, in a water dominated comet, the protonated ions such as H3O+, NH+4, and CH3OH+2 are
sig-10-3 10-2 10-1 100 101 102 103 104 Emis sion Intensit y Ra tio
Nucleocentric Projected Distance (km)
Figure 16. Modelled emission intensity ratios of N+2/CO+(red), CO+2/CO+(black), and H
2O+/CO+(blue) as a function of pro-jected distance. Solid curves are the modelled ratio profiles by accounting for ionization and excitation neutral species by pho-tons and photoelectrons, and solar resonance fluorescence excita-tion mechanisms. Dashed and dotted curves represents the mod-elled emission intensity ratios profiles by accounting for only ion-ization of neutrals and only solar resonance fluorescence mech-anisms, respectively. The observed flux ratios are plotted with corresponding colours with vertical error bars. The blue horizon-tal line with a downward arrow represents the derived upper limit of H2O+/CO+emission intensity ratio. Input conditions are the same as explained in Figure1.
nificantly controlled by H2O. Photoionization of H2O is the
primary reaction that produces H2O+ and further
interac-tion of this ion with neutral species drives the collisional chemistry of protonated ions in the water-dominated coma. But in the case of comet C/2016 R2, which is a water-poor comet, the H2O+ion density for radial distances below 1000
km is controlled by CO and CO2densities, rather than
pho-toionization of H2O. As shown by our calculations, for radial
distances smaller than 1000km, the major formation H2O+
is due to the charge exchange between CO+2 and H2O rather
than photoionization of H2O. Similarly, CO also plays an
important role in removing the H2O+ for radial distances
smaller than 5000 km in the inner coma (see Figure 3). This H2O+ion chemistry, which is primarily driven by CO2
and CO, further initiates the formation of H3O+ via proton
transfer reactions of H2O+ with H2O and CH4. Due to high
proton affinity, the collisions between CH3OH and H3O+
results in CH3OH+2 which further interact with NH3 that
leads to the formation of NH+3 for radial distances below 100 km (see Figures9 and 10). Hence, unlike H2O driven
ion-neutral chemistry in normal comets, in comet C/2016 R2, CO and CO2play an important role in the formation of
protonated ions.
The role of CO2 is crucial in determining the
ion-chemistry in this comet. Neutral density of CO2 controls
the total loss frequencies and subsequently the ion densities of CO+, N+2, C+, and O+ for radial distances below 1000 km, whereas the neutral density of CO significantly controls the loss rates of H2O+, NH+3, and CH
+
4 ions. Hence, any
change in the abundances of CO2 and CO can significantly
alter the total ion composition in the inner coma of this comet.
5.2 Derivation of neutrals densities from the observed ion emission intensities
Assuming solar resonance fluorescence is the only excitation mechanism, the observed flux ratios of ionic emissions are converted into ion density ratios and assumed to be equal to their respective neutral density ratios in the C/2016 R2 coma (Cochran & McKay 2018;Wierzchos & Womack 2018;
Biver et al. 2018; McKay et al. 2019). But none of these
works account for the ionization and excitation of neutrals by photons and photoelectrons which can also produce the observed emissions. Here we discuss the derivation of neutral density ratio based on observed corresponding ion emission intensity ratio using our modelled emission processes in the inner coma.
5.2.1 Role of ionization and excitation processes in determining the ion emission intensity ratios
The ionization and excitation of neutrals by solar photons and photoelectrons can spontaneously produce the observed emissions of ions. If these are the only emission mechanisms in the cometary coma, then the observed intensity ratios can be directly used to constrain the corresponding neutral density ratio. If the solar resonance fluorescence is the only excitation mechanism, then the distribution of ion densities in the coma and the excitation factors (g-factors) determine the observed emission intensity ratio. Since the observed ion emissions are determined by both ionization and excitation of neutrals and resonance fluorescence of ions, it is essen-tial to understand the photochemistry of cometary coma, which determines the ion density distribution, in order to derive the mixing ratios of neutral densities based on the observed ion emission intensity ratio. Our calculations in Figure 15show that for radial distances smaller than 300 km, the modelled volume emission rates of CO+, CO+2, N
+ 2,
and H2O+ due to ionization and excitation of
correspond-ing neutrals by photons and photoelectrons are higher by several orders of magnitude compared to those due to solar resonance fluorescence. This calculation suggests that ion-ization and excitation of neutrals alone can also determine the observed emission intensity ratio.
When we account for ionization and excitation of neutrals and resonance fluorescence excitation mechanism, our modelled emission intensity ratios of CO+2/CO
+
and N+2/CO+ are consistent with the measured emission ratios within a factor of 2 (see solid red and black curves in Fig-ure16). In the case of H2O+/CO+, the modelled emission
ratio is smaller by two orders of magnitude compared to the derived upper limit from the observation. Our modelled vol-ume emissions rates in Figure15show that the ionization and excitation of N2 and CO can also produce the
corre-sponding ionic emissions in the cometary coma. Hence, to assess the role of ionization and excitation of neutrals on the modelled ion emission ratios, we neglected the resonance fluorescence excitation. In this case, the modelled N+
2/CO +
emission intensity ratio is smaller by a factor of 5 compared to the observation (see red dashed line in Figure 16). But when we account for resonance fluorescence as the only exci-tation mechanisms, the modelled N+2/CO+ emission
inten-sity ratio is consistent with the observation (see red dotted curve in Figure16). This is mainly because the contribution from ionization and excitation of CO and N2to the total
vol-ume emission rate reduces rapidly for radial distances above 300 km whereas, the resonance fluorescence takes over the major excitation source (see Figure15). Hence, the observed emission ratio is significantly controlled by resonance fluo-rescence rather than the remaining excitation processes.
By accounting for ionization and excitation of neutral and also resonance fluorescence mechanisms, we find the calculated CO+2/CO+ emission intensity ratio decreases for projected distances above 300 km. This can be explained based on the modelled volume emission rates of these ions. As shown in Figure15, at larger radial distances (>103km),
the volume emission rate of CO+2 is smaller by more than
an order of magnitude compared to that of CO+, which is
mainly due to the radial density distribution of these ions. Hence, the higher CO+ion density at larger radial distances
reduces the modelled CO+2/CO +
emission intensity ratio, as can be noticed in the observation. When we only account for ionization excitation processes of neutrals, the modelled ion emission intensity ratio of CO+2/CO+ is closer to the ob-served profile for the radial distances below 2000 km (see black dashed curve in Figure16). However, the decrease in the observed CO+2/CO+ emission intensity ratio for
pro-jected distances larger than 2000 km can not be explained by only ionization and excitation processes. All these calcu-lations suggest that resonance fluorescence excitation plays a more significant role in determining the observed CO+2/CO+ emission intensity ratio than ionization and excitation of neutrals at large radial distances.
Due to lack of measured branching ratios, we assumed 50% of electron impact ionization of H2O producing H2O+
in the Ae2A1 excited state. By increasing our assumed
branching ratio to 100%, no significant change in the mod-elled H2O+/CO+emission intensity ratio is found. This
cal-culation suggests that solar photons significantly determine the ion emission intensity ratio rather than electron impact ionization and excitation of H2O. The calculation in
Fig-ure 16 show that the modelled H2O+/CO+ emission
in-tensity ratio does not vary significantly by accounting for only resonance fluorescence and/or ionization excitation of neutrals. This suggests that the ionization and excitation of neutrals play an equal role in determining the modelled H2O+/CO+emission intensity ratio compared to the role of
solar resonance fluorescence excitation mechanism.
5.2.2 Derivation of neutral density based on the N+ 2/CO
+
emission intensity ratio
Cochran & McKay(2018) converted the observed emission
flux ratio of N+2/CO +
to N2/CO neutral density ratio based
on the approach ofLutz et al.(1993) andWyckoff & Heyd (2003). It should be noticed that Lutz et al. (1993) and
Wyckoff & Heyd (2003) observed these ionic emissions on
cometary tail regions where the photoionization excitation processes are not significant compared to resonance fluores-cence. Our modelled volume emission rate profiles also show that at larger radial distances emission intensity is mainly determined by resonance fluorescence excitation mechanism. Hence, the observed N+2/CO
+
emission ion intensity ratio can be used to derive their respective neutral density ratio.
But for radial distances below 100 km, the photon and elec-tron impact ionization and excitation of neutral species sig-nificantly controls the observed N+
2/CO
+ ratio. Thus, only
the observed emission intensity ratios of these ions at larger radial distances are suitable to derive their respective neu-tral abundance ratio.
As discussed earlier, the densities of N+2 and CO+ at
large radial distances (>103 km) are essentially governed by photoionization of corresponding neutrals and thermal recombination (see Figures2and4). The electron tempera-ture, which determines the recombination rates of these ions and consequently their density, can influence the modelled emission intensity ratios. In the model we assumed electron temperature (Te) in the coma equivalent to that of
neu-tral temperature, which is calculated byIp(1983). This as-sumption causes a discrepancy between the modelled and observed N+2/CO
+
emission ratios of about a factor 2 (See Figure16). Due to lower cooling rates, it is expected that the electron temperatures at larger radial distances can be much higher than our assumed value (Gan & Cravens 1990). In order to evaluate the role of electron temperature on the modelled ion emission intensity ratio, we used the elec-tron temperature profile for 1P/Halley fromEberhardt &
Krankowsky(1995), which is determined from Giotto
mea-surements. We noticed that at larger radial distances, the Ip(1983) calculated neutral temperature is several orders of magnitude smaller than the electron temperature derived by
Eberhardt & Krankowsky(1995). By using the temperature
profile of comet 1P/Halley in the model, we find that the modelled N+2/CO+emission intensity ratio profile decreases
by a factor 2 and is then consistent with the observation. This calculation suggests that electron temperature can also play an important role in determining the observed emission intensity ratio. Modelling the electron temperature profile in this CO-dominated cometary coma is beyond the scope of the present work.
Using the modelled photoionization and recombination rates, we derive the following analytical expression to con-vert the observed flux ratio into neutral density ratio :
[N2] [CO] = IN+ 2 ICO+ × 1.69 × 10⁻²× Te0.16 (6)
The derivation of the above expression is provided in Appendix C. By substituting our observed flux ratio (IN+
2/ICO
+) in the above equation and for an electron tem-perature of 1000 K, we obtained the neutral density ratio of [N2]/[CO] as 0.06, which is consistent with the derived
volume mixing ratio of N2 from the other observations. It
should be noted that larger electron temperature can lead to a higher abundance ratio of neutral species.
5.2.3 Derivation of neutral density based on the CO+2/CO
+
emission intensity ratio
It should be noticed that by accounting for 18% of CO2
rel-ative to the CO production rate (based on the observations
of McKay et al. 2019), the modelled CO+2/CO+ ion
den-sity ratio significantly varies for radial distances below 104
km (see Figure14). As explained earlier, both the CO+2 and CO+ ion densities are significantly controlled by ion-neutral
chemistry rather than photoionization and thermal recom-bination processes for the radial distances below 1000 km