HAL Id: hal-00782636
https://hal.archives-ouvertes.fr/hal-00782636
Submitted on 30 Jan 2013
HAL is a multi-disciplinary open access
archive for the deposit and dissemination of
sci-entific research documents, whether they are
pub-lished or not. The documents may come from
teaching and research institutions in France or
abroad, or from public or private research centers.
L’archive ouverte pluridisciplinaire HAL, est
destinée au dépôt et à la diffusion de documents
scientifiques de niveau recherche, publiés ou non,
émanant des établissements d’enseignement et de
recherche français ou étrangers, des laboratoires
publics ou privés.
Vicinity-based DTN Characterization
Tiphaine Phe-Neau, Marcelo Dias de Amorim, Vania Conan
To cite this version:
Tiphaine Phe-Neau, Marcelo Dias de Amorim, Vania Conan. Vicinity-based DTN Characterization.
The Third International Workshop on Mobile Opportunistic Networks (MobiOpp ’12), Mar 2012,
Zurich, Switzerland. pp.37-44, �10.1145/2159576.2159586�. �hal-00782636�
Vicinity-based DTN Characterization
Tiphaine Phe-Neau
∗UPMC Sorbonne Universites
[email protected]
Marcelo Dias de Amorim
⋆CNRS and UPMC Sorbonne Universites
[email protected]
Vania Conan
Thales Communications[email protected]
ABSTRACT
We relax the traditional definition of contact and intercontact times by bringing the notion of vicinity into the game. We propose to analyze disruption-tolerant networks (DTN) un-der the assumption that nodes are in κ-contact when they re-main within a few hops from each other and in κ-intercontact otherwise (where κ is the maximum number of hops char-acterizing the vicinity). We make interesting observations when analyzing several real-world and synthetic mobility traces. We detect a number of unexpected behaviors when analyzing κ-contact distributions; in particular, we observe that in some datasets the average κ-contact time decreases as we increase κ. In fact, we observe that many nodes spend a non-negligible amount of time in each other’s vicinity with-out coming into direct contact. We also show that a small κ (typically between 3 and 4) is sufficient to capture most communication opportunities.
1.
INTRODUCTION
“How much time do two nodes spend within com-munication range of one another and how long does it take for them to meet again after having left each other?” These questions are central to most works on disruption-tolerant networking (DTN) and concern the problem of evaluating the contact and intercontact times among nodes [2, 7, 12]. Such analyses have funda-mental practical impact, as they serve as a substrate for the design of forwarding strategies that better schedule transmissions based on the history of mobility. Notice-able examples are Prophet [9], Spray and Wait [15], and SSAR [8].
In this paper, we propose a different evaluation of the dynamics of disruption-tolerant networks by integrating the notion of node vicinity in the equation. Instead of considering only direct communications among nodes, we suggest extending the notion of “contact” to the zone within a few hops. The impetus for this proposal comes from the observation that a significant fraction of the pairs of nodes remains nearby (within a few hops) when not in direct contact. To this end, we use the
∗Authors carried out part of the work at LINCS (www.lincs.fr).
κ-vicinity1 as the basis of our analyses, where κ stands
for the maximum number of hops separating two nodes. We define and analyze two temporal measures that are the κ-contact and the κ-intercontact times. We analyze their aggregated distributions and keep pairwise analy-ses for further study.
The interests of relying on an extended view of con-tacts and interconcon-tacts are manifold. First, one obtains a finer characterization of the network, as we observe in real-world mobility traces that many pairs of nodes are frequently nearby without any direct contact. Second, it becomes easier to tune forwarding protocols as by introducing very little overhead (to discover the neigh-borhood) a node can discover significant proximity with other nodes. Third, by using short multihop opportu-nities, end-to-end delays can be decreased.
We analyze the time distributions for the κ-contact and the κ-intercontact times using both real-world and synthetic mobility traces and make a number of interest-ing observations. In a nutshell, we reveal the followinterest-ing findings:
• Different classes of datasets. We observe from our analyses that there are basically two differ-ent types of behaviors. When extending the con-tact notion to a node’s vicinity, one would expect κ-contacts duration to increase. However, in some datasets, increasing κ leads to a higher probability of having shorter contacts, which is a quite unex-pected result. We refer to these patterns respec-tively as dense and light distributions.
• Existing analyses hold for κ-vicinity. We confirm that the main observations found in the literature still apply in the context of our study. This means that the main principles of opportunistic commu-nications remain the same. This is a good point as existing opportunistic protocols can directly ben-efit from our findings.
• Close vicinity is enough. We observe for the datasets we analyze that it is enough to extend the
ity to a few hops (typically three or four) to cap-ture most of the local communication opportuni-ties. Such a threshold enables low costs for vicinity composition gathering. This also holds for net-works with a large diameter.
After introducing and formalizing our proposal, we develop an extended analysis of well-known real-world and synthetic mobility traces. We then discuss the sev-eral time distributions and observations we make. Al-though out of the scope of this paper, we also provide some insights into the applicability of the proposed work in the design of more efficient DTNs.
2.
BACKGROUND
2.1
Related Work
The most intuitive characterization of DTNs relies on the distribution of contact times. A contact occurs when two nodes are within each other’s wireless com-munication range and can perform transmission. We consider networks with bidirectional links. In an early work, Vahdat and Becker investigated the impact of wireless ranges on message delivery [17]. Hui et al. an-alyzed contacts to derive affinities between individuals and likeliness of meeting [6]. Chaintreau et al. were pi-oneers in determining the possibilities of efficient trans-mission in networks through the history of contacts [3]. Contact is not the only meaningful parameter. To make the most of opportunistic communications, understand-ing intercontact times is also important.
Intercontact distributions indicate when nodes will next be able to transmit data to other devices. In the literature, we observe two main definitions for intercon-tact. The inter-any-contact notion, meaning the time interval elapsed between two subsequent contacts inde-pendently of the identities of the neighbors. The sec-ond definition, the pairwise intercontact time, involves a specific pair of nodes. It relates to the time two nodes wait before meeting again after moving away from each other. Leguay et al. thoroughly studied pairwise intercontact distributions in well known experimental datasets. They found these distributions well fitting ei-ther log-normal laws or exponential distributions [4]. Chaintreau et al. argued that pairwise intercontact times follow power law distributions over a specific time range [2]. In a similar study, Karagiannis et al. found that pairwise intercontacts fit diptych distributions – power law followed by exponential decay [7]. Recently, Passarella and Conti examined aggregate intercontact times and found them not to be the exact mirror of pairwise intercontact times [12].
2.2
Positioning
Although our work is inline with the contributions found in the literature, we propose to characterize DTNs
using a different point of view. Previous analyses use one-to-one or one-to-all approaches for characterization. We argue in favor of an in-between approach to lever-age a group-to-all vision. In this work, we take into ac-count the immediate vicinity beyond simple contact for every node. We consider a subset of every node’s con-nected component and study the effects of our group-to-all vision on DTN characterization. Using the κ-vicinity knowledge, we extend previous analyses to observe the impact of such point of view on DTN understanding.
To study the behavior of contacts within a node’s κ-vicinity, we did not extend a node’s wireless range to influence contact possibilities as Vahdat and Becker did. For intercontact patterns, as previously pleaded by Leguay et al., we base our analysis on the pairwise intercontact definition. We rely on our earlier findings that many pairs of nodes, when not in direct contact, re-main nearby (within very few hops) [13]. The extension of contact and intercontact to a vicinity notion brings logical variation in previous intercontact and contact analyses. We perform state-of-the-art examination on our extended notions to understand how different our results are when compared to previous pairwise analy-ses [2, 7].
3.
FROM THE VIEWPOINT OF VICINITY
Our modern society is tied by the relationships people share with one another. Social network studies showed how people interact based on social ties and how this can be used in networking when they form groups at given times [1, 10]. However, existing DTN protocols still maintain a contact-only vision for their decisions; in other words, they overlook the perspective of nearby nodes. Given people’s tendency to colocate in specific places at explicit times, why should we underestimate such information?
3.1
The
κ-vicinity
We want to embody the vision a mobile node has of its neighborhood. To this end, we consider the κ-vicinity of a node instead of only the direct neighbors:
Definition 1. κ-vicinity. The κ-vicinity Vi
κof node
i is the set of all nodes within κ hops from i.
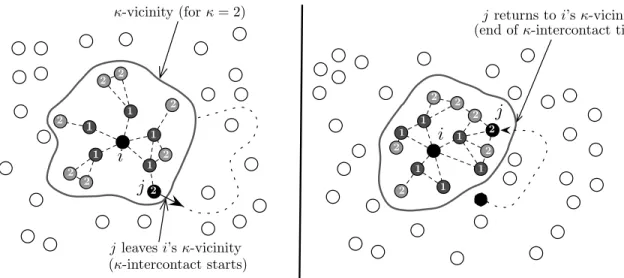
We use the term κ-vicinity to avoid any confusion with the tradition “n-hop-neighborhood” terminology. We assume that the n-hop-neighborhood indicates the nodes exactly at n-hops, while κ-vicinity gathers all the nodes up to κ hops. In Figure 1, we illustrate the 2-vicinity of node i.
The κ-vicinity brings the immediate surrounding knowl-edge. This is an interesting point of view for oppor-tunistic networks because it extends a node’s knowl-edge to immediately useable communication
opportu-i
j
j
(κ-intercontact starts) j leaves i’s κ-vicinity
κ-vicinity (for κ = 2) jreturns to i’s κ-vicinity (end of κ-intercontact time)
1 1 1 1 1 2 2 2 2 2 2 2 2 2 2 2 2 1 1 1 1 1 1 2
i
2 2Figure 1: Node i’s κ-vicinity and the κ-intercontact phenomenon. For the sake of clarity, we only display connectivity links and shortest hop distance from i within the κ-vicinity.
nities. The κ-vicinity empowers a node’s reach in the network [14].
3.2
κ-contact and
κ-intercontact
We are now ready to make the necessary definitions for the rest of our work.
Definition 2. κ-contact. Two nodes are in κ-contact when they dwell within each other’s κ-vicinity, with κ∈ N∗. More formally, two nodes i and j are in κ-contact
when{i ∈ Vj
κ} = {j ∈ Vκi}. In other words, a
contem-poraneous path of length at most κ links i and j. We also need to grasp the intercontact observations for our vicinity viewpoint. The literature definition of mere intercontact is when two nodes are not in contact. Therefore, we consider κ-intercontact when two nodes are not in κ-contact. These are complementary notions. Another way to see it is as follows: if node i maintains knowledge about its κ-vicinity, it is in κ-intercontact with any node beyond its κ-vicinity. In Figure 1, node j leaves i’s κ-vicinity and then gets back some time later, characterizing a κ-intercontact interval.
Definition 3. κ-intercontact. Two nodes are in κ-intercontact while they do not belong to each other’s κ-vicinity. Formally speaking, two nodes i and j are in κ-intercontact when{i 6∈ Vj
κ} or {j 6∈ Vκi}. There is no
path of length κ or less linking i and j.
Note that 1-contact matches the contact notion and 1-intercontact corresponds to usual binary intercontact.
4.
DATASETS
To perform our analysis, we selected real-life datasets and synthetic models displaying specific scenarios. Each
of them embeds characteristics of real-life patterns that DTN wants to leverage. Real-life measurements used devices capturing other devices presence within a 10m wireless range.
Infocom05 measurement was held during a 5 day con-ference in 2005 [2]. 41 attendees carried iMotes collect-ing information about other iMotes nearby. We study a 12-hour interval bearing the highest networking ac-tivity. Each iMote probes its environment every 120 seconds. Infocom05 represents a professional meeting framework.
Rollernet had 62 participants measuring their mutual connectivity with iMotes while they where riding a do-minical rollerblading tour during 3 hours in Paris [16]. Researchers set devices to send beacons every 30 sec-onds. These measurements show a specific sport gath-ering scenario.
Unimi is a dataset captured by students, faculty mem-bers, and staff from the University of Milano in 2008 [5]. They involved 48 persons with special devices probing their neighborhood every second. Unimi provides a scholar and working environment scenario.
RT is a mobility model correcting flaws from the Ran-dom Waypoint model [11]. We sampled the behavior of 20 nodes following this model on a surface of 50 x 60 m2with speed between 0 and 7 m/s and a 10m wireless
range for vicinity sensing.
Community is a social-based mobility model [10]. It tends to colocate socially-related nodes in specific loca-tions at the same time like groups of friends would do. We simulated 50 nodes with a 10m wireless range on a 1,500 x 2,500 m2plane during 9 hours.
5.
INTERCONTACT DISTRIBUTIONS
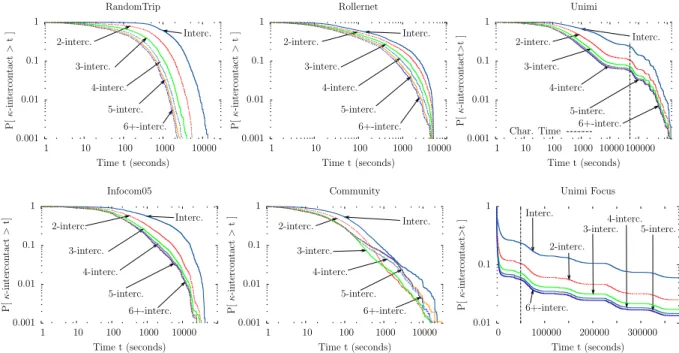
Intercontact patterns in DTN sprang many inspiring analyses as seen in Section 3. Studying intercontact duration distributions helps researchers quantify how long a node will have to wait before its next encounter. Figure 2 represents aggregated complementary cumu-lative density function (CCDF) of binary (traditional) intercontact and respective κ-intercontact durations for every pair of nodes. These CCDFs indicate the proba-bility of a κ-intercontact lasting longer than t seconds.
5.1
Binary intercontact
As Karagiannis et al. observed, we also find that all binary intercontact CCDFs follow a straight line up to a knee point when both x-axis and y-axis are on loga-rithmic scale. This implies power laws for each binary intercontact distributions until the observed knee point also known as the characteristic time. In Unimi, we observe a knee point for binary intercontact at around 50,000 seconds. After plotting distributions with a lin-ear scale on the x-axis and maintaining the log scale on the y-axis, we also observe that distributions can be approximated by a straight line beyond the knee point. In Figure 2, the phenomenon is clear for Unimi. This hints exponential decays for distribution tails. Obser-vations on binary intercontact match results of previous studies.
5.2
κ-intercontact
As of κ-intercontact distributions, we find their gen-eral overlook to be quite similar to their respective bi-nary intercontact distributions except for Community. κ-intercontacts display partial displacement after some point with a sharper slope for each curve. The larger the κparameter, the more important the bottom left shift for each distribution. The concept of κ-neighborhood logically reduces κ-intercontact times. The wider a node’s vicinity knowledge, the later this latter detects a node’s departure from its vicinity and the quicker it detects its comeback resulting in shorter κ-intercontact durations. We see that for κ ≥ 6, CCDFs aggregate.
An interesting remark is how κ-intercontact distri-butions exhibit the same properties as binary intercon-tacts. They follow power laws until a specific point (the characteristic time) and then carry exponential de-cay. In Figure 2, beyond 50,000 seconds, Unimi ’s 2-intercontact curve is a vertical shift of the binary inter-contact CCDF. The same occurs for further κ-interinter-contacts. However, an important information is that the knee point found for binary intercontact corresponds to chang-ing points for κ-intercontact distributions. In Unimi, κ-intercontact curves (κ ≥ 2) quickly decrease after the characteristic time found at 50,000 seconds.
Table 1 displays average intercontact duration and Table 2 the number of intercontacts intervals for each
dataset. Except for Community, the higher κ gets, the lower the average κ-intercontact length. This en-forces our rational expectations of κ-vicinity reducing κ-intercontact duration with higher κ. We remarked decreasing cumulated κ-intercontact times for each κ. We also observe a logarithmic growth in the number of κ-intercontact intervals.
5.3
Observations
The Community dataset stands out because of its non-monotonic average κ-intercontact duration and evo-lution of the number of intervals. When the average length grows, the number of κ-intercontact intervals de-creases. This still results in a decreasing cumulated κ-intercontact duration for each κ. It enforces our first thoughts in the benefits of κ-vicinity for κ-intercontact times.
Under the assumption that nodes in the vicinity dwell within low delay reach, κ-intercontact duration decreases with larger κ, strengthening our belief that κ-neighborhood is beneficial to DTN protocols. The fact that character-istic time in all intercontact distributions corresponds is also an important finding. It could help protocols like Prophet, Spray-and-Wait, or SSAR maintain their actual intercontact-based approach and extend them to their vicinity to benefit from shorter κ-intercontact times.
6.
CONTACT AND
κ-CONTACT ANALYSES
Contact is the main feature for opportunistic mobile networks. Analyzing its distribution gives us insights into how protocols can benefit from these contact oppor-tunities, as κ-contacts happen to be an extension of the strict contact definition. Instead of considering contact between neighbors at a 1-hop distance only, we analyzed the potential of transmission to nearby nodes within the κ-vicinity. These paths enable low delay transmissions and a better neighborhood reach for a network node.
6.1
κ-contact duration distributions
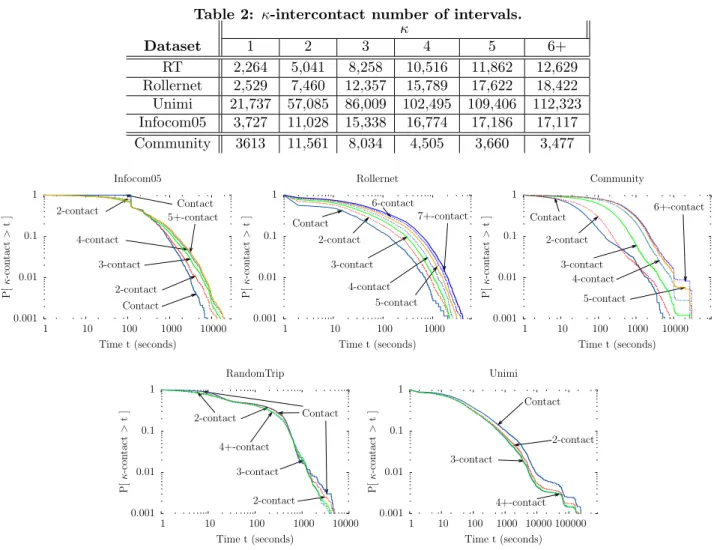
In Figure 3, we display aggregated CCDFs of contact alongside κ-contact duration for every pair of nodes in each experiment. These CCDFs indicate the probabil-ity of a κ-contact lasting longer than t seconds.
For Infocom05 and Rollernet, their CCDFs maintain comparable aspects. We observe a small upper right shift for larger values of κ. As the κ-contact notion increases the node’s vicinity scope, any nearby node may stay within the considered node’s coverage longer than with a shorter sight vision. The higher the κ, the higher the probability of having longer κ-contact intervals duration. Above scanning granularity, lower κresults in curves with a sharper slope than curves of longer κ-contacts.
Commu-0.001 0.01 0.1 1 1 10 100 1000 10000 P [ κ -i n te rc on ta ct > t ] Time t (seconds) RandomTrip Interc. 2-interc. 3-interc. 4-interc. 5-interc. 6+-interc. 0.001 0.01 0.1 1 1 10 100 1000 10000 P [ κ -i n te rc on ta ct > t ] Time t (seconds) Rollernet Interc. 2-interc. 3-interc. 4-interc. 5-interc. 6+-interc. 0.001 0.01 0.1 1 1 10 100 1000 10000 100000 P [ κ -i n te rc on ta ct > t ] Time t (seconds) Unimi Interc. 2-interc. 3-interc. 4-interc. 5-interc. 6+-interc. Char. Time 0.001 0.01 0.1 1 1 10 100 1000 10000 P [ κ -i n te rc on ta ct > t] Time t (seconds) Infocom05 Interc. 2-interc. 3-interc. 4-interc. 5-interc. 6+-interc. 0.001 0.01 0.1 1 1 10 100 1000 10000 P [ κ -i n te rc on ta ct > t ] Time t (seconds) Community Interc. 2-interc. 3-interc. 4-interc. 5-interc. 6+-interc. 0.01 0.1 1 0 100000 200000 300000 P [ κ -i n te rc on ta ct > t ] Time t (seconds) Unimi Focus Interc. 2-interc. 3-interc. 4-interc. 5-interc. 6+-interc.
Figure 2: κ-intercontact distributions. Apart from Community, nodes display a lower probability of obtaining κ-intercontact intervals lasting longer than t seconds for high κ. On average, κ-vicinity reduces κ-intercontact times. Distributions follow power laws up to a characteristic time and display exponential decay afterwards. All κ-intercontact distributions knee point concord. Community has inconsistent κ-vicinity patterns for κ ≥ 3. Interc. stands for Binary intercontact (logscale on both axes except Unimi Focus which is linear-log).
Table 1: κ-intercontact average duration in seconds. κ Dataset 1 2 3 4 5 6+ RT 1,874.3 772.2 415.7 291.5 238.4 213.1 Rollernet 738.3 555.3 412.2 328.2 273.6 242.5 Unimi 66,434.8 28,687.6 19,529.0 16,585.3 15,534.9 15,110.3 Infocom05 4,930.9 1,752.0 1,111.5 916.8 850.3 823.5 Community 525.3 232.4 193.5 262.2 317.1 295.9 nity’s κ-contact CCDFs bear the same overall outlook
with a sharper slope for smaller κ. For 1- and 2-contact CCDFs, we hint an interesting phenomenon. We find two junctions around 400 seconds and another at 1,050 seconds. Opposed to our previous expectations, we have a better chance of getting contact of duration D ∈ [400; 1, 050] seconds than 2-contact slots of the same duration.
For RT and Unimi, their 1-contacts bear different be-haviors than κ-contacts when κ ≥ 2. As hinted in the Community dataset, for some times κ, the probability of obtaining contacts slots lasting longer than t seconds is higher than the probability for the same t in other datasets. In Figure 3, this phenomenon clearly appears for Unimi. In RT, t = [0; 500] ∪ [1, 050; 10, 000] seconds. In Unimi, the assertion is valid for the whole distribu-tion. For κ ≥ 3, CCDFs aggregate into an unique one.
2-contact distribution is a mixed behavior between 1-contact and larger values of κ.
6.2
Density related behavior
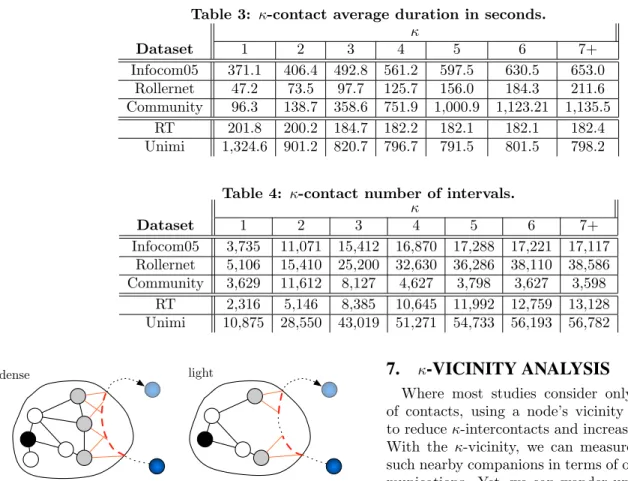
Due to the social nature of Community’s function-ing, specific nodes tend to remain together and bring a high density around popular nodes. Rollernet is a dense sport setting and Infocom05 has selective meet-ing points in the conference. They all exhibit an im-portant node-centered density, whereas Unimi and RT bear light density around each nodes. The local den-sity parameter may explain the difference between the κ-contact behaviors.
Figure 4 illustrates a situation detailing the unex-pected behavior of κ-contact distributions in light set-tings. Lighter densities limits geographical κ-vicinity coverage and induces smaller κ-contact intervals. Dense
Table 2: κ-intercontact number of intervals. κ Dataset 1 2 3 4 5 6+ RT 2,264 5,041 8,258 10,516 11,862 12,629 Rollernet 2,529 7,460 12,357 15,789 17,622 18,422 Unimi 21,737 57,085 86,009 102,495 109,406 112,323 Infocom05 3,727 11,028 15,338 16,774 17,186 17,117 Community 3613 11,561 8,034 4,505 3,660 3,477 0.001 0.01 0.1 1 1 10 100 1000 10000 P [ κ -c on ta ct > t ] Time t (seconds) Infocom05 Contact Contact 2-contact 2-contact 3-contact 4-contact 5+-contact 0.001 0.01 0.1 1 1 10 100 1000 P [ κ -c on ta ct > t ] Time t (seconds) Rollernet Contact 2-contact 3-contact 4-contact 5-contact 6-contact 7+-contact 0.001 0.01 0.1 1 1 10 100 1000 10000 P [ κ -c on ta ct > t ] Time t (seconds) Community Contact 2-contact 3-contact 4-contact 5-contact 6+-contact 0.001 0.01 0.1 1 1 10 100 1000 10000 P [ κ -c on ta ct > t ] Time t (seconds) RandomTrip Contact 3-contact 2-contact 2-contact 4+-contact 0.001 0.01 0.1 1 1 10 100 1000 10000 100000 P [ κ -c on ta ct > t ] Time t (seconds) Unimi Contact 2-contact 3-contact 4+-contact
Figure 3: κ-contact distributions. There are two major patterns: (i) dense distributions where CCDFs having larger κ suffer a top right shift and a smoother slope than smaller κ, and (ii) light distributions, where all κ-contact distributions for κ ≥ 4 aggregate and present a slight bottom left shift compared to the contact distribution (logscale on both axes).
settings ignite distributions like Infocom05, Rollernet, and Community and will be henceforth mentioned as dense distributions. Low density settings like RT and Unimi enable the second type of distributions men-tioned as light distributions.
6.3
Average duration and number of intervals
In Table 3, we displayed the average duration of κ-contact intervals and in Table 4 the number of κ-κ-contact slots for each of our five experiments. Two main be-haviors arise. On the one hand, for Infocom05, Roller-net, and Community, we find an impressive continuous growth of average slots duration for every κ. On the other hand, RT and Unimi show the opposite evolution concerning average κ-contact duration. An increase in κbrings increased average κ-contact lengths.
For most datasets, we also find a logarithmic growth of the number of κ-contact intervals. Consequently, the
number of intervals balances their length shortening. This testifies the growth in cumulated κ-contact du-rations in all datasets. Despite results observed in the previous section for RT and Unimi, for all our datasets, we find that larger values of κ increase the overall κ-contact duration and modify its distribution. The main difference lies in the fact that Infocom05, Rollernet, and Community experience longer κ-contacts for large κ than RT and Unimi, which have more shorter κ-contacts. In any case, both types have longer cumulated κ-contact times and it grows with κ.
6.4
Observations
We have seen how κ-contact distributions predomi-nantly exhibit two behaviors: light or dense distribu-tions. Dense distributions follow our logical expecta-tions. These distributions have sharper slope for lower κ and therefore a stronger demarcation among them than
Table 3: κ-contact average duration in seconds. κ Dataset 1 2 3 4 5 6 7+ Infocom05 371.1 406.4 492.8 561.2 597.5 630.5 653.0 Rollernet 47.2 73.5 97.7 125.7 156.0 184.3 211.6 Community 96.3 138.7 358.6 751.9 1,000.9 1,123.21 1,135.5 RT 201.8 200.2 184.7 182.2 182.1 182.1 182.4 Unimi 1,324.6 901.2 820.7 796.7 791.5 801.5 798.2
Table 4: κ-contact number of intervals. κ Dataset 1 2 3 4 5 6 7+ Infocom05 3,735 11,071 15,412 16,870 17,288 17,221 17,117 Rollernet 5,106 15,410 25,200 32,630 36,286 38,110 38,586 Community 3,629 11,612 8,127 4,627 3,798 3,627 3,598 RT 2,316 5,146 8,385 10,645 11,992 12,759 13,128 Unimi 10,875 28,550 43,019 51,271 54,733 56,193 56,782 dense light
Figure 4: Density related behavior for κ-contact. Density modifies the coverage zone of a node’s κ-vicinity. For dense settings, we have a long continuous κ-contact interval. For light situa-tions, we obtain two smaller κ-contacts for the same walk.
the next variety. Light distributions show κ-contact distributions with comparable behaviors and no major demarcations. They quickly aggregate into a unique distribution above κ ≥ 4. For these distributions, con-trary to our primary beliefs, the probability of getting κ-contacts longer than t seconds is higher for shorter values of κ and contact durations.
However, for all measurements, the number of κ-contact intervals increases with every κ and springs a longer cumulated κ-contact time. Dense distribution obtains more large κ-contact intervals whereas light distribu-tion has more short κ-contact intervals. Knowing which distribution fits, either light or dense, to a given situa-tion modifies the way a protocol should consider its κ-vicinity. Adapting a routing technique to dense or light κ-contact distributions accordingly may help nodes lever-age their κ-vicinity more efficiently than what is cur-rently done.
7.
κ-VICINITY ANALYSIS
Where most studies consider only the possibilities of contacts, using a node’s vicinity sounds appealing to reduce κ-intercontacts and increase κ-contact times. With the κ-vicinity, we can measure the potential of such nearby companions in terms of opportunistic com-munications. Yet, we can wonder up to which point a node should survey its vicinity to leverage it.
7.1
Density
To mirror a node’s specific κ-vicinity density, for each node, let Di
κbe the density of nodes around i, obtained
as Di κ= card(Vi κ) τ , (1) where card(Vi
κ) is the number of nodes in i’s κ-vicinity
and τ is the experiment duration. κ-density internal composition influences a node’s κ-vicinity behavior. The more κ-contacts a node has, the more chances it has of getting {κ + 1}-contacts. In Table 5, we present the average Di
κ. For datasets with participants moving
slow and steady like Infocom05, Unimi, and Commu-nity, above a certain limit Di
κdoes not increase anymore
and is limited by the network diameter. More dynamic or inconsistent patterns – RT and Rollernet – display logarithmic increase in Di
κ. For all cases, we verify Vκ
growth with κ indicating the presence of nearby nodes useable as relays for κ-contact.
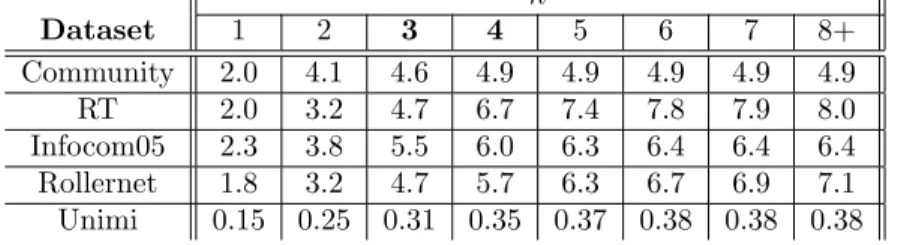
For any datasets, observing contacts only shows lim-ited Di
κ. While observing the κ-vicinity up to a few
hops – κ = {3, 4} – increases Di
κ by at least doubling it
or even tripling it. For κ > 4, the increase rate is less striking or even null. Nevertheless, longer κ-contacts
Table 5: Average number of neighbors Di
κ in a node’s κ-vicinity (whole dataset duration).
κ Dataset 1 2 3 4 5 6 7 8+ Community 2.0 4.1 4.6 4.9 4.9 4.9 4.9 4.9 RT 2.0 3.2 4.7 6.7 7.4 7.8 7.9 8.0 Infocom05 2.3 3.8 5.5 6.0 6.3 6.4 6.4 6.4 Rollernet 1.8 3.2 4.7 5.7 6.3 6.7 6.9 7.1 Unimi 0.15 0.25 0.31 0.35 0.37 0.38 0.38 0.38 in terms of path length may not be interesting because
of potential path inconsistency due to all relays move-ments. Monitoring κ-vicinity up to a {3, 4} threshold brings most of the local density a node can use.
7.2
Neighbors beyond contacts
An interesting situation occurs when pairs of nodes do not come into contact but belong to each other’s κ-vicinity. Usual protocols miss this knowledge by over-looking the potential of nearby nodes. To analyze the impact of such situations, we studied the closest dis-tance between nodes for all pair of nodes.
For Unimi and Infocom05, we find that respectively 92% and 91% of pair of nodes do come in contact. This can be explained by the datasets nature where people are coworkers and have to meet to exchange ideas. How-ever, we find that even there, some nodes do not find themselves closer than a 2-hop distance respectively for 6% and 7% of them. Other datasets deprived of the specific aim of meeting each other like Rollernet and Community show that contact only represent 31% and 42% of the lowest distances. There, respectively more than 51% and 46% stay at the closest between 2 and 4-hop distances. In RT, all pair of nodes come into con-tact at one point or another. By observing the {3, 4}-vicinity, we manage to monitor additional situations of non-contact between nodes. As a result, we catch most pairwise κ-contacts occurring in a node’s vicinity with only a threshold κ = {3, 4}.
8.
IMPLICATIONS
Opportunistic Protocols. DTN protocols chose to leverage the obvious contacts – binary intercontact pat-terns. While they may appear sufficient to elaborate routing schemes, they ignore nearby communications possibilities. As DTN rely on human mobility patterns to generate encounters and topological proximity, we should make use of hot places in a map and hubs on the connectivity plane. Gathering a node’s surround-ing situation via the κ-vicinity knowledge can help us do so. We show that observing a node’s κ-vicinity im-proves both contact opportunities and intercontact du-rations. Moreover, in Section 7, we explain how observ-ing a node’s κ-vicinity with κ = {3, 4} is enough to be
aware of most pairwise activity in the vicinity beyond contacts and to benefit from local densities.
Mobility Models. Musolesi et al. based their mobil-ity model on social network theory [10]. Their model takes into account colocating patterns by mean of social attractiveness. Their intent, with HCMM proposed by Boldrini et al [1], is one of the most sensible we have seen in terms of binding synthetical models and social patterns. Still, they limit their approach to contact patterns which results in incoherent contact and κ-intercontact distributions. In Figure 3, contact and 2-contact distributions intertwine whereas the κ-2-contact (κ ≥ 3) do not and present the same demarcation as other dense distributions. In Figure 2, binary inter-contact and 2-interinter-contact CCDFs present expected be-haviors. We find 3+-intercontact behavior inconsistent. We warn users when using such mobility models, while issued traces respect essential social patterns, they may mislead users on other incidental parameters like κ-vicinity behaviors.
9.
CONCLUSION
We propose a DTN characterization based on the vicinity viewpoint. Our motivation comes from the fact that most DTN protocols ignore their vicinity be-yond one hop. We confirm previous results of Kara-giannis et al. with regard to aggregated κ-intercontact behaviors, meaning that they follow power laws up to a given time and experience exponential decay after-wards. This allows current DTN protocols to lever-age their κ-vicinity without too much change in their functioning. We also found that κ-contact distributions globally follow two patterns which are density related. Dense environments provide logical results of κ-contact duration extension with higher κ whereas light settings display inverted paradoxical patterns. Protocols should be aware of these patterns and treat them accordingly to benefit from this knowledge. Finally, we showed how limiting a node’s awareness to their {3, 4}-vicinity is enough to benefit from most κ-vicinity advantages. As a next step, we plan on analyzing pairwise κ-vicinity behaviors on a strict pairwise level to enable better identification of peculiar events between nodes. We also would like to dive deeper into the κ-contact
no-tion and understand the different path types resulting in κ-contact.
Acknowledgments
This work is partially supported by the ANR project CROWD under contract ANR-08-VERS-006.
10.
REFERENCES
[1] C. Boldrini and A. Passarella. HCMM: Modelling spatial and temporal properties of human mobility driven by users’ social relationships. Computer Communications, 33(9):1056 – 1074, 2010. [2] A. Chaintreau, P. Hui, J. Crowcroft, C. Diot,
R. Gass, and J. Scott. Impact of Human Mobility on Opportunistic Forwarding Algorithms. IEEE Transactions on Mobile Computing, 6(6):606–620, 2007.
[3] A. Chaintreau, A. Mtibaa, L. Massoulie, and C. Diot. The Diameter of Opportunistic Mobile Networks. In ACM CONEXT, 2007.
[4] V. Conan, J. Leguay, and T. Friedman.
Characterizing Pairwise Inter-contact Patterns in Delay Tolerant Networks. In Autonomics, 2007. [5] S. Gaito, E. Pagani, and G. P. Rossi.
Fine-Grained Tracking of Human Mobility in Dense Scenarios. In IEEE SECON poster session, 2009.
[6] P. Hui, J. Crowcroft, and E. Yoneki. BUBBLE Rap: Social-Based Forwarding in Delay-Tolerant Networks. IEEE Transactions on Mobile
Computing, 10:1576–1589, 2011. [7] T. Karagiannis, J.-Y. Le Boudec, and
M. Vojnovi´c. Power Law and Exponential Decay of Inter Contact Times between Mobile Devices. In ACM MOBICOM, 2007.
[8] Q. Li, S. Zhu, and G. Cao. Routing in Socially Selfish Delay Tolerant Networks. In IEEE INFOCOM, 2010.
[9] A. Lindgren, A. Doria, E. Davies, and S. Grasic. Probabilistic Routing Protocol for Intermittently Connected Networks draft-irtf-dtnrg-prophet-09, 2011. DTN Research Group Internet-Draft. [10] M. Musolesi and C. Mascolo. Designing Mobility
Models based on Social Network Theory. SIGMOBILE Mob. Comput. Commun. Rev., 11:59–70, July 2007.
[11] S. Pal Chaudhuri, J.-Y. Le Boudec, and M. Vojnovic. Perfect Simulations for Random Trip Mobility Models. In IEEE INFOCOM, 2005. [12] A. Passarella and M. Conti. Characterising
aggregate inter-contact times in heterogeneous opportunistic networks. In IFIP NETWORKING, 2011.
[13] T. Phe-Neau, M. Dias de Amorim, and V. Conan. Fine-Grained Intercontact Characterization in
Disruption-Tolerant Networks. In IEEE ISCC, 2011.
[14] T. Phe-Neau, M. Dias de Amorim, and V. Conan. Using Neighborhood Beyond One Hop in
Disruption-Tolerant Networks, 2011. http://arxiv.org/abs/1111.0882v1. [15] T. Spyropoulos, K. Psounis, and C. S.
Raghavendra. Spray and Wait: An Efficient Routing Scheme for Intermittently Connected Mobile Networks. In ACM SIGCOMM workshop on Delay-tolerant networking, 2005.
[16] P.-U. Tournoux, J. Leguay, F. Benbadis, J. Whitbeck, V. Conan, and M. D. de Amorim. Density-Aware Routing in Highly Dynamic DTNs: The RollerNet Case. IEEE Transactions on Mobile Computing, 10:1755–1768, 2011. [17] A. Vahdat and D. Becker. Epidemic Routing for
Partially Connected Ad Hoc Networks. Technical report, Duke University, 2000.