HAL Id: inria-00485619
https://hal.inria.fr/inria-00485619
Submitted on 21 May 2010
HAL is a multi-disciplinary open access
archive for the deposit and dissemination of
sci-entific research documents, whether they are
pub-lished or not. The documents may come from
teaching and research institutions in France or
L’archive ouverte pluridisciplinaire HAL, est
destinée au dépôt et à la diffusion de documents
scientifiques de niveau recherche, publiés ou non,
émanant des établissements d’enseignement et de
recherche français ou étrangers, des laboratoires
Cold Start Link Prediction
Vincent Leroy, B. Barla Cambazoglu, Francesco Bonchi
To cite this version:
Vincent Leroy, B. Barla Cambazoglu, Francesco Bonchi. Cold Start Link Prediction. The 16th ACM
SIGKDD Conference on Knowledge Discovery and Data Mining, Jul 2010, Washington DC, United
States. 12 p. �inria-00485619�
Cold Start Link Prediction
Vincent Leroy
INSA Rennes, UEB
Rennes, France
vincent.leroy@irisa.fr
B. Barla Cambazoglu
Yahoo! Research
Barcelona, Spain
barla@yahoo-inc.com
Francesco Bonchi
Yahoo! Research
Barcelona, Spain
bonchi@yahoo-inc.com
May 21, 2010
Abstract
In the traditional link prediction problem, a snapshot of a social network is used as a starting point to predict, by means of graph-theoretic measures, the links that are likely to appear in the future. In this paper, we intro-duce cold start link prediction as the problem of predict-ing the structure of a social network when the network itself is totally missing while some other information re-garding the nodes is available. We propose a two-phase method based on the bootstrap probabilistic graph. The first phase generates an implicit social network under the form of a probabilistic graph. The second phase applies probabilistic graph-based measures to produce the final prediction. We assess our method empirically over a large data collection obtained from Flickr, using interest groups as the initial information. The experi-ments confirm the effectiveness of our approach.
Categories and Subject Descriptors H.2.8 [Database Management]: Database Applications
-Data mining
General Terms Algorithms, Experimentation
Keywords Link prediction, probabilistic graph, social
networks
1
Introduction
Link prediction, introduced by Liben-Nowell and
Klein-berg [15], refers to a basic computational problem un-derlying social network evolution in time. Given a snap-shot of a social network at time t and a future time t′, the problem is to predict the new friendship links that are likely to appear in the network within the time in-terval [t, t′]. As Liben-Nowell and Kleinberg state, the link prediction problem is about to what extent the evo-lution of a social network can be modeled using features intrinsic to the network itself. Indeed, in their frame-work, they consider only the features that are based on the link structure of the network.
In this paper, we tackle a similar, but fundamentally different problem, which we dub the cold start link
diction problem: similar because we also aim at
pre-dicting links, but different because we aim at doing this without any, even partial, knowledge of an existing link structure. Herein, we assume that either the social net-work explicitly exists, but is kept secret by its owner, or it does not exist at all. In both cases, we are interested in predicting possible links among the users of a service by exploiting other types of information available, e.g., interest groups, tags, sales data.
Consider, for instance, a company C selling music on-line and a general-purpose social networking service S. Suppose C and S have made the following agreement: (1) S offers a functionality so that users can make re-views of their favorite songs and these rere-views are made available to their contacts, and (2) when a user clicks on a song title, the user is redirected to the corresponding page in C’s website, but (3) S keeps the structure of its social network as a trade secret (this may be a manda-tory constraint due to privacy regulations). Thanks to this agreement, users of S might influence each other to buy songs, and the easiest way for them to purchase songs would be through the website of C. In this sce-nario, C only owns information about the buying his-tory of its customers, but has no explicit knowledge of the social network implicitly underlying its set of cus-tomers.
The question tackled herein is the following: can C
nevertheless infer the social network (to an acceptable level of accuracy), just using the information contained in the sales history?
This would be useful for many reasons. First, it would enable adoption of viral marketing strategies [7, 14]. Second, it would facilitate social-network-based ser-vices, such as providing personalized advertisement. Third, if C decides, in the future, to adopt its own explicit social network, this may be used to recommend possible friends to users, thus speeding up the initial growth of the network.
In this context, we propose a two-phase method based on the bootstrap probabilistic graph for cold start link prediction. In the first phase, based on some limited in-formation (potentially, weakly correlated with the link
structure of the network), the method predicts the exis-tence of links. The output of this phase is a probabilistic graph, i.e., a graph where each edge is labeled with a probability representing the confidence of the predic-tion, or in other terms, the uncertainty of the existence of a link. The second phase takes as input the proba-bilistic graph and refines it by adopting graph-theoretic measures as done in the classical link prediction setting. The difference is that, in our case, the input graph is probabilistic and hence the traditional measures must be adapted to deal with this case [18].
We apply our method to a large data collection ob-tained from Flickr, a popular online community for im-age and video sharing. We keep the existing social net-work (made of directed arcs1) as the ground truth for
the link structure that we aim to predict. As the avail-able auxiliary information, we use users’ memberships in interest groups.
Three observations are note-worthy. First, the cold start link prediction problem is intrinsically a very dif-ficult binary prediction problem due to the skewness of the target variable. In fact, assuming directed arcs as in our context, given n nodes, we have a universe of n2−n
possible links, of which only a very small fraction ex-ists in the ground truth. In our data, the positive class (existing links) constitutes approximately 0.07% of all possible links.
The second observation is that we apply our method starting with “little” information, which provides a very small coverage of existing links. Indeed, in Flickr, in-terest group membership2 is a very weak predictor of
links, as a group gathers people interested in photos regarding a specific subject or technique (e.g., “Nikon
Selfportrait”, “HDR Panoramas”, “Cat and Dog: not Cat or Dog”), and they are not groups of friends or
small communities (as it is mostly the case in Facebook groups). More precisely, in our data, considering only the users who belong to at least one group, we have approximately 28M links, of which only 1.9% (approx-imately 550K links) are among two users that share at least one common group. Despite the difficulty of our prediction task, our two-phase method based on the bootstrap probabilistic graph can achieve good predic-tion performance.
Finally, it is very important to note that, even though the first phase features used herein are geared to group membership information, the overall framework we pro-pose is general and applicable to any input information. In some cases, the available auxiliary information could be much more predictive than the one used in our exper-iments or more information might be available. If this is the case, all available information should be used in order to bootstrap the probabilistic graph as accurately
1We use the terms arc and link interchangeably. 2http://www.flickr.com/groups
as possible.
Our contributions can be summarized as follows:
• We introduce cold start link prediction as the
prob-lem of predicting the link structure of a social net-work assuming unavailability of an initial netnet-work and using other available information.
• Our work has privacy and security implications as
it sheds light on to what extent a social network can be reconstructed and how resilient an anonymiza-tion soluanonymiza-tion is to link predicanonymiza-tion attacks.
• We propose a two-phase method based on the
boot-strap probabilistic graph as a feasible solution to the cold start link prediction problem.
• We apply our method to predict the link structure
of the Flickr social network by using only the inter-est group membership information. As discussed previously, group membership is a weak predictor for friendship and hence suits well to our purpose of starting the social network with little available information.
• We assess the predictive power of various features
based on group membership (phase 1), such as the time a user joins a group and the size of the group. The features we use herein can be considered to be somewhat general and are applicable to other prob-lem instances as long as the available information can be mapped to a group structure. For instance, a thread on a discussion board can be mapped to a group, and the same features can be used for pre-dicting friendship between the users of a bulletin board service.
• We adapt various graph-theoretic measures to deal
with probabilistic graphs (phase 2).
The rest of the paper is organized as follows. In the next section, we discuss related work. In Section 3, we present the formal definition of the problem and the proposed two-phase method. In Section 4, we describe the data we use for assessing our method, which is then developed in Section 5 (phase 1) and Section 6 (phase 2). Finally, in Section 7, we discuss future research lines and conclude the paper.
2
Related work
Liben-Nowell and Kleinberg [15] introduce the link pre-diction problem and show that simple graph-theoretic measures, such as the number of common neighbors, are sufficient to efficiently detect links that are likely to ap-pear in a social network. Through the use of more elab-orated measures that consider the ensemble of all paths between two nodes (e.g., the Katz measure), they fur-ther improve the prediction quality. The graph features presented in Section 6 are inspired by Liben-Nowell and Kleinberg’s work but they are adapted to probabilistic graphs.
Taskar et al. [21] apply link prediction to a social net-work of universities. They rely on machine learning techniques and use personal information of users (mu-sic, books, etc.) to increase the accuracy of predictions. Following a similar approach, O’Madadhain et al. [17] focus on predicting events between entities and use the geographic location as a feature. Clauset et al. [6] apply link prediction to biology and physics using hierarchi-cal models in order to detect links that have not been observed during experimentation. All these approaches rely on the availability of an initial link structure for prediction while the method we present addresses the cold start problem, i.e., the case where no initial link structure is available.
Several probabilistic models such as Markov logic [8], relational Markov networks [21], Markov random fields [5], and probabilistic relational models [12] have been used to efficiently capture the relation in data. Unfortunately, these approaches have not been proved to scale as they have been tested only on small data sets.
Van der Aalst et al. [22] extract a social network from logs of interactions between workers in a company. Sim-ilar works include mining email communications [3] and proximity interactions [9]. In each case, the authors start with a very dense graph and the idea is to iden-tify the social network in this graph. The difficulty of the task is due to the huge amount of data. In our problem, we have the opposite situation: the informa-tion used to generate the bootstrap probabilistic graph, which enables link prediction, is very sparse. Hence, the information needs to be spread, not pruned.
Since we deal with reconstructing information that might be considered sensitive (the links of a social net-work), our work has privacy implications. In fact, our method can be used by an attacker to threaten link pri-vacy in a social network, thus it can be used to test the resilience of anonymization solutions. Several pa-pers [2, 13, 16] study the problem of social network anonymization and the impact of the available knowl-edge on the inference of hidden information that should remain secret. Zheleva et al. [26] consider a social net-work in which some users hide their information and others make it public. The applications presented in-clude predicting the country of Flickr users through their group membership information. Their results in-dicate that group membership is a weak predictor.
3
Problem and Method
3.1
Problem
We are given a setU of users and a multiset G of groups of users. We denote the set of groups to which a user
u belongs to, m(u) ={g ∈ G| u ∈ g, g ⊆ U}, as her
membership set. Our task is to reconstruct the links
of a social graph N = (U, A), where the nodes are the users and the arcs A ⊆ U × U represent a (one-way) relation between two users. Reconstructing the social networkN means to predict which of the links in U ×U actually exist inA, or in other terms, to build a function
f :U × U → {0, 1}.
3.2
Method
We propose a two-phase method based on the boot-strap probabilistic graph for cold start link prediction. During the first phase, we predict the existence of links based only on the group membership informa-tion. The output of the first phase is the bootstrap probabilistic graph, i.e., a directed probabilistic graph
BP G = (U, E, p1), where E ⊆ U × U, and every link
(u, v)∈E is labeled with a probability p1(u, v) > 0
repre-senting the confidence (or uncertainty) about the link’s existence, i.e., p1:U × U → [0, 1].
In particular, after the first phase, we have p1(u, v) =
0 and p1(v, u) = 0 for every user pair (u, v), where m(u)∩ m(v) = ∅. This is because if two users have no
groups in common, a prediction cannot be made about the existence of a link between them. Moreover, we have p1(u, v) > 0 for every user pair (u, v) such that m(u)∩ m(v) ̸= ∅ (this will also hold for the reverse
arc (v, u)). Links with null probabilities do not exist in
BP G.
The second phase takes as input the bootstrap prob-abilistic graph BP G, and it refines the probability dis-tribution p1 into a new probability distribution p2, by
means of graph-based features. Therefore, the out-put of the second phase is a probabilistic graph P G = (U, E, p2). After the second phase, some links that
pre-viously had p1(u, v) = 0 can now possibly have a
non-null score, p2(u, v) > 0, thus extending the overall recall
of the method.
3.3
Result presentation
In most real-world social networks, the links in a social graphA form only a small fraction of the total number of possible links, i.e.,|A| ≪ |U|2. This means that accu-racy is not a very meaningful measure in this context,
given that, by predicting always 0 (the link does not exist), it is possible to achieve an accuracy of 99.93% in our data. Also, comparing different predictors by means of precision and recall is not very appropriate, given the very low maximum recall achievable (only 0.037 in our data). Therefore, in order to compare the perfor-mance of different predictive functions by eliminating the skewness between possible and existing links, we adopt the ROC curve metric [19] as the main way of pre-senting our results. For the best predictor of each fea-ture group, we also provide recall/fallout ratios. Recall
is the ratio between the number of true positives (cor-rectly predicted existing links) and positives (existing links) while fallout is the ratio between the number of
false positives (links erroneously predicted to exist) and negatives (not existing links). Given a predictor
func-tion f , we may interpret recall and fallout as the follow-ing probabilities, respectively: p(f (u, v) = 1|(u, v) ∈ A) and p(f (u, v) = 0|(u, v) /∈ A). Now, suppose to have recall/fallout = 8 for a predictor f . This means that for two users (u, v)∈A for whom a link exists, it is 8 times more likely to have f (u, v) = 1 than for two users who are not connected.
4
Dataset
Flickr is a highly popular online social network, whose primary objective is to facilitate sharing of images among people. In Flickr, a user can place other users in three privilege classes: contact, friend, and family. Depending on the class, the user can restrict access to its properties (e.g., images, videos). In this work, un-less otherwise stated, we work on the contact class. In Flickr, links are directed. In our data, we found that approximately only 1/3 of the links are unidirectional. Most of the features we use in Section 5 are symmet-ric. This means that we predict the same likelihood for links’ existence in both directions.
4.1
Dataset preparation
We sample a subset of the entire Flickr social network by applying the snowball sampling strategy, starting from a single, highly connected seed user and following the contact links between users in an iterative manner. The adopted sampling strategy increases the chance of selecting more active users, who have higher connectiv-ity in the network (i.e., more links). In our case, this is desirable as users with few or no friends are relatively less interesting for our prediction task. For each user in the sample set, we store all links and groups asso-ciated with the user as well as some other information in a MySQL database for latter processing. From the sampled set of users, we remove the ones who are not members of any group. This is because the proposed techniques are applicable to users who have at least one group membership.
4.2
Dataset properties
After the above-mentioned pruning, we are left with 198,315 users. The type and number of existing links are reported in Table 1. The same table (second line) also reports how many of these existing links are among two users that have at least one common group: this is the maximum number of links predictable in the first
Table 1: Number and type of links
Possible links Contact Friend Family
Total 39, 328, 640, 910 28, 249, 755 13, 529, 634 2, 145, 691 Phase 1 54, 945, 936 553, 977 282, 168 42, 426 Phase 2 1, 165, 664, 850 1, 072, 595 499, 811 76, 453
Table 2: Dataset properties
Property Min. Avg. Max. # of users in a group 1 8.8 3,497 # of groups of a user 1 3.1 172 # of contact links of a user 1 142.5 11,956 # of friend links of a user 1 68.2 11,121 # of family links of a user 1 10.8 4,250
phase, or in other terms, links for which we will have
p1(u, v) > 0. In the second phase, we use measures based
on paths formed by the links between users. This means that we cannot predict the existence of a link between two users, each belonging to a different connected com-ponent of the bootstrap probabilistic graph. The max-imum number of links predictable in the second phase is also reported in Table 1 (the third line). The number of groups we have is 69,793. Various properties of our dataset are displayed in Table 2.
According to Fig. 1 (left), the frequency of group sizes follows a highly skewed distribution, i.e., there are few, very large but many, very small groups. 35.3% of groups have only one member. Groups of size less than 3 con-stitute about half of the total number of groups. Fre-quency distribution for group membership is even more skewed. 47.0% of users are members in only one group. The number of users who are members in at most 10 groups constitutes 95.6% of the total number of users. A highly skewed distribution is also observed in frequency of users’ link counts (Fig. 1 (right)).
5
Bootstrap phase
5.1
Basic features
In the first phase, we bootstrap the probabilistic graph using the group membership information. In particu-lar, we explore four types of features: number of groups,
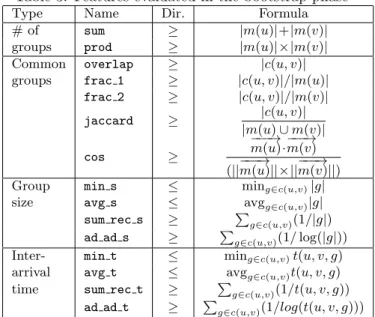
number of common groups, size of common groups, and difference in joining time. Since, in this phase, the probabilities are assigned to only the links between users who share at least one group, in the rest of this section, we report ROC curves computed only on this subset of links. For the recall/fallout curves, we in-stead use the whole dataset, as this gives a better idea about the discriminative power of a feature. Through-out this section, the reader may refer to Table 3 for definitions of the features. We denote by c(u, v) the set
Figure 2: Indegrees and outdegrees of users as their number of group memberships increases.
Figure 3: The recall/fallout curve for the prod feature.
Figure 4: ROC curves for features related to the number of group mem-berships of users.
Figure 5: Fraction of links between user pairs as their number of com-mon groups increases.
Figure 6: The recall/fallout curve for the overlap feature.
Figure 7: ROC curves for features related to similarity of group mem-berships.
Figure 1: (Left) Frequency distributions for group mem-bership and group size. (Right) Frequency distribution for the number of links that users have.
of groups that are common to both users u and v, i.e.,
c(u, v) = m(u)∩ m(v). The absolute value of the
differ-ence in time that u and v joined group g is denoted by
t(u, v, g).
5.1.1 Number of groups
The number of groups of a user might be a good indi-cator of the user’s level of engagement and activity in the social network. As the user is more active, he may tend to have more links. Fig. 2 shows how the number of links of a user changes as the number of group mem-berships increases. We observe a very linear behavior, which may indicate a correlation between the number of groups and the number of links. We also observe that the number of out-links increases at a slightly faster rate than in-links as users join more groups.
We evaluate two features based only on the number of groups. Given two users u and v, we define sum and prod, respectively, as the sum and product of |m(u)| and |m(v)| values. Obviously, as the feature values increase, the likelihood of having a link increases. In Fig. 3, we report the recall/fallout ratio for different thresholds of prod. The plot gives an indication of how predictive the feature is. As an example, for two linked users u and v, it is 200 times more likely to have
Table 3: Features evaluated in the bootstrap phase
Type Name Dir. Formula
# of sum ≥ |m(u)|+|m(v)|
groups prod ≥ |m(u)|×|m(v)| Common overlap ≥ |c(u, v)| groups frac 1 ≥ |c(u, v)|/|m(u)|
frac 2 ≥ |c(u, v)|/|m(v)| jaccard ≥ |c(u, v)| |m(u) ∪ m(v)| cos ≥ −−−→ m(u)·−−−→m(v) (||−−−→m(u)||×||−−−→m(v)||)
Group min s ≤ ming∈c(u,v)|g|
size avg s ≤ avgg∈c(u,v)|g| sum rec s ≥ ∑g∈c(u,v)(1/|g|) ad ad s ≥ ∑g∈c(u,v)(1/ log(|g|)) Inter- min t ≤ ming∈c(u,v)t(u, v, g)
arrival avg t ≤ avgg∈c(u,v)t(u, v, g)
time sum rec t ≥ ∑g∈c(u,v)(1/t(u, v, g)) ad ad t ≥ ∑g∈c(u,v)(1/log(t(u, v, g)))
Fig. 4 shows the ROC curves for the two features: according to the plot, the performances of sum and prod are very close, but prod performs slightly better.
5.1.2 Common groups
Intuitively, being a member of the same groups should be a strong indicator of the existence of a possible link. An active group member may influence his existing friends to join the group as new members. This means that members of the same group are more likely to have existing friendship links among themselves. From an-other perspective, groups may be a suitable medium to meet other users and form friendships, thus groups may lead to creation of new links.
Fig. 5 verifies this hypothesis by measuring the frac-tion of links among users having membership in the same groups. Specifically, for each value x of common groups, we compute
|{u,v ∈U | x=|c(u, v)| ∧ (u, v)∈A}| |{u,v ∈U | x=|c(u, v)|}| .
As expected, the fraction of links increases as the users have more groups in common.
Fig. 6 reports the recall/fallout curve for different numbers of common groups. We can observe that for two linked users, the probability of having more than 10 common groups is approximately 600 times larger than for two users that have no link. This number grows to 1800 for the probability of having no less than 24 common groups.
We evaluated five different features based on com-mon groups: overlap, which is the number of comcom-mon groups; frac 1 and frac 2, which are the overlap nor-malized by the number of groups of the first and second
users, respectively; jaccard, which is the Jaccard coef-ficient; and cos, indicating the cosine similarity com-monly used in information retrieval. ROC curves of these five features are shown in Fig. 7. Interestingly, we observe that all features except for overlap perform worse than random prediction, which would correspond to the diagonal of the plot. This can be easily explained with the very high number of pairs of users being mem-bers of only one group. When two of such users are part of the same group, they receive the maximum value of frac 1, frac 2, jaccard, and cos although these two users are very likely to be not linked. We observed this effect also for variations of these features, such as the weighted cosine similarity feature (using tf-idf weight-ing), and also for some other features with normaliza-tion.
5.1.3 Group size
It can be claimed that two users are more likely to be friends if they are members of a small group than a large group as 1) group founders are more likely to prefer their friends over other users in invitations they send and 2) large groups are more likely to be general-purpose groups, attracting different users with equal likelihood. We verify this claim in Fig. 8, which shows the density of links with increasing group size. The link density is computed as
∑
g∈G|{u,v ∈U | (u, v)∈A ∧ x=|g| ∧ g ∈c(u, v)}| |{g ∈G | x=|g|}| × x × (x + 1) ,
where the average link count for groups of size x is normalized with the maximum possible link count (x×(x+1)).
For contact and friend links, we observe a significant drop in density values at very small group sizes, followed by a linear drop as the group size increases. The density of family links is not affected much by the increase in the group size, potentially, due to the very low number of such links.
We try four different features based on the size of common groups: min s and avg s denote the minimum and the average size of the common groups, respec-tively; the summation of the reciprocal of size is de-noted by sum rec s; and Adamic/Adar-size is dede-noted by ad ad s. The last feature is inspired by the measure defined by Adamic and Adar in [1] for deciding when two personal home pages are strongly related, and then borrowed and adapted by Liben-Nowell and Kleinberg [15] to deal with common neighbors in the context of link prediction. Here, we re-adapt this measure to deal with the size of common groups and compute
ad ad s(u, v) = ∑
g∈c(u,v)
1 log(|g|).
Figure 8: Link density within a group as group size increases.
Figure 9: The recall/fallout curve for the ad ad s feature.
Figure 10: ROC curves for features related to group sizes.
Figure 11: Fraction of links with varying inter-arrival time.
Figure 12: The recall/fallout curve for the ad ad t feature.
Figure 13: ROC curves for features related to the difference in dates of membership.
The recall/fallout curve for ad ad s is displayed in Fig. 9. We observe that the probability of having ad ad s(u, v)≥ 1 for an existing link (u, v) is approx-imately 200 times larger than for a non-existing link (u, v), and the ratio keeps growing almost linearly.
Fig. 10 shows that features that are based on group size perform quite well, with ad ad s outperforming the others.
5.1.4 Difference in joining time
In the last set of features, we investigate the temporal coherency between linked users joining the same group. We may expect that friends are likely to inform each other from existence of a group just before (or just after) joining it. Hence, we may expect that linked users are likely to join the same group with small time gaps (inter-arrival time).
Fig. 11 shows the fraction of links with increasing inter-arrival time. For each possible inter-arrival time value x (discretized into days), we compute
|{u,v ∈U, g ∈G | (u, v)∈A ∧ x=t(u, v, g) ∧ g ∈c(u, v)}| |{u,v ∈U, g ∈G | x=t(u, v, g) ∧ g ∈c(u, v)}| .
According to the figure, as expected, linked users are more likely to join the same group with a small inter-arrival time. It is interesting to note that an increase is observed in the likelihood of having a link, around a year inter-arrival time. This may be explained by the existence of “seasonal” groups, i.e., groups that re-fer to events held once per year and that attract new members in that period (e.g., “Glastonbury Festival” or
“Christmas Worldwide”).
As the features, we try the same feature set we used for the group size, simply by replacing group size with inter-arrival time: min t, avg t, sum rec t, and ad ad t. As in the case of group size features,
Adamic/Adar-time (ad ad t) performs the best among
all features of this class (Figs. 12 and 13). The irregular shape of the ROC curve as well as of the recall/fallout curve are due to the seasonal behavior discussed before.
Figure 14: ROC curves for the best feature from each category and the best combined feature.
Figure 15: Mapping scores to proba-bilities, for generating the bootstrap probabilistic graph.
Figure 16: Distribution of probabil-ities in the bootstrap probabilistic graph.
5.2
Combining basic features
Next, we try to combine a number of features from pre-vious sections to create a single, hybrid feature with higher predictive power than the basic features. For this purpose, we evaluate various possible combina-tions of our best performing features, trying to find a good trade-off between predictive power and simplic-ity (which also translates to generalsimplic-ity). The best per-forming combination turns out to be ad ad s×ad ad t× log prod, referred to as combined.
An important observation is that the features ad ad t, ad ad s, and prod perform relatively well for high, medium, and low confidence intervals, respec-tively. This is the reason for the combined feature, which unifies them, to perform the best across all in-tervals. No features from the class using the number of common groups is directly used in the combined feature as this is subsumed in the two Adamic/Adar features, which compute a sum over all common groups.
Fig. 14 compares combined against the best-performing feature from each of the four categories. We use combined to bootstrap the probabilistic graph, as shown next.
5.3
Bootstrap probabilistic graph
So far, we have proposed various measures and evalu-ated their predictive power. We have then combined them under a simple but yet effective feature. We now finalize the first phase of our method by producing the bootstrap probabilistic graph. To this end, we need to convert the scores provided by the combined feature into probabilities. This is a mandatory step to be able to combine the values of the edges in a meaningful way. Converting scores to probabilities is not straightfor-ward since the relation between them is often not lin-ear. This problem has been studied for different kinds
of classifiers [11, 23, 24, 25], but with score distributions different from the one we observe in our case.
In Fig. 15, we observe a logarithmic shape in the dis-tribution of probabilities with respect to scores. Using a curve fitting algorithm, we could map the function to the data, but depending on the feature used, this mapping could be completely different. In our case, to remain general, we just assume the knowledge that it follows a logarithmic distribution. We design a very simple function that maps the highest score output by the combined feature to a probability of 1 and assigns the remaining probabilities as
probability = log(score +1)
log(max score +1).
Fig. 15 shows that our simple approximation is very rough. However, it is good enough as it will be shown in the next section. The probability distribution in the bootstrap probabilistic graph is reported in Fig. 16. The graph consists of 1,238 connected components, of which 42 have more than 1,000 nodes, 10 have more than 5,000 nodes, and the largest connected component has more than 20,000 nodes.
6
Probabilistic graph measures
6.1
Graph-theoretic features
In the first phase of our method, we have predicted, for some pairs of users, the probability to have a link. In the second phase, we refine and extend this predic-tion by considering transitivity of contact relapredic-tionship. As shown in [15], users who have many common con-tacts are more likely to be friends. Using graph-based features, we can spread the link prediction to pairs
Figure 17: ROC curves for the common neighbors.
Figure 18: ROC curves for the katz feature.
Figure 19: ROC curves for the rooted pagerank feature.
of users who have no common groups but share con-tacts. Therefore, we compute graph-based measures on the bootstrap probabilistic graph for all pairs of users who are in the same connected component. If two users are not connected by a path in the probabilistic graph, then they will have a null probability also after phase 2. In the following, we adapt to the probabilis-tic case three graph-based measures that are reported to perform well in [15]: common neighbors, katz, and rooted pagerank.
6.1.1 Probabilistic common neighbors
Having a high number of common contacts may be an indication of the existence of a link. We adapt this idea to our probabilistic graph in a straightforward way. For a given user pair (u, v), common neighbors simply computes the sum of the probability that each node is connected to both u and v, i.e.,
common neighbors(u, v) =∑
y∈U
p1(u, y)× p1(v, y).
A consequence of this definition is that all pairs of users who are more than two hops away in the graph are assigned a zero score. Recall that the probability p1
computed in the first phase is symmetric, i.e., p1(u, v) = p1(v, u).
6.1.2 Probabilistic Katz
The Katz measure computes a score between two users based on the number of paths existing between them, exponentially damped by length to count short paths more heavily. In other words, a path of length ℓ is weighted by βℓ, where 0≤ β ≤ 1. We adapt this
mea-sure to deal with probabilistic graphs by further weight-ing each path by its existence probability, which is the product of the probabilities of the links that compose it.
Let path⟨ℓ⟩u,vbe the set of paths of length ℓ between u and v inU and pathProb(h) be the existence probability of a path h. Then, katz is computed as
katz(u, v) = ∞ ∑ ℓ=1 (βℓ× ∑ h∈path⟨ℓ⟩u,v pathProb(h)).
6.1.3 Probabilistic rooted PageRank
The rooted pagerank feature computes a score be-tween nodes u and v by running rooted PageRank, starting from u. We use an algorithm [10] based on random walks to get an estimation of PageRank scores. Inspired by [18], we adapt it to our probabilistic graph by sampling existing links at each step of a walk us-ing the probabilities in the graph. The walk continues using an existing edge chosen at random as in the clas-sic unweighted version of PageRank. We set a stop-ping probability α and run W walks for each node. rooted pagerank(u, v) is not null if at least one walk starting at u reaches v. Thus, a user u potentially has a positive score with all other users in his connected component. However, if the number of walks and link probabilities are both very low, this may not be the case. If u and v are not in the same component, then the link (u, v) receives a null score.
6.2
Experimental results
We evaluate the three features by comparing our method based on the bootstrap probabilistic graph (BPG) with two alternative methods. These methods work on deterministic graphs (DG) obtained from BPG, by selecting only the links with a probability higher than a given threshold. Note that since the probability function we designed is monotonic, this is equivalent to a score threshold. It is also worth noting that us-ing a high threshold would compromise seriously the
Figure 20: ROC curves for the three phase 2 features and the combined feature from phase 1.
Figure 21: Precision–recall for the katz feature.
Figure 22: Recall/fallout for the common neighbors feature.
Figure 23: ROC curves for the common neighbors (friends).
Figure 24: ROC curves for the katz feature (friends).
Figure 25: ROC curves for the rooted pagerank feature (friends). recall of the method. Indeed, a larger threshold implies
that fewer links will be selected, which in turn implies a smaller density for the resulting graph and thus a large number of small components. Since graph-based fea-tures produce scores only for pairs of users belonging to the same connected component, using a large thresh-old would give very small recall. Therefore, for the two alternative methods, we use 0 and 0.005 as the thresh-olds. The methods are accordingly named as DG 0 and DG 0.005. While DG 0 can achieve the same recall as BPG, DG 0.005 can only predict a smaller number of links due to the lower density as discussed above.
Fig. 17 displays the ROC curves for common neighbors. Despite its simplicity, common neighbors performs quite well with BPG as seen from the sharp rise in the true positive rate for predictions with high confidence (early data points). The ROC curve of DG 0 remains always under the curve of BPG. DG 0.005 produces results closer to BPG, but at the price of a lower recall. In the figure, some portion of the curves are not displayed for better visibility of the rest (the last data point is (0.607, 0.953) for DG 0 and BPG curves).
For katz, following [15], we set β to 0.005. For scala-bility reasons, we also set an upper bound on the path length. Since BPG is quite dense, the number of paths becomes important for large values. As β is small and thus long paths have very little weight, the impact on precision is negligible. In our experiments, pairs that are more than two hops away in BPG receive a zero score. Fig. 18 shows the performance of katz. BPG still outperforms DG 0 and DG 0.005, but the gap is small, relative to common neighbors.
For experiments on rooted pagerank, we set α to 0.15 and W to 1000. According to the ROC curves shown in Fig. 19, rooted pagerank performs poorly, relative to common neighbors and katz, in terms of both coverage of predictions and their quality. Increas-ing W does not have a significant effect on the result quality, but it increases the coverage of predictions. We believe that rooted pagerank can be efficiently applied on a given user to sort the other users by contact prob-ability. However, the scores obtained through this mea-sure are not comparable across different users. This is due to the fact that PageRank shares a fixed, total score among all users. A user with many potential neighbors
is assigned a score lower than a more isolated one, re-sulting in poor quality predictions at a full graph scale. Fig. 20 brings together the ROC curves for the combined feature and the three phase 2 features (as-suming the BPG scenario). The plot demonstrates the gain achieved by phase 2 over the results of phase 1. The performance of katz is seen to be very close to common neighbors.
As a representative, Fig. 21 shows the precision–recall plot for the katz feature. BPG achieves pretty high precision values relative to DG 0 and DG 0.005 under the equal recall constraint. Despite the difficulty of the problem, precision and recall values achieved by BPG indicate the validity of the proposed method (e.g., at a recall of 1%, we observe a precision around 31%).
As another representative, Fig. 22 shows the re-call/fallout curve for the common neighbors feature. BPG is able to leverage the low probability edges to increase recall without losing precision while non-probabilistic approaches either prune this noise and lose recall or use these edges but suffer from low precision.
We have also conducted experiments using friend links instead of contacts. We do not report results for family links due to space limitations. Figs. 23, 24, and 25 show performance of common neighbors, katz, and rooted pagerank, respectively, in predicting friend links. For all three techniques, higher prediction quality is achieved relative to contact links.
In this work, we have preferred not to combine the predictive power of the three features of phase 2 (e.g., by means of machine learning techniques). The ratio-nale behind this choice is two-fold. First, as we have ex-plained before, rooted pagerank is not suitable for pre-diction at a full graph scale. Second, common neighbors can be seen as a special case of katz in which the max-imum path length is 2 and β is set to 1. Therefore, we expect only little improvement in prediction accuracies by further combinations.
7
Conclusions and future work
We presented the cold start link prediction problem and a two-phase method that enables link prediction in the absence of a social network. The first phase of the pro-posed method generates a bootstrap probabilistic graph using any available feature while the second phase ap-plies various link prediction algorithms to this proba-bilistic graph. We tested our approach over a data set obtained from Flickr, by using group memberships as the only available information.
For the sake of generality, we applied our method to interest groups, a very simple and common kind of in-formation in social networks. Thus, the features we present can be applied to other networks. Obviously, as
more information is available, higher prediction accura-cies can be achieved.
In the context of Flickr, we might use information that is more specific to photography in order to improve prediction performance. For instance, in [20], Singla and Weber study the impact of the social network on camera brands of Flickr users. We could leverage such information to create more accurate predictors. Sim-ilarly, as observed in [4], information diffusion often follows the social network. This is known as the so-cial cascade phenomena and can be observed in Flickr when users favorite others’ pictures and post comments about them. If this information is available, it can be used as a bootstrap feature to generate a probabilistic social graph that matches the observed social cascade.
As pointed in Section 2, we believe that our method can be applied as an attack against link privacy in social networks. Determining to which extent our approach can be combined with existing attacks to improve the predictive power of publicly available attributes is worth future research.
In this work, we have adapted the graph-theoretic algorithms in [15] to probabilistic graphs. Potamias et al. [18] introduces different measures of distances in probabilistic graphs and present algorithms to com-pute k-nearest neighbor queries. We believe that prob-abilistic graphs are a powerful tool and designing algo-rithms to extract their characteristics can create new approaches also to other research problems.
References
[1] L. Adamic and E. Adar. Friends and neighbors on the web. Soc. Networks, 25(3), 2003.
[2] L. Backstrom, C. Dwork, and J. Kleinberg. Where-fore art thou r3579x?: anonymized social networks, hidden patterns, and structural steganography. In
Proc. of the Sixteenth Int. Conf. on World Wide Web (WWW’07), pages 181–190, 2007.
[3] J. Baumes, M. Goldberg, M. Hayvanovych, M. Magdon-Ismail, W. Wallace, and M. Zaki. Finding hidden group structure in a stream of com-munications. In Proc. of the IEEE Int. Conf. on
In-telligence and Security Informatics, (ISI’06), pages
201–212, 2006.
[4] M. Cha, A. Mislove, and K. Gummadi. A measurement-driven analysis of information prop-agation in the Flickr social network. In Proc.
of the Eighteenth Int. Conf. on World Wide Web (WWW’09), pages 721–730, 2009.
[5] R. Chellappa and A. Jain. Markov random fields: theory and application. Boston Academic Press, 1993.
[6] A. Clauset, C. Moore, and M. Newman. Hierarchi-cal structure and the prediction of missing links in networks. Nature, 453:98–101, 2008.
[7] P. Domingos and M. Richardson. Mining the net-work value of customers. In Proc. of the Seventh
ACM SIGKDD Int. Conf. on Knowledge Discovery and Data Mining (KDD’01), pages 57–66, 2001.
[8] P. Domingos and M. Richardson. Markov Logic: A unifying framework for statistical relational learn-ing. In Proc. of the ICML’04 Workshop on
Sta-tistical Relational Learning and its Connections to Other Fields, pages 49–54, 2004.
[9] N. Eagle and A. Pentland. Reality mining: Sensing complex social systems. Personal and Ubiquitous
Computing, 10(4):255–268, 2006.
[10] D. Fogaras, B. R´acz, K. Csalog´any, and T. Sarl´os. Towards scaling fully personalized pagerank: Al-gorithms, lower bounds, and experiments. Journal
of Internet Mathematics, 2(3):333–358, 2005.
[11] J. Gao and P.-N. Tan. Converting output scores from outlier detection algorithms into probability estimates. In Proc. of the Sixth IEEE Int. Conf.
on Data Mining (ICDM’06), pages 212–221, 2006.
[12] L. Getoor, N. Friedman, D. Koller, and B. Taskar. Learning probabilistic models of link structure.
Machine Learning, 3:679–707, 2003.
[13] M. Hay, G. Miklau, D. Jensen, D. F. Towsley, and P. Weis. Resisting structural re-identification in anonymized social networks. PVLDB, 1(1):102–
114, 2008.
[14] D. Kempe, J. M. Kleinberg, and ´E. Tardos. Maxi-mizing the spread of influence through a social net-work. In Proc. of the Ninth ACM SIGKDD Int.
Conf. on Knowledge Discovery and Data Mining (KDD’03), pages 137–146, 2003.
[15] D. Liben-Nowell and J. Kleinberg. The link-prediction problem for social networks. Journal of
the American Society for Information Science and Technology, 58(7):1019–1031, 2007.
[16] A. Narayanan and V. Shmatikov. De-anonymizing social networks. In Proc. of the Thirtieth IEEE
Symp. on Security and Privacy, pages 173–187,
2009.
[17] J. O’Madadhain, J. Hutchins, and P. Smyth. Pre-diction and ranking algorithms for event-based net-work data. ACM SIGKDD Exploration Newsletter, 7(2):23–30, 2005.
[18] M. Potamias, F. Bonchi, A. Gionis, and G. Kollios. k-nearest neighbors in uncertain graphs. In Proc.
of the VLDB, the Thirty-Sixth Int. Conf. on Very Large Databases (PVLDB 2010), volume 3, 2010.
[19] F. J. Provost, T. Fawcett, and R. Kohavi. The case against accuracy estimation for comparing in-duction algorithms. In Proceedings of the Fifteenth
Int. Conf. on Machine Learning (ICML’98), pages
445–453, 1998.
[20] A. Singla and I. Weber. Camera brand congruence in the Flickr social graph. In Proc. of the Second
ACM Int. Conf. on Web Search and Data Mining (WSDM’09), pages 252–261, 2009.
[21] B. Taskar, M. Wong, P. Abbeel, and D. Koller. Link prediction in relational data. In Neural
Infor-mation Processing Systems, volume 15, 2003.
[22] W. Van Der Aalst, H. Reijers, and M. Song. Dis-covering social networks from event logs. Computer
Supported Cooperative Work, 14(6):549–593, 2005.
[23] B. Zadrozny and C. Elkan. Obtaining calibrated probability estimates from decision trees and naive bayesian classifiers. In Proc. of the Eighteenth Int.
Conf. on Machine Learning (ICML’01), pages 609–
616, 2001.
[24] B. Zadrozny and C. Elkan. Transforming classi-fier scores into accurate multiclass probability esti-mates. In Proc. of the Eighth ACM SIGKDD Int.
Conf. on Knowledge Discovery and Data Mining (KDD’02), pages 694–699, 2002.
[25] J. Zhang and Y. Yang. Probabilistic score estima-tion with piecewise logistic regression. In Proc. of
the Twenty-first Int. Conf. on Machine Learning (ICML’04), page 115, 2004.
[26] E. Zheleva and L. Getoor. To join or not to join: the illusion of privacy in social networks with mixed public and private user profiles. In Proc.
of the Eighteenth Int. Conf. on World Wide Web (WWW’09), pages 531–540, 2009.