HAL Id: tel-01086711
https://pastel.archives-ouvertes.fr/tel-01086711
Submitted on 24 Nov 2014HAL is a multi-disciplinary open access
archive for the deposit and dissemination of sci-entific research documents, whether they are pub-lished or not. The documents may come from
L’archive ouverte pluridisciplinaire HAL, est destinée au dépôt et à la diffusion de documents scientifiques de niveau recherche, publiés ou non, émanant des établissements d’enseignement et de
study of the multivalent carbohydrate/protein
interactions on silicon biosensors
Jie Yang
To cite this version:
Jie Yang. study of the multivalent carbohydrate/protein interactions on silicon biosensors. Chemical Sciences. Ecole polytechnique X, 2014. English. �tel-01086711�
Ecole Polytechnique
Laboratoire de Physique de la Matière Condensée
Thèse en vue de l’obtention du diplôme de
DOCTEUR DE l’ECOLE POLYTECHNIQUE
Spécialité: sciences des matériaux
Par Jie YANG
Sujet
Etude des interactions multivalentes carbohydrate/protéine sur
des biocapteurs de silicium
Soutenance le 23/09/2014 devant le jury composé de:
Dr. Anne IMBERTY Présidente du jury
Dr. Bruno FABRE Rapporteur
Dr. Yoann ROUPIOZ Rapporteur
Dr. François OZANAM Examinateur
Dr. Aloysius SIRIWARDENA Examinateur
Dr. Anne chantal GOUGET-LAEMMEL Directrice de thèse
Acknowledgement
This work was performed in the Laboratoire de Physique de la Matière condensée of Ecole Polytechnique since October 2011. First of all, I would like to thank Ecole Polytechnique to offer me the EDX grant for the three years financial support.
I gratefully thank the members of the jury for evaluating my thesis. Firstly, I shall thank Dr. Anne Imberty from CERMAV/Grenoble, for accepting to preside over my defense. Moreover, I thank Dr. Bruno Fabre from Université de Rennes 1 and Dr. Yoann Roupioz from CEA/Grenoble to judge my thesis as reporters. It was a quite precious experience to discuss with them on my work from different disciplinary perspectives.
I am grateful for Dr. Aloysius Siriwardena, a sharp and humorous glycobiologist who acts as an examinator for my thesis. I appreciate quite for his guidance to synthesize the glycan precursors, for attending our routine discussions, for presenting me the frontier of glycomics and proteomics, and for his help in the correction of our papers. It is because of him that I fall in love with the glycobiology.
I wish to thank Dr. Francois Ozanam, the director of PMC, for paying great carefulness to correct my thesis. I was so impressed by his wisdom and profound knowledge on silicon physics and chemistry. Each time when I encountered the bottleneck in my experiment, I realized that I could solve the problems through a short talk with him because he can always provide me key answers and useful suggestions to overcome the difficulties. He is absolutely indispensable for the fruitful results of my work.
I feel highly indebted to my co-supervisor, Prof. Sabine Szunerits, who was also the director of my master thesis. I shall firstly thank her for recommending me to PMC for this PhD thesis. She is one of the most intelligent, generous and knowledgeable professors that I have ever met. It is her that opens a new insight for me to the biointerface chemistry and triggers my love with the LSPR world. Her fast-thinking personality and charming character are important to help me complete the thesis. At the meantime, I am also indebted to Dr. Rabah Boukerroub for devoting considerable time and efforts into the comments of my work and our papers. My deepest gratitude goes here and foremost to my supervisor, Dr. Anne-Chantal Gouget, for her proposals about this interesting interdisciplinary thesis, as well as the instructive advices and helpful guidance over the three years. I shall thank her for providing me all the available resources and largest convenience to complete my work. During the practical work, I suffered often from those biochemical problems that were hard to explain because these questions seemed to be out of our expertise. Moreover, this work also made me to do a lot of tedious repeating experiments to pursue a reliable result. But she offered me complete confidence and often a warm-hearted “I trust you” to encourage me to bravely try my own ideas. We have in fact bypassed the normal relationship of supervisor-student, but we are close friends that talk and discuss almost every day. Working with her is one of the greatest pleasures in my life. I am so impressed by her humour and enthusiasm for every good result. I shall also thank her for spending a long time and great carefulness to correct my thesis and speeches, from the text structure to language expression, and even to each word, spelling, and marks. I feel deeply proud of being her first PhD student after she passed the HDR.
High tribute shall be paid to the members of my group “Electrochimie et Couches Minces”, notably Jean-Noël Chazalviel for making the miraculous numerical simulation which helped to well explain my experimental results. I shall thank Anne Moraillon for tutoring me to manipulate spotting and fluorescence imaging. I shall thank Catherine Henry de Villeneuve for the time-consuming experiment on tapping mode AFM imaging and her patient explanations to my questions. I shall thank Fouad Maroun and Philippe Allongue for occasional discussions. I shall also thank the PhD students in our group, Timothy Aschl, Nan Di, Marine Brunet. I enjoyed every moment to discuss with them about the scientific topics. Lastly, I would express my heartful gratitude to the administrative members of the lab, especially Anne-Marie Dujardin for her help to deal with all those administrative affairs, Patrice Delaroque for daily “salutations”, Denis Coupvent-Desgraviers for the talks about Chinese culture, Elodie Quillard for the daily chatting in the last year where we found numerous common interests to get rid of our tiredness. I also want to give my best thanks to all other permanent members of the lab. It is a great pleasure to work and stay with all of them for the three years. I shall also express my last thanks for the PhD students and Post-docs, with whom I feel always happy for each entertainment moment: Lucie, Long, Daniel, Lili, Nicolas, Duc, Maxime, Maria, Manon, Fabian, Quantin, Dapajyoti, Supriyo, Alexander…
Contents
General introduction ... - 7 -
Chapter 1: State of the art ... - 11 -
1.1 Functionalization of hydrogenated-silicon surfaces ... - 12 -
1.2 Antifouling surface ... - 19 -
1.3 Binding isotherm analysis of protein assay ... - 21 -
1.4 Metal-enhanced fluorescence ... - 25 -
Chapter 2: Build-up of glycosylated monolayers on crystalline silicon surfaces ... - 29 -
2.1 Introduction ... - 30 -
2.2 Formation of azide-terminated surfaces ... - 33 -
2.3 Formation of glycosylated surface ... - 43 -
2.4 Conclusion ... - 57 -
2.5 Experimental section ... - 58 -
Chapter 3: Interaction of glycosylated surfaces with proteins ... - 63 -
3.1 Introduction ... - 64 -
3.2 Effects of OEG length and rinse on the (non)specific binding ... - 67 -
3.3 Binding efficiency with the surface glycan density ... - 76 -
3.4 Reusability of the glycosylated surfaces ... - 88 -
3.5 Conclusion ... - 90 -
3.6 Experimental section ... - 91 -
Chapter 4: Quantification of proteins on crystalline silicon (111) surfaces by infrared spectroscopy ... - 93 -
4.1 Introduction ... - 94 -
4.2 IR calibration experiment of protein ... - 95 -
4.3 Quantification of lectins on glycosylated surfaces ... - 103 -
4.4 Conclusion ... - 110 -
4.5 Experimental section ... - 111 -
Chapter 5: Metal-enhanced fluorescence microarrays for glycan-protein detection ... - 113 -
5.1 Introduction ... - 114 -
5.2 Utilization of a-Si1-xCx:H thin films on silicon substrate: IR-ATR study ... - 116 -
5.3 Utilization of a-Si1-xCx:H thin films on glass slide: MEF effect ... - 119 -
5.4 Application of the microarrays in protein assay ... - 133 -
5.5 Conclusion ... - 136 -
5.6 Experimental section ... - 137 -
List of abbreviations ... - 143 -
ANNEX ... - 145 -
I. Atomic force microscopy ... - 145 -
II. Attenuated Total Reflection Fourier Transform Infrared spectroscopy and the quantification of surface molecules ... - 147 -
III. X-ray photoelectron spectroscopy ... - 152 -
IV. Spotter and fluorescence imaging ... - 152 -
V. Plasma-enhanced chemical vapor deposition ... - 154 -
GENERAL INTRODUCTION
General introduction
Specific protein-carbohydrate (also termed as “glycan” in biochemistry) interactions are important for numerous physiological processes, including cell growth and development, autoimmunity and fertilization, or pathological processes like bacterial and viral infection, inflammation and cancer metastasis.1-3 These interactions occur between specific glycan epitopes such as typically found in complex glycoproteins, glycolipids or proteoglycans usually present on cell surfaces, and various proteins including antibodies, enzymes and lectins, which bind to them selectively (Fig 1a).4, 5 For example, the mannose-binding lectin present on the liver cells recognizes the glycans on the surfaces of many pathogens such as human immunodeficiency virus (HIV) and hepatitis C virus (HCV) as a response to infection. The understanding of protein-glycan interactions is therefore of high importance for the development of new vaccines or therapeutic innovations.
Indeed, with more than half of the human proteins being glycan-conjugated, the use of surface bioanalytical tools that are capable of probing the protein-glycan interactions is undoubtfully one of the main driving forces to prompt the advance of glycoproteomics, as they have witnessed the flourishing development of genomics (DNA-DNA interaction) and proteomics (protein-protein interaction) over the past 20 years. However, the study of protein-glycan interactions has been lagged well behind for several difficulties. First, carbohydrates can be very difficult to obtain in large quantities and/or in homogeneous form due to the structural complexity and diversity. Second, the interaction of individual glycan epitopes with their protein receptor usually displays only low affinity (millimolar to micromolar range). So in nature, high-affinity and selective recognition between lectins and their glycan partners is achieved by multivalent interactions, which is usually observed when multiple copies of a particular glycan interact in concert with its protein counterpart itself featuring two or more glycan recognition sites.3 Formation of these multivalent complexes, in turn, depends on appropriate spacing and orientation of glycan ligands present on the surface, imposing a stringent requirement for surface modifications (Fig 1b).
With the advance of new synthetic routes of carbohydrates, several surface techniques are currently employed for evaluating protein-carbohydrate interactions, including surface plasmon resonance (SPR)6-12, microgravimetry13-18 and other electrochemical approaches19-23. Compared with them, microarray technique is also one of the hotly pursued tools as it provides high-throughput screening and parallel processing while using only miniscule amounts of probe molecules.24 The glycan microarrays, displaying numerous synthetic oligosaccharides and/or polysaccharides on a sensing surface in a spatially defined arrangement, ensure the sensitive and accurate mapping of many protein-glycan interactions at the same time via coupling with other approaches25, such as SPR imaging26, 27 and fluorescence.28-32 Moreover, the glycan microarray reflects actually the cellular features of living organisms and promises to allow a more detailed understanding of the molecular basis of protein-glycan binding events.33
GENERAL INTRODUCTION
Figure 1 (a) Interaction of proteins or living organisms with glycan-terminated glycoproteins and glycolipids on cell surface; (b) dependence of high avidity multivalent binding on optimal spacing and orientation of glycan ligands.34
Although glycan microarray technology has become a key tool to help glycobiologists for diagnostics, many challenges remain. On the contrary to DNA sensors, the density and spacing of glycan ligands presented at the interfaces is highly crucial to favor the multivalent interactions, so it is challenging to control the immobilization of glycan probes in a controlled and quantitative way. Moreover, the protein approaching at interfaces tends to be adsorbed non-specifically, leading to the loss of its biological activity and the deteriorated selectivity of the microarray. Therefore, special attention has to be paid to limit the non-specific adsorption. Lastly, the constant demand for a higher sensitivity or lower detection limit triggers more advanced detection methods being coupled with the design of the protein chips.35
GENERAL INTRODUCTION
methods, physisorption approaches are generally convenient but, in the case of small sugars, suffer from limitations due to the weakness of the van der Waals interaction forces with the surface.36, 37 Self-assembled monolayers (SAMs) of thiol-functionalized carbohydrates are often used since their interactions with proteins can be followed in situ and in real time by SPR.28, 38-41 Alternatively, the pyrrole-derivatized oligosaccharides can be used to link glycans to SPR subtrates through electrochemical copolymerization.6, 26 The above methods require the preparation of carbohydrate derivative precursors. Other schemes were also reported without prerequisite derivatization of carbohydrates using perfluorophenyl azide-modified surfaces which allows the non-selective photochemical attachment of carbohydrates via C-H bond.27, 42-44 In addition, hydrazide or aminoxyl-terminated surfaces are also capable of linking carbohydrates at the anomeric center.22, 45, 46
From the viewpoint of substrate considerations, silicon-based substrates such as porous, crystalline or amorphous silicon could be a good choice since they offer excellent optical or electrical advantages that make them attractive for the bulk manufacturing of microelectronics and sensors. The dominant strategy for functionalizing silicon surfaces is based on the common siloxane chemistries on easily-prepared Si/SiO2 surface.22, 45, 46 However, the moisture sensitivity of silanization, instability of bound silanes and low surface coverage limit its exploitation for sensing.47, 48 A more stable silicon functionalization strategy relies on the formation of organic monolayer through robust Si-C covalent bonds, obtained by the modification of hydrogen-terminated silicon surfaces via hydrosilylation chemistry using functional 1-alkenes.49-54 Besides, the hydrogenated silicon and the subsequent functionalized monolayer is also of high interest to be followed by many well-established techniques, like infrared spectroscopy in attenuated total reflection geometry (IR-ATR), atomic force microscopy (AFM), X-ray photoelectron spectroscopy (XPS), cyclic voltammetry (CV), etc. There are two common ways of grafting glycan molecules on hydrogen-terminated silicon surfaces. It has been reported the direct chemical attachment of glycan molecules via the hydrosilylation of 1-alkene functionalized glycan precursors.55, 56 On the other hand, Cai et al. reported a step-by-step functionalization strategy on hydrogenated silicon surfaces. The main advantage of the latter method is that the density and self-assembly of the organic monolayer can be established in a well-defined manner under mild chemical conditions. Therefore, such a method is more favored for the elaboration of glycan sensors.
In the laboratory PMC, the group “Electrochimie et couches minces” has studied the organic monolayer on hydrogenated silicon surfaces for more than 15 years.57-62 Notably, A. Faucheux et al. studied the hydrosilylation of 1-alkene type precursors on hydrogenated crystalline silicon surfaces via photochemical or thermal activation.63 For instance, via the hydrosilylation of undecylenic acid, a fairly dense carboxylic acid-terminated monolayer can be formed, which allows the further attachment of biomolecules through simple amidation strategy.64
With this well-optimized functionalization method, L. Touahir completed a revolutionary work during his thesis where he took advantage of the optical property of amorphous silicon-carbon (denoted as a-Si1-xCx:H) thin film coated on metal surfaces, onto which a new architecture of DNA microarray was built up.65-72 The a-Si1-xCx:H thin film was treated analogously to generate hydrogenated silicon bonds for the grafting of carboxylic
acid-GENERAL INTRODUCTION
terminated monolayer. Starting from this surface, the immobilization of oligonucleotide strand was performed via an easy amidation reaction by spotting approach. The most striking property of this new conception of DNA microarray is that numerous optical approaches could be coupled, such as metal-enhanced fluorescence (MEF)68-70, localized surface plasmon resonance (LSPR)72 and SPR67, 71, leading to a signal readout with ultrahigh sensitivity (~a detection limit of femtomolar for LSPR-enhanced fluorescence)68, good reproduciblity and possibly in real-time.
Motivated by these acquired resources, my thesis aimed ultimately at the development of a-Si1-xCx:H thin film based glycan microarray for the detection of specific lectins using MEF. Prior to this aim, effort was devoted to the following points: first, the control of the chemistry of immobilizing glycans; Second, the optimization of the surface glycans in terms of density and spacing to favor the multivalent binding; third, the minimization of non-specific adsorption; last, the improvement of the detection sensibility. To illustrate clearly this work, the thesis is deployed in five chapters.
The first chapter is dedicated to the introduction of some principles and theoretical concepts: functionalization of hydrogen-terminated silicon surfaces; surface antifouling property; binding analysis methodologies and metal-enhanced fluorescence.
The second chapter is devoted to the build-up of the glycosylated architecture on crystalline silicon (111) surface. We used a step-by-step modification process which was followed and analyzed by different techniques, including quantitative IR-ATR, AFM and XPS. These techniques offered a general view of “how many” molecules are immobilized and how the organic monolayer looks like.
The third chapter describes the interactions of these fabricated glycan-surfaces with specific and non-specific lectins. Efforts were made to limit the non-specific adsorptions whereas for specific bindings, the relationship of the glycan ligand density with the binding efficiency of lectins was studied and the binding affinity was measured.
The forth chapter takes advantage of quantitative IR-ATR to determine the density of protein bound to glycosylated surfaces. The quantitative result was correlated with AFM results, thus had allowed establishing reliable models to interpret the multivalent interaction of glycan with its specific lectin.
The last chapter is dedicated to the elaboration of the glycan microarrays on a-Si1-xCx:H thin film coated on metal nanostructures for the detection of specific lectins by LSPR-enhanced fluorescence. This part of work concerns notably how the new conception of glycan microarrays was engineered to obtain good selectivity and high sensitivity.
This work was completed in collaboration with Prof. Sabine Szunertis from the IRI institute of the University of Lille1 for the preparation of LSPR substrate and Dr. Aloysius Siriwardena from the University of Jules-Verne for the synthesis of glycan derivatives.
CHAPTER
1
State of the art
CHAPTER 1
1.1 Functionalization of hydrogenated-silicon surfaces
1.1.1 Choice of substrate
Silicon is one of the most “famous” substrates used in microelectronics and (bio)sensors. There are different forms of silicon that can be chosen as material substrate, such as porous, crystalline silicon and amorphous silicon thin films, ... In this thesis, we used two types of silicon: crystalline and amorphous silicon. The functionalization of silicon for the immobilization of glycans was established on crystalline silicon because it allows perfectly controlled chemistry and is appealing to be characterized by quantitative IR-ATR, AFM and XPS techniques. While for the elaboration of glycan microarrays using fluorescence as the measurement technique, thin films of amorphous silicon-carbon alloy were employed. When deposited on a glass substrate, they offer a more favorable optical configuration than bulk silicon.
Crystalline silicon exhibits an ordered arrangement of Si atoms. The crystallographic (111) face is generally used for a well-controlled surface functionalization as it allows the formation of smooth hydrogenated surface at atomic level, making it a model system for AFM studies (Fig 1.1).
Figure 1.1 (a) Cubic lattice of crystalline silicon with the (111) face represented in red; (b) formation of atomically hydrogenated smooth (111) face upon etching in NH4F. Si: blue; H: white.73
Compared with crystalline silicon, amorphous silicon (a-Si) presents a disordered structure at large scale (Fig 1.2b). Due to the distortion of the a-Si structure, a great number of silicon
STATE OF THE ART
can be passivated by hydrogen leading to the formation of hydrogenated amorphous silicon (a-Si:H).
Figure 1.2 Schematic representation of the structure of crystalline silicon (a) and hydrogenated amorphous silicon (b).
The optical property of a-Si:H can be further changed by adding carbon into the random network to form amorphous silicon-carbon alloy (a-Si1-xCx:H). The smaller radius of carbon atom increases the band gap of a-Si1-xCx:H compared with a-Si:H, leading to a reduced refractive index. Fig 1.3 shows the real and imaginary parts of the refractive index of a-Si1-xCx:H as a function of carbon content. As the carbon content is increased, the refractive index decreases. The a-Si1-xCx:H can be deposited on any type of materials as thin films in a controlled manner notably by plasma-enhanced chemical vapor deposition (PECVD) at low power.
Figure 1.3 Diagram of the real (black) and imaginary (red) parts of the refractive index of a-Si1-xCx:H measured at 670 nm, as a function of carbon content.
CHAPTER 1
In the laboratory PMC, Solomon et al. studied the relationship between the methane content in gas phase and the resulting carbon content in the deposited film.74 By controlling the growth speed of the film and the methane/silane ratio, the a-Si1-xCx:H thin film with the desired carbon content and thickness can be obtained.
1.1.2 Hydrogenated silicon surface
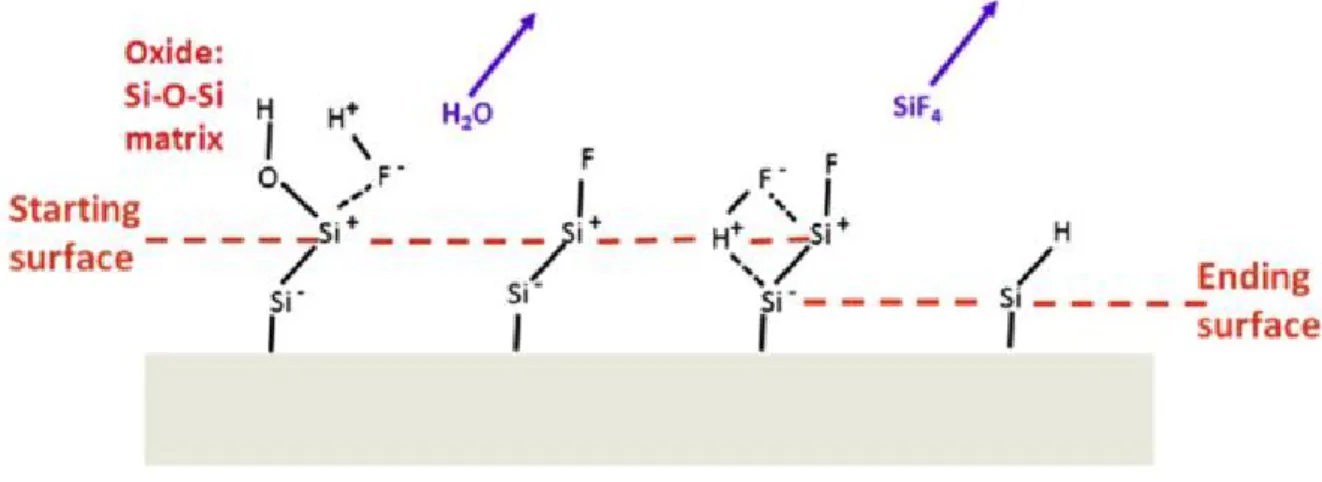
From the end of 1960s, we have known that the silicon can be passivated by a treatment in hydrogen fluoride (HF) with the formation of Si-H bonding.75 In the beginning of 1980s, the the formation of hydrogen-terminated silicon was studied by Ubara et al.,76 Higashi and Y. Chabal et al.77-83 They demonstrated that the highly polarized Si-F bond is formed after the dissolution of interfacial oxide, which then induces the polarization of Siδ--Siδ+-F back bond. In the subsequent attack of HF, the Siδ--Siδ+ bond is cleaved. As a consequence, the first layer of Si is fluorinated and removed, leaving the underlying Si layer being hydrogenated (Fig 1.4).
Figure 1.4 Mechanism leading to the formation of H-terminated Si surface by HF etching.54
The hydrogenated silicon surfaces are easily prepared and relatively stable in air, which makes them particularly interesting for the use in (bio)sensors. The homogeneity of the formed H-terminations and the surface microstructure are highly dependent on pH of the fluoride solution.79 The etching in acidic condition (i.e., HF solution) results in the formation of a rough surface containing monohydride, dihydride and trihydride (denoted as SiHx),82, 84 whereas solely monohydride (SiH) is formed in basic condition (i.e., NH4F solution).78, 80 On Si (111) surfaces these monohydride bonds are ideally ordered and normal to the surface (Fig
STATE OF THE ART
In 1995, Allongue et al. demonstrated the coexistence of two dissolution pathways of silicon in NH4F solution: a chemical way and an electrochemical way (Fig 1.5).85 Both routes lead to the substitution of Si-H bond by Si-OH bond. The chemical route occurs preferentially at step atoms while the electrochemical path is much less site dependent. This model states that molecular water is the oxidizing agent and the F− species are thought to be catalysts of the reaction, helping in solubilizing the Si atoms. He also pointed out that the solution should be basic (pH=8-9) and oxygen-free solution are important to favor the formation of flat surface without surface pitting.86,87
Figure 1.5 Molecular model focusing on the initial step of Si dissolution from a kink site including an electrochemical (bottom) and a chemical (top) route.85
For AFM studies, we chose a one-side polished silicon (111) wafer with a miscut of 0.2° toward the (112) direction. Upon a controlled etching in NH4F, the staircase structure can be formed with each terrace exhibiting a flatness at the atomic level (Fig 1.6). For IR studies, we chose a double side polished silicon (111) prism to prepare SiHx or SiH surfaces. The SiHx surface was mainly studied because the resultant rough microstructure is similar to that on a-Si1-xCx:H thin films.64 The etching of a-Si1-xCx:H thin films was performed in HF vapor.
Figure 1.6 Scheme of the formation of staircase structure upon a controlled etching in NH4F. The surface is Si(111) with a miscut of 0.2° toward the (112) direction.
CHAPTER 1
1.1.3 Hydrosilylation reaction
At the beginning of 1990s, Linford et al. proposed the first grafting of organic species on a hydrogenated silicon surface using a hydrosilylation reaction to form an alkyl monolayer attached on the surface via Si-C bonds. The raction was initiated by the presence of diacyl peroxides.88 Later on, other reaction routes were discovered notably for unsaturated alkyl compounds via thermal,89, 90 Lewis acid-catalyzed,50, 91-94 or photochemical activation.95-100 The hydrosilylation consists of the insertion of the unsaturated double or triple bond into the Si-H bond. The utilization of photochemical activation, such as UV or Vis irradiation, is advantageous since it is relatively mild (at room temperature), fast (a few hours) and leads to an appreaciable yield. The UV-activated hydrosilylation is supposed to obey a radical-initiated mechanism (Fig 1.7), where the silicon dangling bond is generated upon UV irradiation which reacts with the C=C double bond to form the Si-C bonding.52 The radical present on the alkyl chain is able to abstract a neighbouring H to terminate itself.95, 101 Zuilhof et al. proposed successively an electron/hole pair mechanism to account for the hydrosilylation activated by visible light,99, 100, 102 similar to the exciton-mediated mechanism occuring on porous silicon proposed by Stewart et al.98 Moreover, Hamers et al. also proposed a photoemission pathway for UV-initiated grafting of alkenes on H-terminated silicon surfaces.103
Figure 1.7 Scheme of the chain propagation mechanism for 1-alkenes reacting with Si(111) silyl radical.52
The hydrosilylation of ω-functionalized 1-alkene precursors on hydrogenated silicon surfaces is important and interesting for further functionalization strategies (Fig 1.8).51, 53, 104 One of the most important functionalized monolayers is the carboxydecyl-terminated monolayer, which is often used as the starting surface for multi-step functionalization allowing covalent attachment of (bio)molecules.105, 106
STATE OF THE ART
Such a monolayer can be easily obtained by the direct photochemical grafting of undecylenic acid on the hydrogenated Si(111) surfaces, as demonstrated by Faucheux et al. in the laboratory PMC.63 It was proved that there was no side reaction between the carboxyl group and Si surface and the reaction process was oxide-free. Moreover, the Si/molecular layer presents excellent electronic properties (such as a low density of state). It is also important to rinse the reacted surfaces in hot acetic acid to remove the physisorbed unreacted undecylenic acid molecules. In addition, the density of the monolayer was quantifiable by IR-ATR, confirming the formation of a fairly dense monolayer was anticipated.
1.1.4 Amidation reaction
The carboxylic acid-terminated surface is interesting to be further functionalized through a variety of coupling strategies, typically, the esterification and amidation reactions by reacting with alcohols and amines. The esterification is an equilibrium reaction that suffers seriously from hydrolysis, whereas the amidation produces stable amide bonds. However, the direct amidation is usually achieved by condensation of acid-amine salt at high temperature which limits its application in biosynthesis.107, 108 Therefore the amidation of biomolecules under mild chemical conditions was developped using peptide coupling reagents, like carbodiimide, aminium or phosphonium salts of benzotriazole derivatives, ….109 The amidation reaction undergoes an intermediate activation step where the carboxyl moiety is transferred to a good leaving group, which is subsequently aminolyzed by the amine-derivatized (bio)molecules. One of the mostly employed coupling strategies to obtain activated surfaces is to use ethyl(dimethylaminopropyl) carbodiimide (EDC) in the presence of N-hydroxysuccinimide (NHS) (Fig 1.9). The advantage of this strategy for linking biomolecules lies in its low cost, non-toxicity, water solubility and the self-hydrolysis in water which does not need additional purification. The use of NHS is to form a quite stable intermediate NHS-ester in order to improve the final amidation yield. In this reaction, the –OH of carboxylic acid is added on the imide bond of EDC to form the unstable O-acyl urea which is subsequently replaced by NHS to form stable “active” NHS-ester.
CHAPTER 1
Figure 1.9 Scheme describing the activation reaction on carboxyl-terminated porous silicon surfaces. Initially, the surface acid groups react with EDC resulting in the formation of O-acyl urea (1). Subsequently, various paths are available with the formation of succinimidyl ester (2), anhydride (3), N-acyl urea (4). 4 is side reaction, yielding an unwanted byproduct.110
In the laboratory PMC, S. Sam and L. Touahir et al. have previously studied the activation step by working with porous or crystalline silicon surfaces. They demonstrated that the use of equivalent amount of EDC and NHS (5-10 mM) at 15℃ is important to avoid uncompleted or side reactions and obtain good ester-NHS terminated monolayers.42, 43
The successive aminolysis takes place on the ester-NHS terminations which is substituted by the amino molecules.
STATE OF THE ART
1.2 Antifouling surface
The elimination of non-specific protein adsorption is a challenge for the fabrication of protein sensors. To discuss an adsorption behavior occurring at solution/interface, one should consider the property of three partners: protein, surface and solution.111 These factors influence comprehensively the protein adsorption. The protein property includes, i.e., pI, polarity, hydrophilicity, etc, the solution property includes, i.e., temperature, pH, ionic strength, etc and the surface property includes, i.e., surface charge, polarity and morphology, etc.112 For example, the pH of buffer affects the charge of the protein outer surface, thus alters its interaction with the charged surface.113
A surface able to resist non-specific protein adsorption is called “antifouling” surface. In the field of material science, antifouling property can be achieved by modifying the surface with a protein-resistant biofilm, such as hydrophilic polymers (i.e., polysaccharide) and zwitterionic polymers.114-119 In general, a good antifouling surface structure is anticipated to be hydrophilic, containing groups of hydrogen-bond acceptors but not donors and overall electrically neutral.120 Among a variety of artificial antifouling structures, poly(ethylene glycol) (PEG) is one of the most often used molecules for its good water solubility, nontoxicity, non-immunogenicity and biocompatibility.
The mechanism of protein resistance and the role of PEG involved in the protein repellence have not yet been fully understood. Currently, there are two theories mostly accepted. One “physical” view relies on the excluded volume theory to explain the behavior of the PEG on the surface, stating that the available volume for each polymer segment is reduced when protein get close to the PEG-coupled surfaces, consequently a repulsive force is generated due to the loss of conformational entropy of the PEG chains.121, 122 Another “chemical” view focuses on the role of water bound around the PEG chains which readily forms a water matrix of high density to help buffering the protein attaching to the surface (Fig 1.10).123-127
Figure 1.10 Scheme for the hydration layer formed on hydrophilic and zwitterionic polymers serving to resist the protein adsorption.127
CHAPTER 1
The antifouling extent of the PEG monolayer is highly dependent on the length, conformation and density of the chains on the surface.128-132 Normally, a longer and a denser PEG monolayer is deemed to have better antifouling property. In the laboratory PMC, E. Perez studied the antifouling property of oligo/poly(ethylene glycol) monomethyl ether on hydrogenated silicon surfaces during his thesis.133 In one way, the molecule OEG carrying an hydroxyl group at one end and methoxyl group on the other end (abbreviated as H(EG)nOMe, n=3-16) was grafted directly on hydrogenated silicon surface through Si-O bond. The as-formed OEG monolayers were rather dense (2×1014 cm-2) and yielded excellent repellence towards bovine serum albumin (BSA), which is one of the most adhesive proteins on the surface. However, the polarized Si-O bond suffered from hydrolysis, leading to the reduced antifouling performance with time. In the other way, the OEG monolayers were built by the hydrosilylation of vinyl-terminated OEG precursors (abbreviated as CH2=CH-Cp-2(EG)n with the 3 < p < 11 and 3 < n < 16) on hydrogenated silicon surfaces. By playing with various p and n values of the alkyl and ethylene glycol units, it was able to achieve a powerful resistance to proteins when n is large enough (n > 12) and p is small enough. The density of these OEG monolayers was much lower (1×1014 cm-2) so that the good antifouling property was thought to arise a priori from the entanglement of OEG chains.134
STATE OF THE ART
1.3 Binding isotherm analysis of protein assay
Biointeractions can be always described as a formula like + ↔ , where R stands for receptor, L for ligand and RL for the formed complex. The ligand usually refers to small molecule whereas receptor refers to large molecule. In surface bioanalysis, the term “probe-target interaction” is also often used, where the “probe” refers to the molecule immobilized on the biosensor and the “target” refers to the molecule in the analyte. The binding affinity is an important parameter in biochemistry that measures the strength of the interaction. For example, the determination of the binding affinity is important in pharmacology to evaluate the efficacy of drugs to the target cells or proteins. The binding affinity can be described by the association constant (Ka) or its inverse the dissociation constant (Kd). For a particular binding issue studied by biosensors, the experimental data can be treated to obtain the isotherm curve for the calculation of the association constant. This curve plots the amount of adsorbed target molecules by the sensor as a function of their concentrations in analyte. Plenty of models were established to interpret the obtained binding curves.
1.3.1 Langmuir model
It is one of the mostly used models in biological experiments. Several assumptions are established:
The surface is perfectly homogeneous.
The protein is ideally immobile after being absorbed on the surface. All ligands are equivalent.
Monovalent interaction between protein and surface ligand. No interactions between protein molecules on adjacent sites For a surface binding event,
+ ↔ (R: protein receptor in solution; L: ligand site on surface) The association constant: = [ ]
×[ ] =
[ ]
×([ ] [ ])= ×( ) (θ is the surface
coverage; is the protein concentration in the analyte). Therefore, = or
In our experiment, = (A is the IR absorbance response for a given concentration of proteins and Am is the saturated maximum response).
CHAPTER 1
1.3.2 FFG model and Temkin model
The Langmuir model is far from the real binding conditions that limits its application in many experimental cases. For example, in the presence of cooperative interactions among the protein receptors or in case of multivalent interactions between receptors and ligands, the theoretical assumptions should be modified.
In the Langmuir equation, Ka characterizes the strength of binding which can be alternatively described by an adsorption energy , = ⊝exp (− ) . Assuming that there are intermolecular interactions among the protein receptors, the energy term has to take these interactions into account that = + , so the apparent association constant =
⊝exp (− ) = ⊝exp (− ) = ⊝exp (− − ) (making = ).
The Langmuir equation is thus modified,
= ↔ =
( ) = ( )
⊝ ( )
=
( ) ⊝ ( ) = ( ) ,
Ka still represents the adsorption constant of the binding and β measures the intermolecular interactions.135
In case of < 0, the intermolecular force is attractive, the model is called Frumkin-Fowler-Guggenheim (FFG) model.
In case of = 0, the intermolecular force is not present, the model is Langmuir model. In case of > 0, the intermolecular force is repulsive, the model is called Temkin model.
1.3.3 Freundlich model
Freundlich isotherm is an empirical phenomenon observed on the heterogeneous surface with different adsorption sites. Its equation is = . is an indicator of adsorption capacity, while 1/n is a function of the strength of adsorption in the adsorption process. If n = 1, the adsorption is linear with the concentration. If 1/n < 1, it indicates a normal adsorption. If 1/n > 1, it indicates a cooperative adsorption.136
STATE OF THE ART
Fig 1.11 resumes the shape of the above isotherm curves, where the Langmuir equation is united together with FFG and Temkin models.
Figure 1.11 Modeled curve shape for different isotherms: (a) Langmuir, FFG and Temkin models; (b) Freundlich model.
1.3.4 Scatchard plot
The Langmuir equation, = can be also expressed as = − . This equation can be fitted by plotting / as a function of θ, the y-intercept is , and the slope is − .
When the Langmuir model is not obeyed, the Scatchard plot is not a straight line. As shown in Fig. 1.12, a concave-up curve may indicate the presence of non-specific binding, negative cooperativity between receptors or multiple classes of binding sites with different Kd values, whereas a concave-down curve is indicative of positive cooperativity.141
CHAPTER 1
Figure 1.12 Modeled curve shape for linear and non-linear Scatchard plot.
Usually the choice of different models is difficult to predict for an unknown binding activity. One of the treatments is to look at the shape of the isotherm curve, such as the plots in Fig 1.11, and look for the presence of asymptote. The Langmuir, FFG and Temkin models show an y-asymptote as the concentration increases whereas the Freundlich model is not saturable. Then, in case of asymptote present binding curves, a steep “climbing rate” of concentration indicates the FFG model whereas a moderately increased curve may be indicative of Temkin model. In all cases, the application of these isothermal models relies on the experimental data. To make a correct conclusion, it is important to obtain as many data points as possible in a large concentration range and utilize as sensitive analysis methods as possible.
STATE OF THE ART
1.4 Metal-enhanced fluorescence
Fluorescence is one of the most common techniques used for biochips because of its versatility, ease of use and ultrahigh sensitivity. Many target biomolecules can be labeled with fluorophores like cyanine Cy3 (λexcitation = 550 nm, λemission = 570 nm) or Cy5 (λexcitation = 650 nm, λemission = 670 nm). One of current challenges of fluorescence technique lies in the constant demand for pursuing higher sensitivity to detect trace amount of analyte.
The fluorescence yield of a fluorophore located close to a substrate depends on the refractive index of the substrate and the distance between the fluorophore and the substrate. One method to improve the fluorescence yield is the use of metallic or multilayer dielectric mirror. The metal mirror can serve as an efficient reflector of both excitation and emission light, leading to an enhancement of fluorescence yield. Using this concept, a new architecture of DNA biochip was designed by Touahir et al. based on the a-Si1-xCx:H thin films which was deposited on aluminum mirror.70 The use of a-Si1-xCx:H thin films guarantees the formation of stable monolayers through covalent Si-C bond and provides a dense grafting yield of probe molecules. For instance, by the use of transparent a-Si0.8C0.2:H coating, the Cy5-labeled DNA was immobilized on the surface. Fig 1.13 represents the calculated fluorescence yield of Cy5 as a function of the thickness of the a-Si0.8C0.2:H coating on different metal mirrors. The fluorescence yield exhibits an interference pattern. By choosing a proper thickness of a-Si0.8C0.2:H (~40 nm), the fluorescence yield can be enhanced by a factor of ~15 in presence of aluminum mirror compared with the deposition of a-Si0.8C0.2:H on bare slide (film thickness of ~124 nm).
Figure 1.13 Calculation of the fluorescence enhancement factor as a function of the thickness of a-Si0.8C0.2:H coated substrates: glass (black); gold (pink); silver (blue); aluminum (gray).
CHAPTER 1
A second efficient method to enhance the fluorescence sensing is the use of noble metallic thin films or nanostructures. On a flat metallic surface, the free electrons on the metal surface can be excited upon the interaction with the incident light so that the so-called propagative surface plasmon resonance (SPR) is generated along the surface (Fig 1.14a). The noble metals are the mostly used as the SPR source, such as gold or silver, because their SPR can be induced by visible light. The SPR is obtained by using a proper optical geometry, like the Kretschmann configuration.
Figure 1.14 Schematic diagrams illustrating (a) a surface plasmon (or propagating plasmon) and (b) a localized surface plasmon.142
Whereas in the case of metallic nanostructures, upon the interaction with incident light, the free electrons exhibit collective oscillation of conducting electrons around the nanostructures and the so-called localized surface plasmon resonance (LSPR) is generated (Fig 1.14b). The LSPR is more easily obtained than SPR as it can be induced by simply a normal incident visible light, whereas exciting SPR requires a correct matching of the incident angle. The utilization of SPR or LSPR allows a direct detection of target molecules without labeling.67, 71, 72, 143-153
They also produces favorable fluorescence enhancement effect,68, 69 as a result of the enhanced electric field along the metal interface or surrounding the metallic nanoparticles. 154-157
Such an effect is called plasmon-enhanced fluorescence.
In the laboratory PMC, L. Touahir also studied the elaboration of plasmonic biosensors based on a-Si1-x Cx:H coated silver or gold films/nanoparticles.68, 69 In these designs, the choice of the carbon content and thickness of a-Si1-xCx:H thin films is important in order to reserve the optical property in terms of the SPR or LSPR sensitivity. In case of SPR-enhanced fluorescence, a multiple layered structure, a-Si0.8C0.2:H (3 nm)/ a-Si0.63C0.37:H (3 nm)/Ag (38 nm)/glass was established to favor the immobilization of DNA strand. It was found a limit of detection at 500 fM for the hybridization of the complementary strand.69
In the design of LSPR-enhanced fluorescence, the LSPR was obtained by a deposition of gold nanoparticles (AuNPs) on the glass slide, which was covered by a-Si1-xCx:H thin films. The LSPR property in terms of its intensity and position is affected by the refractive index of the
STATE OF THE ART
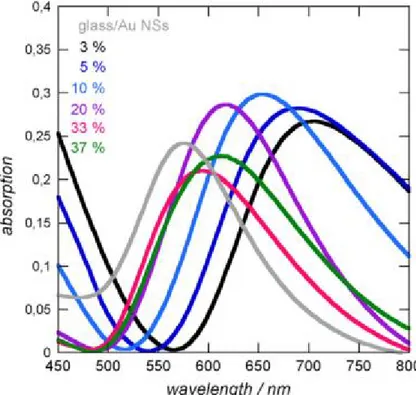
after the coating of a-Si1-xCx:H thin films. A lower doping of carbon in a-Si1-xCx:H leads to a higher red shift and larger width of LSPR.
Figure 1.15 UV–Vis absorption spectra in air of an uncoated glass/Au NPs interface (─) and after coating with a 20 nm thick film of a-Si0.97C0.03:H (─); a-Si0.95C0.05:H (─); a-Si0.90C0.10:H (─); a-Si0.80C0.20:H (─); a-Si0.67C0.33:H (─); a-Si0.63C0.37:H (─).72
In order to favor the LSPR-fluorescence coupling, the LSPR position should be located close to the excitation/emission wavelength of fluorophore.158-161 For Cy5, the best coupling of LSPR with fluorophore was found for a-Si0.8C0.2:H coating (λLSPR=614 nm).
More importantly, the level of LSPR-enhanced fluorescence depends on the distance between the fluorophore and the metallic nanostructures. When the fluorophore is located closer than ~ 5 nm from the nanostructured metal surface, the quenching is the dominant effect that vanishes significantly the fluorescence.162-164 At larger distances, the enhancement starts to override the quenching and the fluorescence reaches its maximum at about 10 nm from the metallic nanoparticles, a distance above which the enhancement effect progressively decreases.165 This AuNPs-fluorophore distance can be easily tuned by varying the thickness of amorphous coatings. Fig 1.16 shows the measured fluorescence intensity of Cy5-labeled oligonucleotide immobilized on a-Si0.8C0.2:H coated AuNPs.68 The optimum fluorescence appeared at a coating thickness of 5 nm. By considering the length of the oligonucleotide-terminated monolayer, the AuNPs-fluorophore distance was estimated around ~15 nm. Finally, such a LSPR-enhanced DNA sensor also displayed an ultrahigh sensitivity with a limit of detection at the femtomolar level.
CHAPTER 1
Figure 1.16 Experimental fluorescence intensity for different thickness of a-Si0.8C0.2:H coated on AuNPs-embedded slide. The data in blue was obtained on one slide with variable thicknesses and in pink on different slides.
In this thesis, we will adopt the conception of LSPR-enhanced fluorescence for the elaboration of glycan microarrays. It is important to optimize the fluorescence effect in terms of the LSPR position and AuNPs-fluorophore distance.
CHAPTER
2
Build-up of glycosylated monolayers on crystalline silicon
surfaces
CHAPTER 2
2.1 Introduction
This chapter describes the grafting of glycans starting from carboxydecyl-terminated monolayer on crystalline Si(111) surfaces. Such a build-up has to take into account the following points: for one, the incorporation of antifouling layer in order to minimize the non-specific protein adsorption; for another, the control of the immobilization of glycans with proper spacing and density on the surface in order to favor strong and selective binding with specific lectin partners.
The antifouling property can be simply realized by the amidation of an amino oligo(ethylene glycol) (OEG) linker on the carboxydecyl-terminated surface. There are many commercially available OEG molecules with different chain lengths and different terminations such as the amine, carboxy and azido functional groups, which could provide further conjugation with glycans. To anchor glycan derivatives, we decided to use the Cu(I)-catalyzed Huisgen 1,3-dipolar cycloaddition (“click” chemistry) between azide and alkyne functions leading to the formation of triazole.166, 167 This reaction is one of the most efficient conjugate method and is largely used as a surface modification strategy for the fabrication of glycan-terminated surfaces.17, 20, 168, 169
Two routes may be envisaged for the attachment of glycans via Cu(I)-catalyzed cycloaddition reaction (CuAAC): the first is to graft the propargyl-derivatized glycan on a pre-functionalized surface with azido groups; the second is to link the azido-derivatized glycan to an alkynyl-terminated monolayer. For the preparation of azido-terminated silicon surfaces, it is impossible to use the direct hydrosilylation of azido-functionalized 1-alkene because the azido group is likely to decompose via the formation of a highly reactive nitrene intermediate during photochemically- or thermally- activated hydrosilylation.168 Nevertheless, the required azide-functionalized surface can be formed in two steps where the hydrogenated silicon is initially reacted with bromo-terminated 1-alkene via hydrosilylation followed by a reaction with sodium azide.170 On the other hand, the direct binding of alkynyl-functionalized molecules to silicon via Si−C bonds has been reported by Gooding and co-workers.171, 172 They used commercially available 1, 8-nonadiyne to introduce alkynyl groups onto the silicon surface in a thermal hydrosilylation. Subsequent grafting of azide-terminated oligo(ethylene oxide) was achieved via Cu(I)-catalyzed click reaction with a modest yield of 42−51%.171, 172 Decreasing the density of the alkynyl chains by co-deposition with alkyl chains increased the yield of the click reaction to 90% but did not provide sufficient density of oligo(ethylene oxide) (OEO) chains on the silicon substrates to limit their nonspecific adsorption of proteins. This same issue was recently revisited by Cai and coworkers who linked trimethylgermanyl protected α, ω-alkenyne groups to silicon via a photochemical hydrosilylation strategy.168 Subsequent removal of the protection group and click reactions with azido-derivatized mannose proceeded in a single step in good yield (~71%). The resultant mannose-immobilized surface was well recognized by E.Coli carrying mannose-specific fimbriae.
BUILD-UP OF GLYCOSYLATED MONOLAYERS
Considering the advantages and disadvantages of these examples, we sketch up a multi-step functionalization protocol to build up a glycosylated silicon surface. Fig 2.1 depicts schematically the stepwise assembly of the glycan-modified silicon (111) substrates.
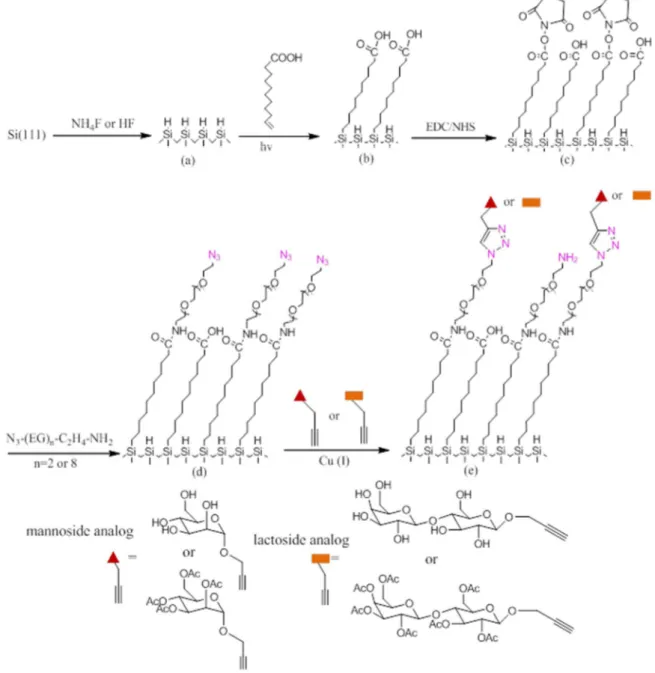
Figure 2.1 Multistep modification scheme to form the glycosylated crystalline silicon surface: (a) surface etching in HF or NH4F; (b) photochemical hydrosilylation of undecylenic acid; (c) activation in EDC/NHS with the formation of NHS-ester terminated monolayer; (d) aminolysis by OEG spacers bearing terminal azido moieties: H2N−C2H4-EG8−N3 (EG8) or H2N−C2H4-EG2−N3 (EG2); (e) “click” reaction with a propargyl-derivatized mannoside or lactoside.
CHAPTER 2
Firstly, the silicon wafer is etched in HF or NH4F solution to generate the hydrogen-terminated surface. Secondly, the carboxydecyl-hydrogen-terminated monolayer is obtained by photochemical hydrosilylation of undecylenic acid. Thirdly, the carboxylic acid-terminated surface is activated by EDC/NHS to form NHS-ester terminus. Fourthly, to introduce the OEG chain, we chose the commercial OEG molecule carrying an amine (−NH2) function at one terminus and an azido group (−N3) at the other end. The choice of using surface-linked N3 groups instead of the surface-linked alkynyl moieties is mainly due to the ease of characterization by IR and XPS of the azide function.173 We have selected two OEG molecules: NH2−C2H4−EG2−N3 (EG2) and NH2−C2H4−EG8−N3 (EG8), since the chain length of OEG molecule plays an important role in tuning the antifouling property.134 Lastly, the glycan-terminated surface is realized by the “click” reaction through the as-formed azide-terminated surface with derivatized glycans. Two glycans were chosen, alkynyl-mannoside and lactoside. The per-acetylated alkynyl-alkynyl-mannoside and lactoside were also used for quantitative IR measurements.
All the chemical modifications were carefully analyzed by quantitative IR-ATR and AFM imaging to have a perfect control of the grafting density and the cleanliness of the surfaces. In parallel, additional XPS analysis was performed, especially for the investigation of the “click” reaction.
BUILD-UP OF GLYCOSYLATED MONOLAYERS
2.2 Formation of azide-terminated surfaces
2.2.1 Hydrogenation
The first step is the etching of the oxidized Si/SiOx surface in hydrogen fluoride (HF) or ammonium fluoride (NH4F). Fig 2.2 shows the IR-ATR spectra of crystalline Si(111) surface etched in NH4F and HF solutions, the reference spectra being the oxidized surface. The negative bands at the range of 1000-1300 cm-1 characterize the stretching mode of Si-O-Si bond present on the Si surface prior to etching. For both polarizations, a sharp peak appearing at 1060 cm-1 is observed, corresponding to the transverse optical (TO) Si-O-Si vibration (Fig. 2.2a-d), whereas only p-polarization witnesses the corresponding longitudinal optical (LO) phonon vibration at 1240 cm-1 (Fig. 2.2b, d). The positive bands from 2000 to 2150 cm-1 indicate the formation of hydride Si-H bonds. The etching in HF solution (Fig. 2.2c, d) results in the formation of different types of silicon hydride: monohydride SiH ~2080 cm-1, dihydride SiH2~2102 cm-1 and trihydride SiH3 ~2132 cm-1.75 All of these hydrides (represented as SiHx) are visible in both polarizations, indicating that the hydrogenated surface is generally rough. However, the etching in NH4F solution (Fig. 2.2a, b) results in the sole formation of a sharp monohydride peak (noted as SiH) ~2080 cm-1 observed in p-polarization only, indicating that the monohydride bond is perpendicular to the (111) face where an atomically flat surface is formed.83
Figure 2.2 IR-ATR spectra in s- (red) and p- (black) polarization of SiH (a and b) and SiHx surfaces (c and d). The reference spectra are the oxidized silicon surface (SiOx). The inset is the enlarged νSiHx region of the spectra c and d.
CHAPTER 2
The AFM images shown in Fig. 2.3 reveal the formation of the ideally flat SiH surface. The staircase structure is created with a spacing corresponding to the miscut of 0.2° toward the (112) direction, where we can distinguish the height of each step around 3.1 Å, close to the calibrated monatomic distance (3.14 Å).174 The mean separation between two adjacent steps is ~100 nm. These images show that the preparation process allows obtaining surfaces of high quality without any apparent defect. In addition, the staircase structure is of particular interest to be used for monitoring the modifications taking place afterwards.
Figure 2.3 AFM images at 0.5×0.5 µm2 of SiH surface (a); tilted SiH surface with a step height of 0.31 nm (b). The underneath profile corresponds to the mark in the image.
BUILD-UP OF GLYCOSYLATED MONOLAYERS
2.2.2 Hydrosilylation reaction
The hydrogen-terminated surfaces were reacted with undecylenic acid through photochemical hydrosilylation, leading to the formation of carboxydecyl-terminated monolayers. The final rinse in hot acetic acid is important to get rid of the physisorption of unreacted undecylenic acid to the carboxyl-terminated surface so as to guarantee the cleanliness of the surface.63 Figure 2.4 shows the IR-ATR spectra of the carboxydecyl monolayer. The intense peak at ~1710 cm-1 is characteristic of νC=O, the band at ~1410 cm−1 of the C−OH in plane mode, and the two bands at ~2855 and 2930 cm−1 of the symmetric and anti-symmetric νCH2, respectively. In particular for the SiH surface (Fig 2.4b), the peaks of νCH2 band are located at 2846 and 2918, indicating that the carboxydecyl chains on monohydride surface adopt well-defined conformation, more regular than on the SiHx surface.132 The narrower and sharper νCO band is also a consequence of such a regularity. We also note that no Si−O−Si band appears around 1050 cm−1 for both surfaces during the photochemical hydrosilylation.
Figure 2.4 IR-ATR spectra in s- (red) and p- (black) polarization of acid-terminated surfaces. The reference spectra are the SiHx (a) and SiH surfaces (b). The fit of νCO and νCH2 bands is highlighted in blue.
In addition, the IR-ATR spectroscopy allows a quantification of the grafted carboxydecyl chains from the integrated area of the νCO or νCH2 bands in s- and p-polarization, as described in detail by Faucheux et al. (cf Annex).63 The surface concentration of carboxydecyl groups is found to be about 2.0 ± 0.2×1014 cm−2 for the SiHx surface and 2.4 ± 0.2×1014 cm−2 for the SiH surface, being slightly lower than that reported on atomically flat (111) silicon surfaces (N = 2.5±0.2×1014 cm−2).64, 175 Molecular modeling performed by Sieval et al. on the factors of the tilt angle of the chain from the surface normal (35.5°), the diameter of the decyl chain (4.3Å) and the distance between two adjacent Si-H bonds (3.84
CHAPTER 2
Å), concluded that the maximal grafting density cannot exclude ~50%, in which the chains are anchored on every two Si-H bonds.104, 176 By knowing that the ideal SiH surface yields a density of 7.8×1014 cm-2 for surface hydrogen atoms, the coverage of carboxydecyl chains over the Si-H sites for the two surfaces is therefore 25% and 30%, respectively. The lower coverage of the SiHx surface is plausible because of its larger roughness.
The AFM images of the carboxydecyl-terminated surface are shown in Fig. 2.5. The neat staircase structure is preserved after the hydrosilylation reaction, indicating the good homogeneity of the carboxydecyl chains.
Figure 2.5 AFM images at 5×5 μm2 (a) and 1×1 μm2 (b) of the carboxydecyl-terminated surface.
2.2.3 Activation reaction
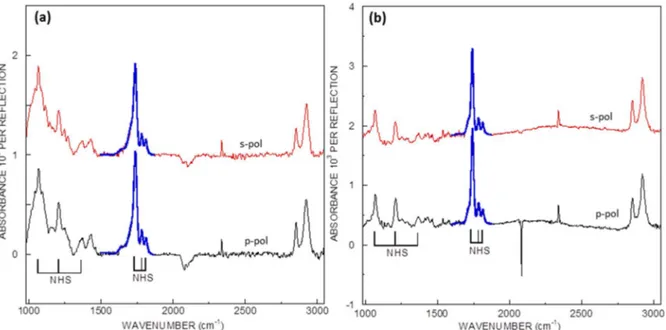
The acid functions are then activated in a mixture of EDC/NHS (5mM/5mM) to form the NHS-ester terminated monolayer. Fig. 2.6 shows the IR-ATR spectra of the formation of NHS-ester functions. Several characteristic peaks of the NHS-ester confirm the success of the activation reaction: the triplet band at 1820, 1785 and 1745 cm-1 corresponds to the νCO of NHS ester, the symmetric and antisymmetric νCO of the succimidyl cycle, respectively; the bands at 1370 and 1205 cm-1 correspond to the symmetric and antisymmetric νC-N-C of succimidyl cycle, respectively; the band at 1065 cm-1 correspond to the succimidyl νN-C-O.110 The density of NHS ester can be quantitatively analyzed by fitting the νCO triplet band, as developed by Moraillon et al. (cf Annex).64 The quantity of NHS-ester terminations is found to be N ≈ 1.6×1014 cm−2 for the SiHx surface and N ≈ 2.2×1014 cm-2 for the SiH surface,
BUILD-UP OF GLYCOSYLATED MONOLAYERS
Figure 2.6 IR-ATR spectra in s- (red) and p- (black) polarization of NHS ester-terminated surfaces. The reference spectra are the SiHx (a) and SiH surfaces (b). The fit of νCO bands of NHS ester is highlighted in blue.
Figure 2.7 AFM images at 5×5 μm2 (a) and 1×1 μm2 (b) of the NHS ester-terminated surface.
CHAPTER 2
a) Aminolysis by EG8
The aminolysis with amino OEG molecules is performed at room temperature in PBS 1X buffer. Fig. 2.8 displays the corresponding IR-ATR spectra. We clearly observe the disappearance of the NHS-ester triplet and the appearance of the amide bands. Two bands at 1642 and 1548 cm−1 are characteristic to the νCO and νCNH of the amide group (amide I and II, respectively). The vibrational bands at 1105 and ∼2820−2960 cm−1
are attributed to the νC−O−C and νOCH2 of the ethylene glycol chain, respectively. Moreover, the band characteristic of the stretching mode of the azido group is present at 2109 cm−1 and superimposed to the negative band of the νSiHx (Fig 2.8a). This band is more apparent on the SiH surface (Fig 2.8b). We also notice the presence of residual carboxylic acid peak at ~1730 cm−1, which can be integrated to deduce the aminolysis yield in comparison with the initial area of the carboxydecyl-terminated surface (Fig 2.4).177 A common way is to fit the triple band between 1500 and 1800 cm−1 in which the area at ~1730 cm−1 is obtained. The density of OEG chain is found to be 1.6×1014 cm-2 for the SiHx surface and 1.7×1014 cm-2 for the SiH surface, corresponding to an aminolysis yield of ~100% and ~77%, respectively.
Figure 2.8 IR-ATR spectra in s- (red) and p- (black) polarization of azido-terminated surfaces. The reference spectra are the SiHx (a) and SiH surfaces (b). The fit of the triple bands corresponding to the amide II, I and the carbonyl of the residual carboxylic acid is highlighted in blue.
Another direct quantification of the density of OEG chain can be obtained from the νCH2 band of ethylene glycol units. Their contribution can be obtained by using the
carboxyl-BUILD-UP OF GLYCOSYLATED MONOLAYERS
chains is the same. The broad band from 2800-3000 cm−1 corresponds to the νCH2 of OEG chains. Perez et al. have succeeded to quantify the grafted Si-(EG)nOMe molecule by IR-ATR, where he obtained the contribution of each ethylene glycol unit.134 In our case, n=8, the density of OEG chains is found to be 1.6×1014 cm-2 for the SiHx surface and 1.7×1014 cm-2 for the SiH surface, very close to the result obtained by the previous method. The global amidation yield (activation and aminolysis) is therefore determined to be 80% and 72% for the two surfaces, respectively.
Figure 2.9 IR-ATR spectra in s- (red) and p- (black) polarization of azido-terminated surfaces in the region of 2000-3050 cm-1 (a,b) and 950-1520 cm-1 (c,d). The reference spectra are carboxydecyl-terminated surfaces grafted on SiHx (a,c) and SiH surfaces (b,d). The fit of the νCH2 bands in (a,b) is highlighted in blue.
It is worth noticing that the best-defined structure of the SiH surface leads to the same density of N3-terminus as the rougher SiHx surface. The analysis of IR fingerprint region (< 1500 cm−1) of OEG chains is shown in Fig 2.9c and d, a plenty of bands relating to the conformation of O-CH2CH2 segments appear at ~900-1500 cm−1 and are listed in Table 2.1. Their peak positions are compared with those of PEG molecule in crystalline or amorphous states as listed in Table 2.1. The data shows the grafted OEG chains are more likely an amorphous state where the chains are elongated in randomly helical conformations such as trans-gauche-trans (TGT), TGG or TTG, etc, featuring a length around ~2.5 nm (a length of
CHAPTER 2
2.78 Å for each ethylene glycol unit).132 Therefore, we hypothesize that the linking of flexible OEG chains adopts a random or even more entangled conformation that makes its steric hindrance be the limit of higher amidation yield.
PEG crystal
PEG
amorphous On SiHx surface On SiH surface
CH2 scissor (gauche) 1470 (s) 1460 (p, s) 1458 (p, s) 1463 (p, s) CH2 wag (gauche) 1345 (p) 1352 (p) 1350 (p, s) 1350 (p, s) CH2 wag (trans) 1325 1327 (p, s) 1328 (p, s) CH2 twist 1283 (s) 1296 (s) 1300 (p, s) 1300 (p, s) C-O, C-C stretching 1119 (s) 1107 (p) 1038 (s) 1110 (s) 1036 (s) 1107 (p) 1038 (s) Table 2.1 Peak position of OEG chains picked up from Fig. 2.9 c, d and the standard peak position of crystalline and amorphous PEG. (N.B, p, s = p or s-polarization).
In order to characterize the azido function, XPS is also performed. Fig 2.10 shows the XPS narrow scan of the Si2p, O1s, C1s and N1s region of the acid- to the azide-functionalized surfaces. In the Si2p spectrum, we confirm that both surfaces are not oxidized since no band is visible at ~103 eV (Fig 2.10a).
The O1s narrow scan of the acid-terminated surface (Fig 2.10b) can be attributable to the contribution of O-C and O=C at equivalent ratio, whereas the two contributions were nicely fitted by imposing a ratio of 6.4:1 in case of azide-terminated surface, in considering the amidation yield of 0.8 (8 O-C in OEG chains and 1 C=O in carboxydecyl chains so that (C-O):(C=O) = 8×0.8:1 = 6.4:1).
The C1s of acid-terminated surface (Fig 2.10c) can be fitted as 3 peaks. The peak at 290 eV corresponds to the carbonyl of the acid, the peak at 287 eV is assigned to the CH2 in the α position of the acid function and the peak at 285 eV is for the carbon on decyl chains. We obtain a ratio of 1:1:9 for C=O (290 eV): C-COOH (287 eV): C-C (285 eV). For the azide-terminated surface, the C-N, C-O and C-N3 are approximately at the same binding energy, so the area ratio is distributed at C(O)NH (288.8 eV) : C-O (288.2 eV) : C-C (285 eV)=1: 0.8× 18: 10 =1:14.4:10. All of the above assignments can well fit the XPS data and support the quantification result of IR.
Besides, the most interesting analysis is the high resolution XPS narrow scan of the N1s region (Fig 2.10d). The band at 405.4 eV is attributed to the azide function and arises from the central electron-deficient nitrogen (N=N+=N-) and another at 401.8 eV corresponding to the two lateral nitrogen atoms (N=N+=N-). These two bands appear with a ratio 2:1, in accordance with the incorporation of an N3 group. An additional band at 400.7 eV is attributed to the nitrogen atom of the amide function.
BUILD-UP OF GLYCOSYLATED MONOLAYERS
Figure 2.10 High resolution XPS spectra and composition assignment of the acid and azide-terminated surfaces in regions of Si2p (a), O1s (b), C1s (c) and N1s (d).
The AFM images of the azide-terminated surface are shown in Fig. 2.11. The staircase structure is again preserved after the attachment of OEG chains of 2.5 nm length.
CHAPTER 2
b) Aminolysis by EG2
To evaluate the antifouling property of OEG layer, a shorter NH2-C2H4-(EG)2-N3 is analogously amidated. Fig 2.12 displays the IR-ATR spectra of the acid-, NHS ester- and azide-terminated surfaces. Using the same quantification methods as described before, we obtain a density of 2.0×1014 cm-2 for acid-moiety, 1.8×1014 cm-2 for NHS ester-moiety and 1.8×1014 cm-2 for N3-moiety, corresponding to activation and aminolysis yield of 90% and 100% (amidation yield of 90%). The higher amidation efficiency is probably due to the smaller steric hindrance of the shorter EG2 chains.
Figure 2.12 IR-ATR spectra in p-polarization of acid- (a), NHS ester- (b) N3-EG2-terminated surfaces (c). The reference spectra are the SiHx surface.