line and mathematical performance: An international twin study. British Journal of Educational Psychology, 89(4), 787-803., which has been published in final form at
https://doi.org/10.1111/bjep.12259. This article may be used for non-commercial purposes in accordance with Wiley Terms and Conditions for Use of Self-Archived Versions.
The Nature of the Association Between Number Line and Mathematical Performance: An International Twin Study
Running head: Number Line and Mathematics
Maria Grazia Tosto1†, Gabrielle Garon-Carrier2†, Susan Gross3, Stephen A. Petrill4, Sergey Malykh1,5, Karim Malki6, Sara A. Hart7, Lee Thompson3, Rezhaw L. Karadaghi6, Nikita
Yakovlev1, Tatiana Tikhomirova5, John E. Opfer4, Michèle M. M. Mazzocco8, Ginette Dionne2, Mara Brendgen9, Frank Vitaro10, Richard E. Tremblay1,10,11, Michel Boivin1,2, Yulia Kovas1,6,12
1 Department of Psychology, Institute of Genetic, Neurobiological, and Social Foundations of
Child Development, Laboratory for Cognitive Investigations and Behavioral Genetics, Tomsk State University, 36 Lenin Avenue, 634050 Tomsk, Oblast, Russia
2 School of Psychology, Université Laval, 2325 de l'Université, Québec, QC, G1V 0A6, Canada 3 Department of Psychological Sciences, Case Western Reserve University, 10900 Euclid
Avenue, 44106 Cleveland, Ohio, USA
4 Department of Psychology, The Ohio State University, 281 W. Lane Avenue, 43210 Columbus,
Ohio, USA
5 Psychological Institute, Russian Academy of Education, 9 Mokhovaya Street, 125009 Moscow,
Russia
6 MRC Social, Genetic and Developmental Psychiatry Centre, Institute of Psychiatry,
Psychology & Neuroscience, King’s College London, 16 De Crespigny Park, SE5 8AF London, UK
7 Department of Psychology, Florida Center for Reading Research, The Florida State University,
2010 Levy Avenue, Suite 100, 2310 Tallahassee, Florida, USA
8 Institute of Child Development, University of Minnesota, 5 East River Parkway, 55455
Minneapolis, Minnesota, USA
9 Department of Psychology, School of Psychology, Université du Québec à Montréal, 405
Sainte-Catherine Est, Montréal, QC, H2L 2C4, Canada
10 Department of Psychoeducation, Department of Pediatrics and Psychology, Université de
Montréal, 2900 Boulevard Edouard-Montpetit, Montréal, QC, H3T 1J4, Canada
11 School of Public Health, Physiotherapy and Sports Science, University College Dublin,
Belfield, Dublin 4, D04 V1W8 Ireland
12 Department of Psychology, University of London, Goldsmiths, 8 Lewisham Way, New Cross,
SE14 6NW London, UK † Joint first author
Correspondence concerning this article should be sent to Prof Yulia Kovas, Department of Psychology Goldsmiths University of London SE14 6NW. Tel: +44 (0)20 078 5025; Email: [email protected]
The Nature of the Association Between Number Line and Mathematical Performance: An International Twin Study
Abstract
Background: The number line task assesses the ability to estimate numerical magnitudes. People vary greatly in this ability and this variability has been previously associated with mathematical skills. However, the sources of individual differences in number line estimation and its association with mathematics are not fully understood.
Aims: This large scale genetically sensitive study uses a twin design to estimate the magnitude of the effects of genes and environments on: (1) individual variation in number line estimation and (2) the co-variation of number line estimation with mathematics.
Samples: We used over 3,000 8-16 years-old twins from US, Canada, UK, and Russia, and a sample of 1,456 8-18 years-old singleton Russian students.
Methods: Twins were assessed on: (1) estimation of numerical magnitudes using a number line task and (2) two mathematics components: fluency and problem solving.
Results: Results suggest that environments largely drive individual differences in number line estimation. Both genes and environments contribute to different extents to the number line estimation and mathematics correlation, depending on the sample and mathematics component. Conclusions: Taken together, the results suggest that in more heterogeneous school settings, environments may be more important in driving variation in number line estimation and its association with mathematics, whereas in more homogeneous school settings, genetic effects drive the covariation between number line estimation and mathematics. These results are discussed in light of development and educational settings.
The Nature of the Association Between Number Line and Mathematical Performance: An International Twin Study
Numerical competencies, such as the awareness of quantities and the understanding of numerical magnitudes, are considered vital precursors of counting skills (Gelman & Gallistel, 1978), formal arithmetic (Wynn, 1992) and for the development of advanced mathematical abilities (Dehaene, 1997). One task often used to assess individuals’ numerical magnitude representation is the number line task (Siegler & Opfer, 2003). Trials of the task usually show a horizontal line representing a range of numerical values, indicated by the numbers marking the edges of the line. Participants are asked to estimate the position of target numerals, within the range, along the line. Scores indicate participants’ accuracy based on how close their estimation is to the correct number position. The mainstream literature suggests that numerical thinking underlying this task relates to how individuals mentally represent quantities, how these representations are tagged by number symbols, and how numbers are related to each other. Recent empirical evidence suggests that number line estimation tasks entail judgments of proportions (Barth & Paladino, 2011; Slusser & Barth, 2017).
Irrespectively of the processes involved in number line estimation, greater accuracy in this task predicts greater achievement in mathematics (Booth & Siegler, 2008; Fuchs et al., 2010; Geary, 2011; Sasanguie, Göbel, Moll, Smets, & Reynvoet, 2013; Vukovic et al., 2014). This finding has been reliably replicated across samples in different countries: Sweden (Träff, 2013), China (Muldoon, Simms, Towse, Menzies, & Yue, 2011; Siegler & Mu, 2008), the Amazonian tribe of Munduruku (Pica, Lemer, Izard, & Dehaene, 2004), Denmark (Sasanguie et al., 2013), and the US (Booth & Siegler, 2008); and across ages ranging from preschool (4-5 year-olds) (Kolkman, Kroesbergen, & Leseman, 2013) to school-age children (~12 year-old; Lyons, Price,
Vaessen, Blomert, & Ansari, 2014).
Indeed, accuracy in estimation of numerical magnitude improves with age (Laski & Siegler, 2007; Siegler & Opfer, 2003) and children are less accurate than adults in number line task performance (Siegler & Opfer, 2003). For example, representation of numbers 1 – 10 is generally more accurate among 6-7 year-olds than representation of numbers 1 – 100 in the same children (Laski & Siegler, 2007). This evidence suggests the involvement of age-maturation processes in the development of number line estimation skills. Further, a male advantage in number line estimation was found in previous studies (Gunderson, Ramirez, Beilock, & Levine, 2012; Hannula, 2003; LeFevre et al., 2010; Thompson & Opfer, 2008) indicating that sex differences may also be a contributing factor in such variations. Experience and practice with numbers have been found to play a role in number line estimation accuracy (Moeller, Pixner, Kaufmann, & Nuerk, 2009; Pica et al., 2004).
Modest differences in number line performance were also detected in some cross-cultural studies. For example, 7 year-old Italian students showed better performance in number line estimation as they committed on average less error (17.78) than their age-matched Austrian, German-speaking peers (21.06) (Helmreich et al., 2011). Chinese 5-6 year-old children showed a superior number line performance compared to age-matched children from the US (Siegler & Mu, 2008). Conversely, no differences in number line performance were observed between Chinese and Scottish 4-6 years old children, although the two samples differed in mathematical performance (Muldoon et al., 2011). Considering that the mentioned studies used relatively small samples, and more likely not representative of their populations, some of the observed cross-cultural differences in number line performance may stem from sample bias. However, differences may also stem from environmental differences as social context/culture (e.g.,
educational norms, social constructs or linguistic features) have also been found associated to number line performance (Ito & Hatta, 2004; Ramscar, Dye, Popick, & O'Donnell-McCarthy, 2011; Shaki & Fischer, 2008; Wagner, Kimura, Cheung, & Barner, 2015).
Beyond environmental differences that may underlie some of the observed cross-cultural differences in number line performance, average differences in the frequency of particular genetic variants across populations may contribute to the observed differences in number line across cultures. Indeed, genes and cultures are not independent as they are likely to co-evolve (gene-culture co-evolution, Laland, Odling-Smee, & Myles, 2010). Genes and culture are two interacting forms of inheritance, with offspring acquiring both a genetic and a cultural legacy from their ancestors. Genetic propensities expressed throughout development influence what cultural organisms learn, while culturally transmitted information expressed in behaviour and artefacts spreads through populations and may influence how genes are selected and expressed (Laland et al., 2010).
Research so far suggests that both genetic and environmental mechanisms play a role in the development of number line estimation skills. In order to disentangle the contribution of genetic and environmental effects, genetically sensitive studies are required. In this study we use a twin design with samples from 4 countries to estimate the relative genetic and environmental contribution to number line task performance. Understanding the contribution of genes and environment on number line estimation performance is particularly relevant because of its association with mathematics. The few genetically sensitive studies that investigated the sources of variation in different aspects of mathematical abilities suggest the influences of genetic (heritability) and environmental factors. For example, one study conducted with 10 years old US twins found moderate heritability for math-calculation (35%) and math-fluency (34%), and
slightly higher heritability for applied problems (41%) and quantitative concepts (49%) (Hart, Petrill, Thompson, & Plomin, 2009; Hart, Petrill, & Thompson, 2010). Similarly, a study
conducted with 10-year old UK twins assessed on three mathematical sub-tests: understanding of algebraic, understanding of non-numerical processes, and computational knowledge, found heritability estimates between 32% and 45%, non-shared environmental influences between 42% and 48%, and almost non-existent shared environmental contribution (Kovas, Haworth, Petrill, & Plomin, 2007a). These studies also suggested similar etiology among those mathematic
components (Hart et al., 2009; Hart et al., 2010), indicated by large genetic overlaps, i.e. largely the same genes being involved across school achievement and test assessing understanding of algebraic, understanding of non-numerical processes and computational knowledge (Kovas et al., 2007b).
Although the nature of the association between mathematics and number line estimation is unclear, previous research suggests that common genetic factors are mainly responsible for the co-variation between mathematics and other abilities. For example, genes in common between reading and mathematics explain between 57% and 98% of their observed association (e.g. Haworth et al., 2009; Thompson, Detterman, & Plomin, 1991); while common genetic factors explain ~70% of the co-variation between general intelligence and mathematics (67%, Kovas, Harlaar, Petrill, & Plomin, 2005; 73%, Trzaskowski et al., 2013), and ~60% between spatial abilities and mathematics (Tosto et al., 2014a).
The Present Study
The current study uses a genetically informative twin-design to explore: 1) the relative contribution of genetic and environmental factors to individual differences in number line estimation skills. Given the phenotypic sex differences in number line we also investigate the
contribution of genetic and environmental effects on male and female performance in number line as well as mathematics; 2) the extent to which genetic and environmental factors drive the co-variation between number line estimation and mathematics assessed with two components: fluency and problem solving. Using twins from different countries will allow to uncover the effects of genetic and environmental factors on the measures in different cultural-educational settings. A sample of singleton students was also included to further understand the
generalizability of the developmental pattern observed in number line estimation, from twins to the general population (Plomin, DeFries, Knopik, & Neiderheiser, 2013).
Methods Participants
The four twin samples are drawn from four ongoing longitudinal twin-studies in the United States (US), Canada (CA), United Kingdom (UK) and Russia (RU). From each study, the samples are selected at the age of the data collection of number line and mathematics as follows: 492 English-speaking twins (246 pairs) from the US based ‘Western Reserve Reading and Math Project’ (WRRMP; Hart et al., 2009) with age range between age 8 and 15 years (M = 12.27, SD = 1.20); 674 (mostly French-speaking) twins (337 pairs) from the Canadian ‘Quebec Newborn Twin Study’ (QNTS; Boivin et al., 2013) at age 15 (M = 15.17; SD = .29); 5100 English-speaking twins (2550 pairs) from the UK representative ‘Twins Early Development Study’ (TEDS; Tosto et al., 2017) at age 16 (M = 16.48; SD = .27); 178 Russian-speaking twin pairs from the ‘Russian School Twin Registry’ (RSTR; Kovas et al., 2013) at age 16 (M = 16.44; SD = .91); and 1456 Russian singletons with age ranging from 7.51 to 18.85 years (M = 12.30; SD = 3.16).
developmental changes in number line performance, the singletons’ results are presented on the sample divided by age in two groups: Younger (age < 15.99; M = 11.42; SD = 2.59) and Older (age >16; M = 17.14; SD = .74). This makes the age range of the two singletons’ groups closer to the twin samples’ age range. Further details of samples and their recruitment can be found in Supplementary Online Material (SOM).
Measures and Procedures
The number line and mathematics tests were embedded in large cognitive and behavioral test batteries administered to participants as part of the data collections in the longitudinal studies. UK, Canadian and Russian twins completed their assessment online. US twins were assessed in person and completed the tests in pen and paper format. No mathematical data was available for the Russian singletons, but they completed the same online number line task as UK, Canadian and Russian twins.
Number Line estimation task was used to assess estimation of numerical magnitudes. The version used was adapted from a description in Opfer and Siegler (2007).
Mathematical abilities. Data on mathematical ability were collected in two domains: fluency and problem solving. Problem Verification Task (Murphy & Mazzocco, 2008) and Understanding Numbers test (nferNelson, 1994, 1999, 2001) were used to measure respectively fluency and problem solving in the UK, Canadian and Russian twins. US twins’ fluency and problem solving skills were assessed with Fluency and Applied Problems, both subtests from Woodcock-Johnson III Tests of Achievement (WJ-III, McGrew, Woodcock, & Schrank, 2007; Woodcock, McGrew, & Mather, 2001). Details on the measures and their reliability can be found in SOM.
The twin method compares monozygotic (MZ) and dizygotic (DZ) within-pair twins’ correlations (intraclass correlations) to estimate the contributions of genes (h2, heritability),
shared (c2) and non-shared environments (e2) to individual differences (univariate models) and of
sex differences in traits (univariate sex-limitation models). The method also allows to estimate the contribution of genes and environments to traits’ co-variation (multivariate genetic models). Details of the twin method can be found in SOM.
Results
Prior to analyses, a log 10 transformation was applied to Number Line estimation to correct for non-normality. To control for the contribution of age and sex to the twin correlations (Eaves, Eysenck, & Martin, 1989), twin analyses were conducted on age and sex residualized and standardized variables (mean of 0 and standard deviation of 1.0). As analyses were conducted in each sample separately, we treated outliers in accordance with data preparation practices of each study for consistency with other publications reporting on the variables analyzed in the current study (see SOM for details of previous publications using the same measures). Scores outside ±3 standard deviations were excluded as outliers from analyses of UK twins and Russian singletons; data were winsorized to ±3 standard deviations in US and Russian twins and winsorized to the 97th percentile for the Canadian twins.
The correlation between Problem Verification (fluency) and Understanding Numbers (problem solving) in CA, UK and RU were respectively: r = .57, 95% Confidence Interval (CI) [.49; .64]; r = .67 [.63; .68]; and r = .64 [.53; .72]. In the US twins, the correlation between WJ-III subtests Fluency and Applied Problems was r = .47 [.37; .57]. Therefore, fluency and problem solving measures were combined into a single score in each sample (Mathematics Composite) by averaging the standardized means. Results are reported for the single measures and the
Mathematics Composite. Phenotypic Analyses
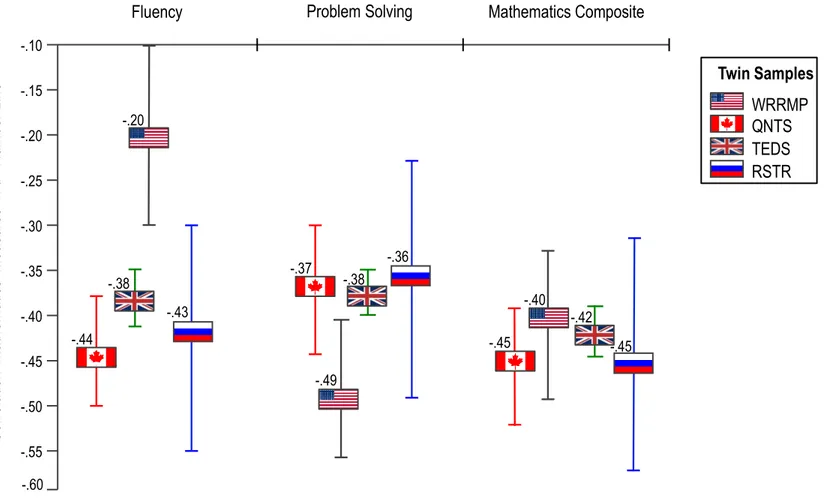
The correlation between Number Line and the Mathematics Composite was strikingly similar in the four samples (average correlation = -.43, range = -.41 and -.45). When the correlation of Number Line was carried out with the mathematics components of fluency and problem solving respectively, some differences emerged across the samples. The three twin samples that used the same tests (CA, UK and RU in Figure 1) showed very similar correlations between Number Line estimation and Problem Verification (fluency) (average correlation= -.42, range= -.38 and -.44) and between Number Line estimation and Understanding Numbers
(problem solving) (average -.37, range -.36 and -.38). The 95% CIs were largely overlapping, suggesting that the correlations may not be significantly different in these three samples. In the US twins, the correlation between Number Line estimation and Fluency (WJ-III) was weaker (-.20) and the correlation between Number Line estimation and Applied Problems (problem solving; WJ-III) was stronger (-.49) compared to the correlation of Number Line and the same mathematical domains in the other three samples. Summary of phenotypic correlations between number line estimation and mathematics measures are presented in Figure 1 and Table S7 in SOM.
Descriptive statistics for each sample are presented in Table S1 in SOM. The oldest samples were the most accurate in Number Line estimation and the youngest samples were the least accurate. Number Line estimation scores were smaller (less error, hence more accurate) in the older groups (Canadian, UK and Russian twins, and Older Russian singletons) than in the two youngest groups (US twins and the Younger Russian singletons). In the UK sample, the largest and the most age-homogeneous, participants were the most accurate on average. The
median of the Number Line task in the six groups of twins and singletons shows a pattern
consistent with the previously reported increase estimation accuracy with age (Table S1, SOM). Males were on average more accurate than females in Number Line and mathematics measures, except for the Russian twins where females performed slightly better on the
mathematical tests. However, these sex differences were negligible, ranging between 0.0% and 3.1% of variance across samples.
Twin Analyses
Univariate models. Twin genetic analyses were conducted only in US, CA and UK because the Russian sample is smaller than the others and currently underpowered for these analyses. Given the differences in age and sample-size, these analyses were conducted separately in each sample.
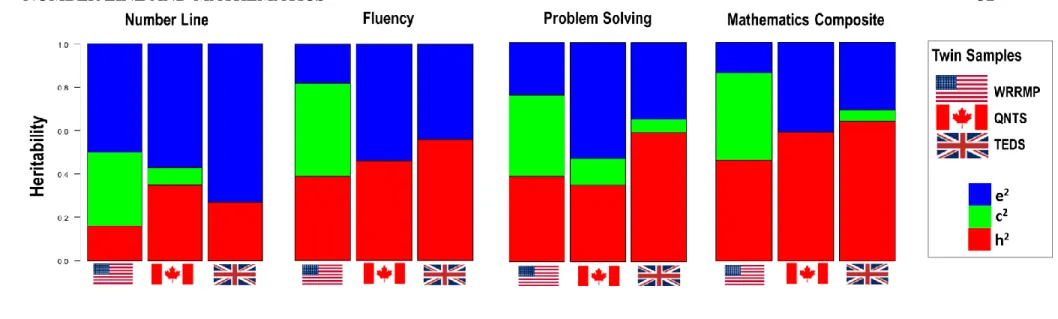
MZ intraclass twin correlations (ICCs) were greater than DZ correlations for all measures, suggesting some genetic influences on Number Line estimation and mathematics measures (see Figure 2 and Table S3 in SOM). Heritability estimates for Number Line estimation were
modest: .16 in US; .35 in CA; .27 in UK. The contribution of shared environmental factors were: .34 in US; .08 in CA; and virtually zero in UK. Non-shared environmental factors were the most important component in all samples: .50 in US; .57 in CA; and .73 in UK. Variance in the mathematics measures was explained by genetic, non-shared and shared environmental factors in US, whereas in CA and UK variance in mathematics was largely explained by genetic and non-shared environmental factors. For example, heritability of the Mathematics Composite was .46 in US, .59 in CA and .64 in UK; shared environmental sources of variance were significant only in US (.40); non-shared environments were .14 in US, .41 in CA and .31 in UK (see Table S4 in SOM).
Univariate sex-limitation models were fitted only to UK data, as the sample has the adequate size to be divided into 5 sex-by-zygosity groups required for these analyses (Eley, 2005). ICCs for the 5 sex-by-zygosity groups are presented in TableS3 in SOM. Sex-limitation model fitting analyses revealed no qualitative or quantitative sex differences in Number Line estimation, Problem Verification (fluency) and Mathematics Composite (Table S5 in SOM). This suggests that, for these measures, the same genetic and environmental factors explain individual variation to the same extent in males and females. For Understanding Numbers (problem
solving), small quantitative sex-differences were detected, indicating significantly higher heritability for females. It should be noted that etiological sex-differences might not necessarily give rise to phenotypic sex-differences (Kovas et al., 2007b). Small but significant differences in variances between males and females were also observed for this measure (see footnote Table S5, SOM).
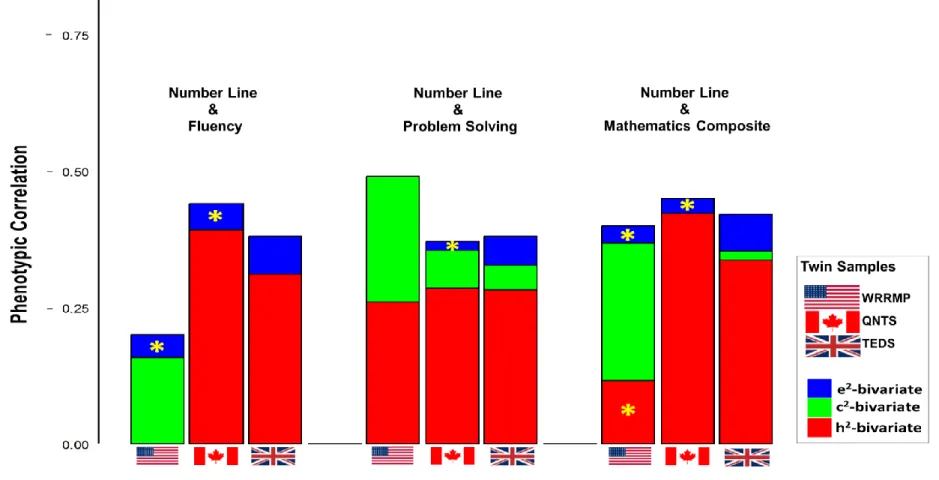
Multivariate models. In CA and UK, the cross-trait cross-twin correlations were greater in MZ than DZ on all measures, suggesting genetic effects in the covariation of all measures. In US, the MZ cross trait correlation were equal or smaller than the DZ correlations, suggesting greater environmental contribution in the co-variation of the measures (Table S6, SOM). Figure 3 depicts the extent to which genetic and environmental factors account for the phenotypic (observed) correlations of Number Line estimation with fluency and problem solving measures and Mathematics Composite in the three samples. For example, 82% of the phenotypic
correlation between Number Line estimation and Problem Verification (fluency) in the UK sample (r = -.38) is explained by common genetic factors. Non-shared environmental factors explain the remaining 18% of the correlation.
In the US sample, a significant genetic correlation was found between Number Line estimation and Applied Problems (problem solving), while the association between Number Line and the other two mathematics variables (fluency and composite) was explained by common shared and non-shared environmental factors (see Table S7 in SOM). Conversely, genetic influences were mainly responsible for the co-variation between Number Line estimation and mathematics in CA and UK (Figure 3); in these samples, almost all shared environmental correlations were non-significant while all genetic correlations were significant (Table S7 in SOM).
Discussion
This study investigated the genetic and environmental sources of individual differences in estimation of numerical magnitudes on a number line task, and of the co-variation between number line estimation and mathematics measures of fluency and problem solving. It further explored genetic and environmental contribution to sex differences in estimation of numerical magnitudes and in mathematics.
The results showed that sources of individual differences in Number Line estimation and mathematics measures differed across populations. We found larger contribution of shared environmental factors in US, and greater influences of non-shared environmental factors in CA and UK. However, the nature of individual differences in Number Line was the same for males and females suggesting that any sex differences observed in mathematical ability (e.g. Reilly, Neumann, & Andrews, 2015) are unlikely to be related to Number Line estimation skills. The co-variation between Number Line estimation and mathematical performance was largely driven by shared-environmental component in US but was mainly driven by genetic factors in CA and UK.
Data from all countries supported the typical developmental trend whereby younger students were less accurate than older ones in number line performance. The same patterns of results observed in twins were replicated in non-twin participants. This suggests that results derived from twins in this study can be extended to the general population.
Which Factors Contribute To Individual Differences In Number Line?
The genetic analyses conducted in the samples from UK, CA and US showed that individual differences in number line estimation are largely driven by individual specific environment and are only modestly associated with genetic factors. As reported by previous studies, estimation of numerical magnitudes on a number line improves with practice, feedback or relevant experiences (Siegler & Booth, 2004; Siegler & Mu, 2008). Although some of these factors may be thought of as shared environments (e.g., quality and quantity of feedback provided by the teacher), they may act as individual specific environments by interacting with individual characteristics. Examples of such interaction may include perceptions and motivation associated with engaging and practicing number line estimation skills.
Developmental factors may also be responsible for individual variation in number line estimation. Discrepancies in the magnitude of genetic effects in Number Line performance of the younger US twins and the genetic effects of the relatively older Canadian and UK twins may stem from biological or maturational changes across development. For example, previous research suggests that heritability of general intelligence increases with age (Davis, Haworth, & Plomin, 2009; Plomin & Deary, 2015). Some indication of developmental effects was provided by exploratory analyses suggesting that age, rather than country or culture per se, are the main factors explaining mean differences in Number Line estimation across samples (details in Table
S2, SOM). However, our results as to the effects of development are merely suggestive, hindered by the differences in sample sizes and other limitations.
Discrepancies in the environmental estimates of number line for the US twins compared to the Canadian and UK twins may stem from homogeneous school environments existing in CA (Quebec) and UK. In these countries, the Government sets both the educational levels and school curricula resulting in a unified and standardized system across the whole territory. In addition, teachers in both countries undergo regular standardized training. At the time of this data
collection, the US Federal Government set only the most basic educational standard levels; more specific school policies, details of public school curricula, teaching practices, were set through local school boards. The different school policies may give rise to more homogeneous school environments in the UK and CA compared to the US. In homogeneous environments, genetic influences may be more significant in driving individual differences in a trait compared to environmental influences. Lower genetic influences on cognitive abilities and achievement have been reported in US twin-studies compared to non-US twin-studies (Australian and Western European samples). Such discrepancies are explained by gene-environment interaction mechanisms whereby genetic effects may be suppressed in conditions of socio-economic inequality (Tucker-Drob & Bates, 2015). A similar mechanism, related to cross-cultural differences, might also explain why the mathematical measures showed lower heritability estimates and higher shared-environmental component in US than in CA and UK.
Despite some differences, heritability of Number Line estimation was overall modest in all samples. Number line estimation skills are thought to be developmentally more basic than computational skills or more advanced mathematics; number line estimation is often categorized as core or domain-specific numerical skills (Fuchs et al., 2010). However, the importance of a
basic skill does not mean that individual differences in this skill are genetically driven. Another measure of basic numerical skills, non-symbolic estimation, has shown modest influences of genetic factors in normal populations (~30%) with most of the variance explained by non-shared environmental factors (Lukowski et al., 2017; Tosto et al., 2014b). More genetically sensitive and cross-cultural research at different ages is needed to investigate possible developmental or maturational changes and the role of homogeneity/heterogeneity of the environment in the development of number line estimation. For mathematics, the results of this study are consistent with previous findings, suggesting that individual differences in mathematics are driven by genetic and environmental factors to various extents, depending on the mathematics components and sample characteristics.
Which Factors Explain the Co-variation Between Number Line and Mathematics? In UK and CA, the co-variation between number line estimation and mathematics was largely driven by genetic factors (85% on average) with the remaining portion of the phenotypic correlation driven by shared and non-shared environment. In US, the co-variation between number line estimation and mathematics was more strongly driven by shared environmental factors (63% on average) compared to genetic factors (27% on average). In all the samples, non-shared, individual specific environments had small or non-significant influence.
It is possible that the different pattern of association between accuracy in Number Line estimation and mathematics reflects cultural differences across CA, UK and US. In presence of heterogeneous environments such as varying school curricula (in the US sample), environmental rather than genetic factors are the driving force shaping up individual differences in number line estimation and of its co-variation with mathematics. In presence of more homogenous common environments (school), genetic factors (of modest influence) drive variations in number line
estimation in addition to the individual specific environments (in CA and UK). It needs to be noted that the observed correlation between mathematics and number line estimation was overall small to modest in all samples. Thus, even if the genetic and environmental factors contributing to the association were completely overlapping, Number Line and mathematics remain largely different domains.
Are There Sex Differences in Number Line and in Mathematics?
Mean sex differences were negligible in all twin samples for all measures, suggesting that the observed sex differences in mathematical ability are unlikely to be related to number line estimation. The proportion of genetic and environmental contributions to variation in Number Line estimation, the Mathematics Composite and fluency (Problem Verification) were also the same for males and females.
Only the mathematical component of problem solving (Understanding Numbers) showed small etiological - quantitative and variance - sex differences in UK. This suggests that, in this mathematical component, the same genes and environments drive individual differences in boys and girls at age 16 but the magnitude of their effect is different for males and females. The test Understanding Numbers is designed according to UK school curricula and can be considered a good index of mathematical achievement. Previous studies in the UK twins have consistently reported small mean male advantage in mathematics, but no etiological sex-differences (Kovas et al., 2007b). However, age 16 marks the first time that etiological sex-differences are detected in mathematics school achievement (General Certificate of Secondary Education mathematics exams) in this sample (Shakeshaft et al., 2013).
Limitations and Conclusion
Canadian samples on genetic analyses. One alternative would have been using a subset of the UK sample to match in size the other two, however any criteria for carrying out the matching (e.g., on the basis of socio economic status, IQ, verbal, non verbal ability) would have introduced different confounding elements on the causes of discrepancies or similarities across the samples. Further, matching would have resulted in samples-size reduction and we preferred to carry out analyses on the largest number of participants available to provide reliable heritability estimates (Martin, Eaves, Kearsey, & Davies, 1978; Martin, Eaves, & Kendler, 1994).
Some discrepancies in results may have stemmed from measurement differences. For example, the questions of the two problem solving tests, Understanding Numbers and Applied Problems, are designed to assess similar cognitive abilities and similar mathematical domains, but the items are different in the two tests. In the US sample, all tests were administered in person; in particular, the pen and paper Number Line test had a very strict administration protocol. This may have generated more accurate measurements compared to the online tests. Some evidence in support of accuracy can be found in the US heritability estimates where all the measures showed the lowest non-shared environment, which in twin model fitting includes measurement error. However, US non-shared environment for pen and paper administered Number Line was very similar to that of the Canadian Number Line test administered online. In addition, the Number Line tests yielded adequate test-retest reliability and internal validity in all samples, although the latter varies widely across samples (from .63 to .95). Thus, the
discrepancies in the number line results are unlikely to be affected by differences in administration mode.
As our study could control for age only to some extent, future studies should include age-homogeneous twin sample from different countries in order to provide further support to the
explanatory role of age in the observed cross-cultural differences. Future research is also needed to explore the role of other cultural factors such as the reading/writing systems in number line estimation (Shaki & Fisher, 2008). In our study all samples had the same left-to-right writing direction and therefore was not suited to investigate these effects.
These limitations notwithstanding, this study is the first genetically sensitive investigation into number line estimation skills and mathematics that use data from twins from different countries. Although the results are not ready to be translated into the real-world practice, they provide novel insights in the etiology of individual differences in number line performance and its co-variation with mathematical ability.
Acknowledgments
This research was supported by Research has been supported by the Grant from the Russian Science Foundation (project # 14-48-00043) to Tomsk State University; by the Russian Science Foundation [project 15-18-30055]; by a program grant [G0901245; previously
G0500079] from the U.K. Medical Research Council (MRC); by Eunice Kennedy Shriver National Institute of Child Health and Development [HD059215; HD038075], and [HD075460]; by the Québec Ministry of Health, Fonds Québécois de la Recherche sur la Société et la Culture; the Fonds de la Recherche en Santé du Québec; the Social Science and Humanities Research Council of Canada; the National Health Research Development Program; the Canadian Institutes for Health Research; and Sainte-Justine Hospital’s Research Center. Michel Boivin is supported by the Canada Research Chair (Tier 1) program.
References
Barth, H. C., & Paladino, A. M. (2011). The development of numerical estimation: Evidence against a representational shift. Developmental Science, 14(1), 125–135.
https://doi.org/10.1111/j.1467- 7687.2010.00962.x
Boivin, M., Brendgen, M., Dionne, G., Dubois, L., P_erusse, D., Robaey, P., . . . Vitaro, F. (2013). The Quebec Newborn Twin Study: 15 years later. Twin Research and Human Genetics, 16, 64–69. https://doi.org/10.1017/thg.2012.129
Boker, S., Neale, M., Maes, H., Wilde, M., Spiegel, M., Brick, T., . . . Fox, J. (2011). OpenMx: An open source extended structural equation modeling framework. Psychometrika, 76, 306–317. https://doi.org/10.1007/s11336-010-9200-6
Booth, J. L., & Siegler, R. S. (2008). Numerical magnitude representations influence arithmetic learning. Child Development, 79, 1016–1031. https://doi.org/10.1111/j.1467-8624.2008. 01173.x
Cicchini, G. M., Anobile, G., & Burr, D. C. (2014). Compressive mapping of number to space reflects dynamic encoding mechanisms, not static logarithmic transform. Proceedings of the National Academy of Sciences of the United States of America, 111, 7867–7872. https://doi.org/10. 1073/pnas.1402785111
Davis, O. S., Haworth, C. M., & Plomin, R. (2009). Dramatic increase in heritability of cognitive development from early to middle childhood an 8-year longitudinal study of 8,700 Pairs of twins. Psychological Science, 20, 1301–1308.
https://doi.org/10.1111/j.1467-9280.2009.02433.x
Dehaene, S. (1997). The number sense: How the mind creates mathematics. New York, NY: Oxford University Press.
Eaves, L. J., Eysenck, H., & Martin, N. G. (1989). Genes, culture, and personality: An empirical approach. London, UK: Academic Press.
behavioural statistics. West Sussex, UK: Wiley.
Forget-Dubois, N., P_erusse, D., Turecki, G., Girard, A., Billette, J.-M., Rouleau, G., . . .
Tremblay, R. (2003). Diagnosing zygosity in infant twins: Physical similarity, genotyping, and chorionicity. Twin Research, 6, 479–485.
https://doi.org/10.1375/136905203322686464
Fuchs, L. S., Geary, D. C., Compton, D. L., Fuchs, D., Hamlett, C. L., & Bryant, J. D. (2010). The contributions of numerosity and domain-general abilities to school readiness. Child Development, 81, 1520–1533. https://doi.org/10.1111/j.1467-8624.2010.01489.x Geary, D. C. (2011). Cognitive predictors of achievement growth in mathematics: A 5-year
longitudinal study. Developmental Psychology, 47, 1539–1552. https://doi.org/10.1037/ a0025510
Gelman, R., & Gallistel, C. R. (1978). The child’s understanding of number (1986th ed.). Cambridge, MA: Harvard University Press.
Goldsmith, H. H. (1991). A zygosity questionnaire for young twins: A research note. Behavior Genetics, 21, 257–269. https://doi.org/10.1007/BF01065819
Gunderson, E. A., Ramirez, G., Beilock, S. L., & Levine, S. C. (2012). The relation between spatial skill and early number knowledge: The role of the linear number line.
Developmental Psychology, 48, 1229–1241. https://doi.org/10.1037/a0027433
Hart, S. A., Logan, J. A., Thompson, L., Kovas, Y., McLoughlin, G., & Petrill, S. A. (2016). A latent profile analysis of math achievement, numerosity, and math anxiety in twins. Journal of Educational Psychology, 108, 181–193. https://doi.org/10.1037/edu0000045 Hart, S. A., Petrill, S. A., & Thompson, L. A. (2010). A factorial analysis of timed and untimed
Individual Differences, 20, 63–69. https://doi.org/10.1016/j.lindif.2009.10.004
Hart, S. A., Petrill, S. A., Thompson, L. A., & Plomin, R. (2009). The ABCs of math: A genetic analysis of mathematics and its links with reading ability and general cognitive ability. Journal of Educational Psychology, 101, 388. https://doi.org/10.1037/a0015115 Haworth, C. M. A., Davis, O. S. P., & Plomin, R. (2013). Twins Early Development Study
(TEDS): A genetically sensitive investigation of cognitive and behavioral development from childhood to young adulthood. Twin Research and Human Genetics, 16, 117–125. https://doi.org/10.1017/ thg.2012.91
Haworth, C. M., Kovas, Y., Harlaar, N., Hayiou-Thomas, M. E., Petrill, S. A., Dale, P. S., & Plomin, R. (2009). Generalist genes and learning disabilities: A multivariate genetic analysis of low performance in reading, mathematics, language and general cognitive ability in a sample of 8000 12-year-old twins. Journal of Child Psychology and Psychiatry, 50, 1318–1325. https://doi.org/ 10.1111/j.1469-7610.2009.02114.x
Helmreich, I., Zuber, J., Pixner, S., Kaufmann, L., Nuerk, H. C., & Moeller, K. (2011). Language effects on children’s non-verbal number line estimations. Journal of Cross-Cultural
Psychology, 42, 598–613. https://doi.org/10.1177/0022022111406026
Ito, Y., & Hatta, T. (2004). Spatial structure of quantitative representation of numbers: Evidence from the SNARC effect. Memory & Cognition, 32, 662–673. https://doi.org/10.3758/ BF03195857
Kolkman, M. E., Kroesbergen, E. H., & Leseman, P. P. (2013). Early numerical development and the role of non-symbolic and symbolic skills. Learning and Instruction, 25, 95–103. https://doi.org/ 10.1016/j.learninstruc.2012.12.001
S. B. (2013). The Russian School Twin Registry (RSTR): Project progress. Twin Research and Human Genetics, 16, 126–133. https://doi.org/10.1017/thg.2012.133 Kovas, Y., Garon-Carrier, G., Boivin, M., Petrill, S. A., Plomin, R., Malykh, S. B., . . .
Brendgen, M. (2015). Why children differ in motivation to learn: Insights from over 13,000 twins from 6 countries. Personality and Individual Differences, 80, 51–63. https://doi.org/10.1016/j.paid. 2015.02.006
Kovas, Y., Harlaar, N., Petrill, S. A., & Plomin, R. (2005). Generalist genes and mathematics in 7-year- old twins. Intelligence, 33, 473–489. https://doi.org/10.1016/j.intell.2005.05.002 Kovas, Y., Haworth, C. M. A., Dale, P. S., Plomin, R., Weinberg, R. A., Thomson, J. M., &
Fischer, K. W. (2007). The genetic and environmental origins of learning abilities and disabilities in the early school years. Monographs of the Society for Research in Child Development, 72, 1–160. https://doi.org/10.1111/j.1540-5834.2007.00439.x
Kovas, Y., Haworth, C. M. A., Petrill, S. A., & Plomin, R. (2007). Mathematical ability of 10- year- old boys and girls: Genetic and environmental etiology of typical and low
performance. Journal of Learning Disabilities, 40, 554–567. https://doi.org/10.1177/002221940704000 60601
Laland, K. N., Odling-Smee, J., & Myles, S. (2010). How culture shaped the human genome: Bringing genetics and the human sciences together. Nature Reviews Genetics, 11, 137– 148. https://doi. org/10.1038/nrg2734
Laski, E. V., & Siegler, R. S. (2007). Is 27 a big number? Correlational and causal connections among numerical categorization, number line estimation, and numerical magnitude comparison. Child Development, 78, 1723–1743. https://doi.org/10.1111/j.1467-8624.2007.01087.x
LeFevre, J. A., Fast, L., Skwarchuk, S. L., Smith-Chant, B. L., Bisanz, J., Kamawar, D., & Penner-Wilger, M. (2010). Pathways to mathematics: Longitudinal predictors of performance. Child Development, 81, 1753–1767. https://doi.org/10.1111/j.1467-8624.2010.01508.x
Lukowski, S. L., Rosenberg-Lee, M., Thompson, L. A., Hart, S. A., Willcutt, E. G., Olson, R. K., . . . Pennington, B. (2017). Approximate number sense shares etiological overlap with mathematics and general cognitive ability. Intelligence, 65, 67–74.
https://doi.org/10.1016/j.intell.2017.08. 005
Lukowski, S. L., Soden, B., Hart, S. A., Thompson, L. A., Kovas, Y., & Petrill, S. A. (2014). Etiological distinction of working memory components in relation to mathematics. Intelligence, 47, 54–62. https://doi.org/10.1016/j.intell.2014.09.001
Lyons, I. M., Price, G. R., Vaessen, A., Blomert, L., & Ansari, D. (2014). Numerical predictors of arithmetic success in grades 1–6. Developmental Science, 17, 714–726.
https://doi.org/10. 1111/desc.12152
Martin, N. G., Eaves, L. J., Kearsey, M. J., & Davies, P. (1978). The power of the classical twin study. Heredity, 40(1), 97–116. https://doi.org/10.1038/hdy.1978.10
Martin, N. G., Eaves, L. J., & Kendler, K. S. (1994). The power of the classical twin study to resolve variation in threshold traits. Behavior Genetics, 24, 239–258.
https://doi.org/10.1007/ BF01067191
McGrew, K. S., Dailey, D. E. H., & Schrank, F. A. (2007). Woodcock-Johnson iii/Woodcock- Johnson iii normative update score differences: What the user can expect and why (Woodcock-Johnson iii assessment service bulletin no. 9). Rolling Meadows, IL: Riverside Publishing.
Moeller, K., Pixner, S., Kaufmann, L., & Nuerk, H. C. (2009). Children’s early mental number line: Logarithmic or decomposed linear? Journal of Experimental Child Psychology, 103, 503–515. https://doi.org/10.1016/j.jecp.2009.02.006
Muldoon, K., Simms, V., Towse, J., Menzies, V., & Yue, G. (2011). Cross-cultural comparisons of 5- year-olds’ estimating and mathematical ability. Journal of Cross Cultural
Psychology, 42, 669– 681. https://doi.org/10.1177/0022022111406035
Murphy, M. M., & Mazzocco, M. M. (2008). Mathematics learning disabilities in girls with fragile X or Turner syndrome during late elementary school. Journal of Learning Disabilities, 41, 29–46. https://doi.org/10.1177/0022219407311038
NferNelson Publishing Co. Ltd (1994). Maths 5–14 Series. London, UK: Author. NferNelson Publishing Co. Ltd (1999). Maths 5–14 Series. London, UK: Author. NferNelson Publishing Co. Ltd (2001). Maths 5–14 Series. London, UK: Author. Opfer, J. E. (2003). Analyzing the number-
line task: A tutorial. http://www.psy.cmu.edu/siegler/ SiegOpfer03Tut.pdf Opfer, J. E., & Siegler, R. S. (2007). Representational change and children’s numerical
estimation. Cognitive Psychology, 55, 169–195. https://doi.org/10.1016/j.cogpsych.2006.09.002
Petrill, S. A., Deater-Deckard, K., Thompson, L. A., DeThorne, L. S., & Schatschneider, C. (2006). Reading skills in early readers: Genetic and shared environmental influences. Journal of Learning Disabilities, 39, 48–55.
https://doi.org/10.1177/00222194060390010501
Pica, P., Lemer, C., Izard, V., & Dehaene, S. (2004). Exact and approximate arithmetic in an Amazonian indigene group. Science, 306, 499–503.
https://doi.org/10.1126/science.1102085
Plomin, R., & Deary, I. J. (2015). Genetics and intelligence differences: Five special findings. Molecular Psychiatry, 20, 98–108. https://doi.org/10.1038/mp.2014.105
Plomin, R., DeFries, J. C., Knopik, V. S., & Neiderheiser, J. (2013). Behavioral genetics (6th ed.). New York, NY: Worth Publishers.
Price, T. S., Freeman, B., Craig, I., Petrill, S. A., Ebersole, L., & Plomin, R. (2000). Infant zygosity can be assigned by parental report questionnaire data. Twin Research and Human Genetics, 3, 129– 133. https://doi.org/10.1375/twin.3.3.129
Ramscar, M., Dye, M., Popick, H. M., & O’Donnell-McCarthy, F. (2011). The enigma of number: Why children find the meanings of even small number words hard to learn and how we can help them do better. PLoS ONE, 6, e22501.
https://doi.org/10.1371/journal.pone.0022501
Reilly, D., Neumann, D. L., & Andrews, G. (2015). Sex differences in mathematics and science achievement: A meta-analysis of National Assessment of Educational Progress
assessments. Journal of Educational Psychology, 107(3), 645. https://doi.org/10.1037/edu0000012
Sasanguie, D., Go€bel, S. M., Moll, K., Smets, K., & Reynvoet, B. (2013). Approximate number sense, symbolic number processing, or number–space mappings: What underlies
mathematics achievement? Journal of Experimental Child Psychology, 114, 418–431. https://doi.org/10. 1016/j.jecp.2012.10.012
Shakeshaft, N. G., Trzaskowski, M., McMillan, A., Rimfeld, K., Krapohl, E., Haworth, C. M. A., . . . Plomin, R. (2013). Strong genetic influence on a UK nationwide test of educational achievement at the end of compulsory education at age 16. PLoS ONE, 8, e80341.
https://doi.org/10.1371/ journal.pone.0080341
Shaki, S., & Fischer, M. H. (2008). Reading space into numbers–a cross-linguistic comparison of the SNARC effect. Cognition, 108, 590–599.
https://doi.org/10.1016/j.cognition.2008.04.001
Shrout, P. E., & Fleiss, J. (1979). Intraclass correlations: Uses in assessing rater reliability. Psychological Bulletin, 86, 420–428. https://doi.org/10.1037/0033-2909.86.2.420 Siegler, R. S., & Booth, J. L. (2004). Development of numerical estimation in young children.
Child Development, 75, 428–444. https://doi.org/10.1111/j.1467-8624.2004.00684.x Siegler, R. S., & Mu, Y. (2008). Chinese children excel on novel mathematics problems even
before elementary school. Psychological Science, 19, 759–763. https://doi.org/10.1111/j.1467-9280. 2008.02153.x
Siegler, R. S., & Opfer, J. E. (2003). The development of numerical estimation evidence for multiple representations of numerical quantity. Psychological Science, 14, 237–250. https://doi.org/10.1111/1467-9280.02438
Slusser, E., & Barth, H. (2017). Intuitive proportion judgment in number-line estimation: Converging evidence from multiple tasks. Journal of Experimental Child Psychology, 162, 181–198. https://doi.org/10.1016/j.jecp.2017.04.010
Thompson, L. A., Detterman, D. K., & Plomin, R. (1991). Associations between cognitive abilities and scholastic achievement: Genetic overlap but environmental differences. Psychological Science, 2, 158–165.
https://doi.org/10.1111/j.1467-9280.1991.tb00124.x
Thompson, C. A., & Opfer, J. E. (2008). Costs and benefits of representational change: Effects of context on age and sex differences in symbolic magnitude estimation. Journal of
Experimental Child Psychology, 101, 20–51. https://doi.org/10.1016/j.jecp.2008.02.003
Tikhomirova, T., Kuzmina, Y., & Malykh, S. (2018). Does symbolic and non-symbolic estimation ability predict mathematical achievement across primary school years?. In ITM Web of Conferences (Vol. 18, p. 04006). EDP Sciences.
Tosto, M. G., Hanscombe, K. B., Haworth, C., Davis, O. S., Petrill, S. A., Dale, P. S., . . . Kovas, Y. (2014). Why do spatial abilities predict mathematical performance? Developmental Science, 17, 462–470. https://doi.org/10.1111/desc.12138
Tosto, M. G., Petrill, S. A., Halberda, J., Trzaskowski, M., Tikhomirova, T. N., Bogdanova, O. Y., . . . Plomin, R. (2014). Why do we differ in number sense? Evidence from a
genetically sensitive investigation. Intelligence, 43, 35–46. https://doi.org/10.1016/j.intell.2013.12.007
Tosto, M. G., Petrill, S. A., Malykh, S., Malki, K., Haworth, C. M. A., Mazzocco, M. M. M., . . . Kovas, Y. (2017). Number sense and mathematics: Which, when and how?
Developmental Psychology, 53, 1924–1939. https://doi.org/10.1037/dev0000331 Traff, U. (2013). The contribution of general cognitive abilities and number abilities to different
aspects of mathematics in children. Journal of Experimental Child Psychology, 116, 139– 156. https://doi.org/10.1016/j.jecp.2013.04.007
Trzaskowski, M., Davis, O. S., DeFries, J. C., Yang, J., Visscher, P. M., & Plomin, R. (2013). DNA evidence for strong genome-wide pleiotropy of cognitive and learning abilities. Behavior Genetics, 43, 267–273. https://doi.org/10.1007/s10519-013-9594-x
Tucker-Drob, E. M., & Bates, T. C. (2015). Large cross-national differences in gene
https://doi.org/10.1177/ 0956797615612727
Vukovic, R. K., Fuchs, L. S., Geary, D. C., Jordan, N. C., Gersten, R., & Siegler, R. S. (2014). Sources of individual differences in children’s understanding of fractions. Child
Development, 85, 1461– 1476. https://doi.org/10.1111/cdev.12218
Wagner, K., Kimura, K., Cheung, P., & Barner, D. (2015). Why is number word learning hard? Evidence from bilingual learners. Cognitive Psychology, 83, 1–21.
https://doi.org/10.1016/j.c ogpsych.2015.08.006
Wang, Z., Hart, S. A., Kovas, Y., Lukowski, S., Soden, B., Thompson, L. A., . . . Petrill, S. A. (2014). Who is afraid of math? Two sources of genetic variance for mathematical anxiety. Journal of Child Psychology and Psychiatry, 55, 1056–1064.
https://doi.org/10.1111/jcpp.12224
Wang, Z., Lukowski, S. L., Hart, S. A., Lyons, I. M., Thompson, L. A., Kovas, Y., . . . Petrill, S. A. (2015). Is math anxiety always bad for math learning: The role of math motivation. Psychological Science, 26, 1863–1876. https://doi.org/10.1177/0956797615602471 Woodcock, R. W., McGrew, K. S., & Mather, N. (2001). Woodcock-Johnson III tests of
achievement. Itasca, IL: Riverside Publishing.
Wynn, K. (1992). Addition and subtraction by human infants. Nature, 358, 749–750. https://doi. org/10.1038/358749a0
Figure 1. Phenotypic correlations. Magnitudes of the phenotypic correlation between Number Line and the mathematics measures are marked on the Y-axis. The whiskers represent their 95% Confidence Intervals (CI). Mathematics measures are marked on the X-axis: fluency (Problem Verification in UK, CA and RU; Fluency WJ-III in US), problem solving (Understanding Numbers in UK, CA and RU; Applied Problems WJ-III in US), and Mathematics Composite. See Table S7 in SOM for the exact values of correlations and CIs.
WRRMP QNTS TEDS RSTR Twin Samples C or re la tio n M at he m at ic s m ea su re s w ith N um be r L in e -.10 -.15 -.20 -.25 -.30 -.35 -.40 -.45 -.50 -.55 -.60 -.20 -.44 -.38 -.43 -.49 -.37 -.38 -.36 -.45 -.40 -.42 -.45
Figure 2. Univariate heritability estimates. The bars represent the variance of each measure decomposed in genetic (h2, red portion),
shared (c2, green portion) and non-shared environmental (e2, blue portion) variances. The first block of bars represents heritability and
environmental estimates for number Line Estimation in US, CA and UK respectively. The second block shows heritability for fluency (Fluency WJ-III in US, Problem Verification in CA and UK). The third block shows heritability for the problem solving component (Applied Problems WJ-III in US, Understanding Numbers test in CA and UK). The last block shows heritability for the Mathematics Composite. All the univariate heritability estimates are statistically significant; details can be found in Table S4 in SOM.
Figure 3. Bivariate heritability estimates. The length of each bar equals the magnitude of the phenotypic correlation between Number Line estimation and the mathematics variables. The portions in each bar represent the contribution of genetic (h2-bivariate, red),
shared-environmental (c2-bivariate, green) and non-shared environmental (e2-bivariate, blue) influences to the phenotypic correlation
between Number Line and the relevant mathematics measure. The bars are organized in 3 blocks showing genetic, shared, non-shared environmental contribution to the phenotypic correlation between: Number Line and fluency (Fluency WJ-III in US, Problem
Verification in CA and UK), Number Line and problem solving (Applied Problems in US, Understanding Numbers in CA and UK) and Number Line and the Mathematics Composites. The asterisk (*) indicates when the estimate of the bivariate heritability is non-significant. Estimates of the bivariate heritability depicted in Figure 3 can be found in Table S7 in SOM.