HAL Id: tel-02202115
https://pastel.archives-ouvertes.fr/tel-02202115
Submitted on 31 Jul 2019
HAL is a multi-disciplinary open access archive for the deposit and dissemination of sci-entific research documents, whether they are pub-lished or not. The documents may come from teaching and research institutions in France or abroad, or from public or private research centers.
L’archive ouverte pluridisciplinaire HAL, est destinée au dépôt et à la diffusion de documents scientifiques de niveau recherche, publiés ou non, émanant des établissements d’enseignement et de recherche français ou étrangers, des laboratoires publics ou privés.
Essays on the redistributive effects of the minimum wage
Claire Montialoux
To cite this version:
Claire Montialoux. Essays on the redistributive effects of the minimum wage. Economics and Finance. Université Paris Saclay (COmUE), 2019. English. �NNT : 2019SACLG003�. �tel-02202115�
Essais sur les effets redistributifs du
salaire minimum
Thèse de doctorat de l'Université Paris-Saclay préparée à l’École Nationale de la Statistique et de l'Administration Économique
École doctorale n°578 :Sciences de l’Homme et de la Société (SHS) Spécialité de doctorat: Sciences économiques
Thèse présentée et soutenue à Paris le 1er juillet 2019, par
Claire M
ONTIALOUXComposition du Jury : Bruno CREPON
Professor d’économie, CREST Directeur de thèse Pierre CAHUC
Professor d’économie, Sciences Po Paris Rapporteur Eve CAROLI
Professor d’économie, PSL-Université Paris-Dauphine Rapporteur David CARD
Professor d’économie, UC Berkeley Examinateur Hilary HOYNES
Professor d’économie, UC Berkeley Examinateur Benoît SCHMUTZ
Professor Assistant d’économie, École Polytechnique Président du jury
NNT : 2019S A C LG 00 3
Remerciements
Cette thèse doit beaucoup à tous ceux qui m’ont accompagnée depuis le début de mes recherches. Bruno Crépon m’a immédiatement accordé sa confiance et accepté d’être mon directeur de thèse. Il m’a constamment guidée et inspirée au cours de ces dernières années.
Je tiens également à remericer mes rapporteurs, Pierre Cahuc et Eve Caroli pour avoir accepté de faire partie de mon jury. J’ai bénéficié des conseils et en-couragements de Pierre Cahuc après mes séminaires au CREST. Eve Caroli a proposé plusieurs pistes d’amélioration de mes recherches sur la transmission des augmentations de salaire minimum dans les prix des supermarchés lors d’une discussion au CEPREMAP, en octobre 2017.
David Card et Hilary Hoynes ont été des sources d’inspiration quotidiennes à UC Berkeley. Ils m’ont formée et m’ont insufflé une conception rigoureuse et scientifique de la recherche en économie. J’ai une dette particulière vis-à-vis de David Card qui m’a poussée à m’intéresser à la dynamique des inégalités raciales aux Etats-Unis dans les années 1960 et 1970. Les résultats de cette recherche constituent le premier article de cette thèse. Tous les deux, ainsi que Patrick Kline, m’ont entraînée et soutenue sur le job market académique.
Je tiens également à remercier Benoît Schmutz pour ses conseils, et pour avoir accepté d’être membre de mon jury.
Cette thèse n’aurait pas été possible sans la rencontre de nombreux chercheurs, avec qui j’ai eu la chance de collaborer pour écrire les articles qui composent cette thèse. Très tôt, Michael Siegenthaler et Tobias Renkin m’ont proposé de travailler avec eux sur la transmission des salaires minimum dans les prix des supermarchés – des recherches qui constituent le deuxième article de cette thèse. Ils ont accompagné mes premiers pas dans le monde de la recherche et ont toute ma reconnaissance. Je tiens également à remercier Sylvia Allegretto, Michael Reich et Jesse Rothstein de m’avoir accueillie à l’Institute for research on labor and employment à Berkeley. C’est là que je me suis passionnée pour l’évolution du salaire minimum. Nos recherches sur les effets économiques d’un salaire minimum à $15 aux États-Unis, menées conjointement avec Sylvia Allegretto
et Michael Reich, constitutent le troisième article de cette thèse. Cet article fait partie d’un ensemble plus vaste d’évaluations des effets économiques d’un salaire minimum à $15 au niveau de certains États (New York et Californie), villes (San Jose) et régions (Santa Clara county) que nous avons menées collectivement.
Enfin, j’ai eu la chance de rencontrer Ellora Derenoncourt et de travailler avec elle sur le rôle du salaire minimum dans la baisse des inégalités raciales aux États-Unis pendant le mouvement des droits civiques. Je suis heureuse que notre collaboration continue au-delà de la thèse, avec notamment un nouveau projet sur les inégalités raciales au Brésil.
Je tiens également à remercier Pierre Boyer, Laurent Davezies, Xavier d’Hault-foeuille, Francis Kramarz, Isabelle Méjean, et les nombreux autres chercheurs et doctorants du CREST pour leurs conseils avisés. Philippe Askenazy et Thomas Piketty m’ont permis de présenter mes recherches à la Paris School of Economics et au CEPREMAP à plusieurs reprises. Raj Chetty m’a invitée pendant un an dans son laboratoire de recherches sur les inégalités à Stanford ; enfin, Emmanuel Saez m’a invitée à UC Berkeley et m’a donné de précieux conseils. Je tiens plus géné-ralement à remercier l’ensemble de ces institutions qui ont accueilli mon travail et leurs communautés d’étudiants et de chercheurs. Ma gratitude va également au Washington Center for Equitable Growth qui a financé ma dernière année de recherches.
Enfin, cette thèse n’aurait sans doute pas vu le jour sans le soutien de ma famille et de mes amis. Parmi les nombreuses personnes qui m’ont accompagnée ces dernières années, merci à Aurélie et Emmeline qui ont été les premières à m’encourager à commencer ce travail ; merci à Mathilde et Maxime pour leur amitié inestimable et leurs connaissances économétriques inépuisables ; merci enfin à Gabriel, évidemment.
Contents
Résumé substantiel . . . viii
1 Minimum Wages and Racial Inequality 1 1 Introduction . . . 2
2 Related Literature . . . 7
A Literature on Racial Inequality and the Civil Rights Movement 7 B Minimum Wage Literature . . . 10
3 The 1967 Extension of the Minimum Wage and Data . . . 12
A The 1966 Fair Labor Standards Act . . . 12
B Data Used in our Analysis . . . 14
4 The Wage Effects of the 1967 Reform . . . 18
A Identification Strategy, Sample, and Summary Statistics . . . 18
B Baseline Estimates of the Effect of the 1967 Reform on Wages 20 C Robustness Tests and Other Estimation Strategies . . . 23
D Wage Effects by Race . . . 26
5 The Employment Effects of the 1967 Reform . . . 26
A Bunching Estimator . . . 26
B Employment Effects in the CPS . . . 31
6 Effects of the 1967 Reform on Racial Earnings Gaps . . . 32
A Unadjusted Racial Gap . . . 32
B Adjusted Racial Gaps . . . 34
C Discussion . . . 36
7 Conclusion . . . 37
2 The Pass-Through of Minimum Wages into US Retail Prices 68 1 Introduction . . . 69
2 Context and data . . . 75
A Minimum wage data . . . 75
B Minimum wages in the grocery sector . . . 77
C Data on prices in grocery stores . . . 79
D Data on employment and wages in grocery stores . . . 80
3 Main empirical specification . . . 80
4 The effect of minimum wage increases on prices . . . 84
A Main results . . . 84
B Identification through within-state variation in wages . . . . 86
C Robustness of baseline results . . . 87
D Heterogeneity of the price response . . . 89
5 The effect of minimum wage increases on cost . . . 93
A A benchmark model . . . 93
B The minimum wage elasticity of groceries’ labor costs . . . . 95
C Pass-through . . . 96
D Demand increases . . . 99
6 The impact of price increases in grocery stores on household welfare100 A The cost of price increases . . . 101
B The benefits of nominal wage increases . . . 102
C Comparing cost and benefits . . . 103
7 Conclusion . . . .105
3 The Economic Effects of a $15 in the U.S.: A Simulation Approach 131 1 Introduction . . . .132
2 Policy context . . . .132
A Labor market context . . . 132
B Minimum wage increase schedule . . . 134
3 Employment analysis for the U.S. . . .135
A The model . . . 135
B Model structure . . . 136
C Effects on workers . . . 143
D Effects on businesses . . . 146
E Effects on employment . . . 149
F Scale effects of increased prices on reduced sales of con-sumer goods . . . 156
G Income effects . . . 157
H Model calculations: net effects on employment . . . 158
4 Employment analysis for Mississippi . . . .159
A Effects on workers . . . 159
B Pay increases by industry . . . 160
C Effects on Mississippi employment . . . 161
A Minimum Wages and Racial Inequality: Appendix 185 A Minimum wage database (1950-2017) . . . .186
B March CPS (1962-1981) . . . .193
A Sample of interest . . . 193
B State crosswalks . . . 194
C Industry crosswalks . . . 196
D Topcoding . . . 196
E Comparing CPS and Census data . . . 197
C Economy-wide racial gap . . . .200
D Appendix Figures and Tables . . . .202
B The Pass-Through of Minimum Wages into US Retail Prices: Appendix219 A Construction of price series . . . .220
B Additional Regression Results . . . .222
C Results using state-level price series . . . .222
D The minimum wage elasticity of marginal cost . . . .222
E Further evidence on the earnings elasticity in grocery stores . . . .234
F Minimum wages and prices of COGS . . . .236
G Details on welfare calculations . . . .238
H Effects of minimum wages on output . . . .239
C The Economic Effects of a $15 in the U.S.: A Simulation Approach:
Appendix 249
A Structure of the minimum wage model . . . .250
A Part A: Workers affected and wage increase . . . 250
B Part B: Impact of capital-labor substitution and productivity gains . . . 250
C Part C: Scale effects: increase in consumer prices and reduc-tion in consumer demand . . . 252
D Part D: Income effects . . . 253
E Part E: Net effects . . . 253
B Key model parameters . . . .253
Résumé substantiel
Cette thèse analyse les effets redistributifs du salaire minimum et se compose de trois chapitres.
Le premier chapitre étudie le rôle du salaire minimum dans la dynamique des inégalités raciales aux États-Unis. Les différences de salaire entre Noir-Américains et Blancs ont été divisées par deux aux États-Unis entre la fin des années 1960 et la fin des années 1970. Depuis le milieu des années 1970, ces inégalités sur le marché du travail ont stagné à un niveau élevé. La loi relative au salaire minimum de 1966 (Fair Labor Standards Act) a introduit le salaire minimum dans l’agriculture, l’hôtellerie, la restauration, les maisons de retraite, les écoles et les hôpitaux – des secteurs qui n’étaient pas couverts par le salaire minimum précédemment et dans lesquels plus d’un tiers des travailleurs Noir-Américains étaient employés. Nous avons numérisé plus de 1000 distributions de salaire horaire issues des rapports détaillés sur les conditions de travail dans plusieurs secteurs publiés par le Bureau des statistiques du marché du travail américain dans les années 1960 ; nous avons également utilisé les données individuelles issues de l’enquête emploi américaine pour analyser les effets de la réforme de 1966 sur les salaires, l’emploi, et les inégalités raciales. Nous utilisons une stratégie de différence de différences qui compare l’évolution des salaires dans les secteurs couverts par le salaire minimum depuis 1938 (groupe de contrôle) à l’évolution des salaires dans les secteurs nouvellement couverts en 1966 (groupe de traitement) avant et après 1967 (année de l’introduction du salaire minimum dans de nouveaux secteurs) pour montrer que les salaires ont augmenté très nettement dès 1967 dans les nouveaux secteurs couverts par le salaire minimum. L’augmentation des salaires a été deux fois plus importante pour les travailleurs Noir-Américains que pour les Blancs. Au sein même des industries nouvellement couvertes, les différences de salaires entre Blancs et Noir-Américains – ajustées par toutes les caractéristiques observables (genre, années d’expérience, niveau d’éducation, etc.) baisse de 25 points de log avant réforme à près de 0 après réforme. En utilisant un estimateur de bunching, nous ne trouvons pas d’effet de la réforme sur l’emploi. Nous pouvons écarter des élasticités de l’emploi par rapport au salaire moyen plus
fortes que -0.1. La réforme de 1966 peut expliquer plus de 20% de la réduction des inégalités de salaires et de revenu entre les Noir-Américains et les Blancs pendant le mouvement des droits civiques aux États-Unis – soit autant que la déségrégation scolaire. Nos résultats mettent en lumière le rôle des institutions du marché du travail dans le déclin des inégalités entre Blancs et Noir-Américains. Le deuxième chapitre de cette thèse estime la transmission des augmenta-tions de salaire minimum dans les prix des produits des supermarchés. Nous utilisons des données de caisse et exploitons un grand nombre d’augmentations de salaire minimum au niveau des États américains survenues entre 2001 et 2012. Nous trouvons qu’une augmentation de 10% du salaire minimum se traduit par une augmentation moyenne des prix de l’ordre de 0.2% dans les supermarchés. L’ampleur de cette augmentation est cohérente avec une répercussion complète des augmentations du coût du travail dans les prix à la consommation. Nous montrons que les ajustements de prix ont lieu majoritairement dans les trois mois qui suivent le vote d’une augmentation de salaire minimum. Les prix des pro-duits consommés par les ménages à bas revenus augmentent autant que ceux consommés par les ménages à hauts revenus. Les augmentations de prix dans les supermarchés diminuent de 3 à 12% les gains de revenus nominaux liés à l’augmentation du salaire minimum, en fonction de la catégorie de revenus du ménage. Nos résultats suggèrent que ce sont principalement les consommateurs – et non pas les entreprises – qui payent le prix de l’augmentation du salaire minimum.
Le troisième chapitre de cette thèse est une calibration d’un modèle du marché du travail qui permet de simuler les effets d’une augmentation du salaire mini-mum au niveau fédéral à $15 d’ici 2024 aux États-Unis. Nous prenons en compte comment les travailleurs, les entreprises et les consommateurs sont affectés par les augmentations de salaire minimum et comment ils y répondent dans un mo-dèle intégré. Il s’agit de comparer les niveaux d’emploi obtenus si la réforme est adoptée aux niveaux d’emploi obtenu si la réforme n’est pas adoptée. Nous analysons en particulier les effets d’un salaire minimum à $15 au Mississippi, un des États les plus pauvres des États-Unis. Nous trouvons qu’une augmentation
de salaire minimum à $15 au niveau fédéral d’ici 2024 génèrerait une augmen-tation significative des conditions de vie de 41.5 millions de travailleurs et leurs familles, alors que l’ampleur des destructions d’emplois serait limitée et que les augmentations de prix seraient absorbées par l’ensemble des consommateurs. Les effets obtenus au Mississippi seraient similaires. Une augmentation progressive du salaire minimum à $15 serait absorbée en partie par des réductions de turno-ver des employés, des augmentations de productivité, et majoritairement par des augmentations de prix (en particulier dans la restauration) et une augmentation des dépenses de consommation de la part des travailleurs à bas salaires.
Chapter 1
Minimum Wages and
Racial Inequality
Abstract: The earnings difference between black and white workers fell dramat-ically in the United States in the late 1960s and early 1970s. This paper shows that the extension of the minimum wage played a critical role in this decline. The 1966 Fair Labor Standards Act extended federal minimum wage coverage to agri-culture, restaurants, nursing homes, and other services which were previously uncovered and where nearly a third of black workers were employed. We digi-tize over 1,000 hourly wage distributions from Bureau of Labor Statistics industry wage reports and use CPS micro-data to investigate the effects of this reform on wages, employment, and racial inequality. Using a cross-industry difference-in-differences design, we show that wages rose sharply for workers in the newly covered industries. The impact was nearly twice as large for black workers as for white. Within treated industries, the racial gap adjusted for observables fell from 25 log points pre-reform to zero afterwards. Using a bunching design, we find no effect of the reform on employment. We can rule out significant dis-employment effects for black workers. The 1966 extension of the minimum wage can explain more than 20% of the reduction in the racial earnings and income gap during the Civil Rights Era. Our findings shed new light on the dynamics of labor market inequality in the United States and suggest that minimum wage policy can play a critical role in reducing racial economic disparities.
1. Introduction 2
1
Introduction
One of the most striking dimensions of inequality in America is the persistence of large racial economic disparities (Bayer and Charles,2018;Chetty et al.,2018).1
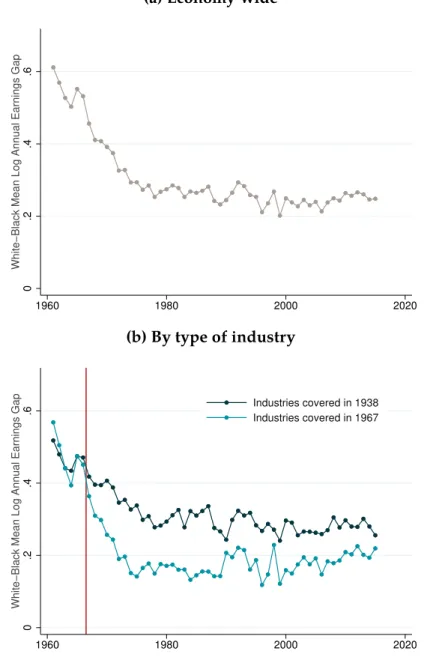
A major aspect of these disparities is the earnings difference between black and white workers. There is a 25% gap between the average annual earnings of African American and white workers today.2 Over the last 70 years, this gap fell significantly only once, during the late 1960s and early 1970s, when it was reduced by a factor of about two. What made the black-white earnings gap fall? Understanding the factors behind this historical improvement may provide insights for reducing the large racial disparities that still exist today.
A large literature has put forward various explanations for the decline in racial inequality during the 1960s and 1970s, including federal anti-discrimination legislation (Freeman, 1973) and improvements in education (Card and Krueger,
1992). The magnitude of the decline, however, remains a puzzle (see Donohue
and Heckman, 1991, and our discussion of the related literature in Section 2
below).
This paper provides a new explanation for the falling racial earnings gaps during this period: the extension of the federal minimum wage to new sectors of the economy. The Fair Labor Standards Act of 1966 introduced the federal minimum wage (as of February 1967) in sectors that were previously uncovered and where black workers were over-represented: agriculture, hotels, restaurants, schools, hospitals, nursing homes, entertainment, and other services. These sectors employed about 20% of the total U.S. workforce and nearly a third of all black workers. Perhaps surprisingly, the role of this major reform in the much studied decline in racial inequality during the Civil Rights Era has not been analyzed before. We show that it had large positive effects on wages for
1This chapter was written with Ellora Derenoncourt.
2The racial earnings gap is measured here as the mean log annual earnings difference between black and white workers (i.e., conditional on working) using the 2016 Annual Social and Economic Supplement of the Current Population Survey.
1. Introduction 3 low-paid workers, and that the effects were more than twice as large for black workers compared to white. Our estimates suggest that the 1967 extension of the minimum wage can explain more than 20% of the decline in the racial earnings gap during the late 1960s and early 1970s. Moreover, we find that this reform did not have detectable adverse employment effects on either black or white workers. The extension of the minimum wage thus not only reduced the racial earnings gap (the difference in earnings for employed individuals) but also the racial income gap (the difference in income between black and white individuals, whether working or not). Our paper provides the first causal evidence on how minimum wage policy affects racial income disparities.
Our contribution in this paper is twofold. First, we provide an in-depth analysis of the causal effect of the 1967 extension of the minimum wage—a large natural quasi-experiment—on the dynamics of wages and employment. To conduct this analysis, we use a variety of data sources and research designs that paint a consistent picture. A key data contribution of the paper is to assemble a novel dataset on hourly wages by industry, occupation, gender, and region. In the 1960s, 1970s, and 1980s, the Bureau of Labor Statistics (BLS) published regular industry wage reports with detailed information on the distribution of hourly wages by 5 and 10 cents bins, including the number of workers employed in each of these bins. For the purpose of this research we digitized more than 1,000 of these tabulations. This new data source allows us to provide transparent and robust evidence on the effects of the 1967 minimum wage extension on wages and employment. We also rely on micro-data from the March Current Population Survey (CPS), which allow us to investigate how the effects of the reform vary with race and other socio-economic characteristics such as education. Taken together, the CPS and BLS data enable us to provide consistent and clear graphical evidence on the short- and medium-term impacts of the extension of the minimum wage. The analysis proceeds in two steps. First, we show that the 1967 reform had a large effect on wages for workers at the bottom of the earnings distribution. Our
1. Introduction 4 newly digitized BLS data reveal clear evidence of an immediate and sharp hourly wage increase for low-paid workers: a large mass of workers paid below $1 in 1966 (the level of the minimum wage introduced in 1967) bunches at $1 in 1967. To quantify the magnitude of the wage effect, our baseline empirical approach is a cross-industry difference-in-differences research design: we compare the dynamics of wages in the newly vs. previously covered industries, before and after 1967. In the CPS data, the average annual earnings of workers in the 1938 industries (our control group) evolve in parallel to the annual earnings of workers in the industries covered in 1967 (our treated group) before the reform. In 1967, they jump by 6% relative to the control industries and the effect is permanent through to the late 1970s. The magnitude of the wage increase is consistent with the predicted mechanical effect of the minimum wage hike estimated using the pre-reform CPS. We obtain an identical differential increase in average hourly wage in the newly covered industries using the BLS data. We estimate that 16% of workers in the treated industries are affected by the reform and that they receive a 34% wage increase on average in 1967. The wage effect on treated workers is large because before 1967, many of them (predominantly black workers) were employed at wages far below the federal minimum wage of $1 introduced in 1967. The wage increase in the newly covered industries is concentrated among workers with a low level of education. The magnitude of the wage effect is robust to a series of tests and to controlling for a wide range of observable characteristics and time trends.
In a second step, we study the effect of the 1967 minimum wage extension on employment. Using our BLS data, we implement a "bunching estimator" (followingHarasztosi and Lindner,2017). Within treated industries, we compare the 1966-1967 evolution of the mass of workers employed at or just above the minimum wage (who were affected by the reform) to the evolution of the mass of workers employed higher up in the distribution (who were not affected). The large number of workers bunching at the newly introduced minimum wage in
1. Introduction 5 1967 suggests that the minimum wage did not significantly reduce employment among low-wage workers, despite the sharp increase in wages. If anything, the reform appears to have had slight positive employment effects. Employment expanded in the newly covered industries (slightly faster than in the control industries), and employment at the bottom of the distribution expanded slightly faster than employment at the top. Our finding of small (possibly positive) employment responses is robust to considering alternative assumptions on the extent of the spillover effects of the minimum wage and the counterfactual trends in employment growth.
We confirm our core results of large wage effects and small employment effects in a different research design. Just as today, some states had their own minimum wage laws (on top of the federal minimum wage) in the 1960s while others did not. This variation made the 1967 reform more or less binding across states. We build a minimum wage database by state, industry, and gender spanning the 1950-2016 period. We compare states without a state minimum wage law as of January 1966 (strongly treated) to other states (weakly treated). Because the federal minimum wage was high in the late 1960s (much higher than today relative to the median wage), the 1967 reform is a particularly large shock in the strongly treated states. In this research design, the 1967 reform has a precise zero effect on employment. We are able to rule out employment elasticities greater than -0.1. The results hold for black workers in isolation, for whom employment elasticities greater than -0.2 can be ruled out.
The second—and most important—contribution of the paper is to uncover the key role of minimum wage policies in the dynamics of racial inequality. We show that the extension of the minimum wage during the Civil Rights Era can explain more than 20% of the decline in the unadjusted black-white earnings gap observed during this critical period of time. The reform reduced the gap through two channels. First, the gap between the average wage in the treated industries and the rest of the economy fell. Because black workers were over-represented
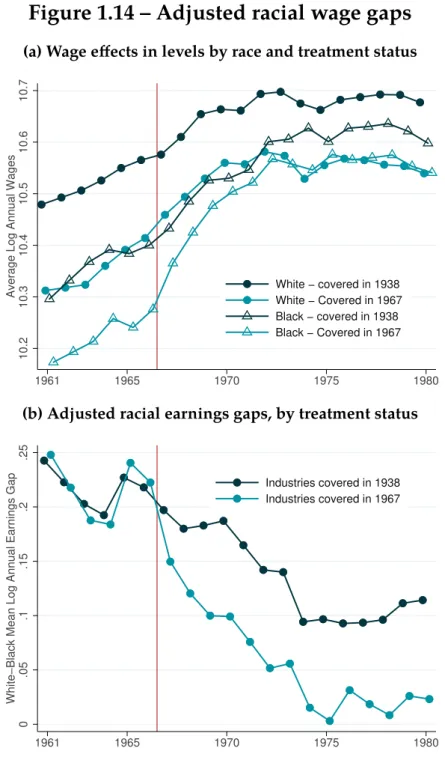
1. Introduction 6 in the treated industries, this between-industry convergence reduced the U.S.-wide racial gap. Second, within the newly covered industries the wage increase is much larger for black than for white workers, and hence the reform sharply reduces the unadjusted racial gap within the treated industries. This within-industry effect accounts for more than 80% of the impact of the reform on the economy-wide racial gap. The reform also sharply reduces the adjusted racial earnings gap (i.e., the difference in earnings between black and white workers conditional on observable characteristics) within the treated industries, from 25 log points prior to 1967 to about 0 after. That is, within agriculture, laundries, etc., black workers were paid 25 log points less than white workers with similar observables (such as education, experience, number of hours worked, etc.) when the federal minimum wage did not apply, and this difference falls to close to zero after the introduction of the federal minimum wage.
Since the reform does not appear to have had significant adverse effects on black employment, the decline in the racial earnings gap translates into a similar decline in the racial income gap. The 1967 reform was thus effective at advancing black economic status.
We discuss potential explanations for the large effect of the minimum wage on racial inequality. One hypothesis is that prior to the reform, whites colluded to pay black workers low wages (below their average product) in the uncovered industries, particularly in the South. White collusion before 1967 could ratio-nalize the low dis-employment effects of the reform. The introduction of the minimum wage reduced the possibilities of discrimination against black workers in agriculture, nursing homes, and other newly covered sectors. This insight potentially provides a new theoretical justification for minimum wage legisla-tions when governments are concerned about forms of inequality that cannot be addressed directly through income-based tax and transfer policies. Our goal, in the years ahead, is to extend our analysis to other countries and time periods to better understand the conditions under which the minimum wage can be
effec-2. Related Literature 7 tive at reducing discrimination and inequality on the labor market (such as across gender or across U.S.-born vs. immigrant workers).
The remainder of the paper is organized as follows. We start by relating our work to the literature in Section2. Section3presents background information on the 1966 amendments to the Fair Labor Standards Act and describes the datasets used in this research. We study the effects of the reform on wages in Section4and its effects on employment in Section5. Section 6 quantifies the role of the 1967 extension of the minimum wage in the decline of the racial earnings and income gap and discusses potential explanations for our findings (e.g., white collusion). Section7concludes.
2
Related Literature
Our paper lies at the intersection of two core literatures in labor economics: racial inequality and the economic effects of the minimum wage.
A
Literature on Racial Inequality and the Civil Rights
Move-ment
A large body of work seeks to understand what caused the decline in the racial earnings gap during the Civil Rights Era, a period that saw major policy and economic changes. Two types of explanations have been put forward: changes in the demand side of the labor market vs. changes in the supply side.
Demand side of the labor market. A cornerstone of the Civil Rights movement was the introduction of federal anti-discrimination policies. Title VII of the 1964 Civil Rights Act prohibited both employment and wage discrimination based on race.3 It was enforced by the Equal Employment Opportunity Commission
3Title VII also prohibited employment and wage discrimination based on sex, color, religion and national origin.
2. Related Literature 8 (EEOC) created in 1965.4 Executive Order 11246, issued in 1965 and enforced by the Office of Federal Contract Compliance, required U.S. government contractors to prohibit discriminatory practices in hiring and employment and introduced affirmative action for government contractors (Ashenfelter and Heckman, 1976;
Burman, 1973; Goldstein and Smith, 1976; Heckman and Wolpin, 1976).5 The
role of state fair-employment practices commissions was expanded, as the EEOC started referring cases to these commissions (Landes,1968;Heckman,1976).
A number of studies investigated whether these anti-discrimination policies increased the relative demand for black workers (Freeman, 1973;Freeman et al.,
1973; Vroman, 1974; Freeman, 1981; Brown, 1984; Heckman and Payner, 1989;
Smith and Welch, 1986; Wallace, 1975; Butler and Heckman, 1977). This
lit-erature focuses on employment outcomes rather than on the racial gap itself. Other studies (see, e.g.,Donohue and Heckman, 1991; Wright, 2015; Aneja and
Avenancio-Leon,2018) also considered the role of the Voting Rights Act of 1962
and 1965, as well as other federal initiatives (such as school desegregation) in narrowing the racial gap.
One key difficulty faced in this literature is the fact that federal govern-ment policies affected the nation as a whole, making it difficult to identify their causal impact.6 It is also difficult to obtain good measures of government anti-discrimination activity. Most of the literature used either sparse intercensal wage data or aggregated time series that make it difficult to isolate the contribution of these policy changes at the macro level.7
4Most employers were covered by the Equal Employment Opportunity Commission, except firms with fewer than 100 employees (later reduced to 25 and then 15 employees), firms not engaged in interstate commerce, the self-employed, and state and local governments. Unions and employment agencies were covered.
5Discrimination on the basis of sex became part of the contract-compliance program in 1967. Affirmative action against sex discrimination was required in 1971.
6The identification problem is particularly acute for studies of the role of the Equal Employment Commission, as Title VII covers all firms in the economy. Heckman and Wolpin(1976) also showed that it is difficult to assess the causal impact of the OFCC as the contract status of a firm is endogenous (government contracts are awarded to less discriminatory firms).
7A notable exception isHeckman and Payner(1989), who focused on the textile manufacturing industry in South Carolina. They were, however, unable to infer economy-wide estimates based on this study.
2. Related Literature 9 Supply side of the labor market. On the supply side, the literature has identi-fied two important developments contributing to the decline in the racial gap.
First, educational outcomes improved for African Americans. Smith and
Welch(1989);Lillard et al.(1986) emphasize the relative increase in the number
of years of schooling for black workers. They concluded that an increase in school quantity can explain about 20-25% of the narrowing of the black-white wage gap in the late 1960s. Card and Krueger (1992; 1993) find that about 15-20% of the reduction in the racial wage gap owes itself to improvements in school quality for black children.8 Moreover, a body of work argues theoretically that the returns to schooling could have increased for black workers during the 1960s as a result of the tightening of the labor market (Osborne, 1966; Tobin, 1965; Friedman,
1962). Heckman and Payner(1989) do not find empirical support for this theory,
however.
Second, the increase in income transfers in the context of President Johnson’s Great Society may have led to a reduction in the labor force participation of black workers with low levels of education (Butler and Heckman,1977). Donohue and
Heckman(1991) find that this factor can explain about 10%-20% of black-white
wage convergence during the Civil Rights movement. Other supply shift stories, such as northern migration of African Americans, have been found to play a minor role.9 Overall,Donohue and Heckman(1991) find that supply-side factors can explain about 55% of the decline in the racial gap during the Civil Rights Era. Our study pushes the literature forward in two directions. First, our paper is the first to highlight the role played by the 1967 minimum wage extension in the decline of racial inequality. This factor turns out to be quantitatively important, comparable in size to the impact of improvements in school quality found byCard
and Krueger(1992) and in school quantity found bySmith and Welch(1986). Our
8Card and Krueger(1992) do not find evidence of any contribution of the relative increase in school quantity to the reduction in the racial earnings gap in the late 1960s.
9Smith and Welch(1986) note that northern migration actually slowed in the mid-1960s; their table 18 shows that the percentage of black men living in the South was 74.8 in 1940, 57.5 in 1960, and 53.1 in 1980.
2. Related Literature 10 paper moves us closer to a full quantitative understanding of what caused the decline in the racial earnings gap in the 1960s.
Second, our study solves a key puzzle in the literature on the dynamics of racial inequality. Figure1.1a plots the evolution of the unadjusted racial earn-ings gap since the early 1960s, measured as the mean log difference in average annual earnings between white and black workers. As is apparent from this figure, a lot of the decline happened in just one year: 1967. Neither the demand nor supply factors described above can easily explain the specific timing of the reduction in the racial earnings gap. Anti-discrimination policies were rolled out gradually from 1964 onwards; the enforcement powers of the Equal Employment Opportunity Commission gradually increased over time (Wallace, 1975; Butler
and Heckman, 1977).10 Similarly, there is no sudden change in schooling
quan-tity or quality for blacks in 1967; educational improvements occurred gradually. Income transfers also rose progressively throughout the 1960s and 1970s.11 By contrast, the 1967 extension of the minimum wage can explain why a lot of the de-cline in the racial earnings gap took place in 1967. Figure1.1bshows indeed that the unadjusted racial earnings gap fell sharply in the newly covered industries relative to the previously covered ones precisely in 1967.
B
Minimum Wage Literature
A huge literature studies the economic effects of the minimum wage. Our paper contributes to this literature in several ways.
First, our study is the first to provide causal evidence on how minimum wage
10It is only in 1972 that the Equal Employment Opportunity Commission was given the power to initiate litigation. Before 1972, it could not file lawsuits to enforce Title VII and could only refer cases to the Justice Department or briefs as “friends of the court," seeBrown(1982). The EEOC’s backlog of complaints increased gradually over the late 1960s and 1970s (see, e.g., p. 211 of the U.S. Civil Rights Commission, 1977: https://www2.law.umaryland.edu/marshall/ usccr/documents/cr12en22977.pdf.
11Medicare and Medicaid were introduced in 1966, but were initially small quantitatively (1.7% of all government transfers in 1966) before gradually increasing to 4.8% of all transfers in 1970, 6.4% in 1975, and 8.2% in 1980. See table II-C3b inPiketty et al. (2018) available at
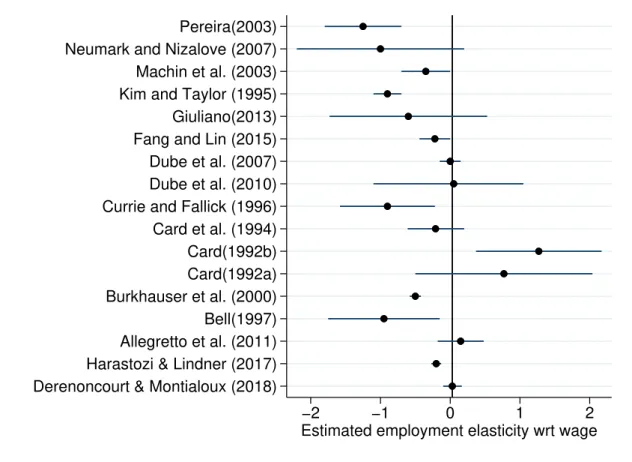
2. Related Literature 11 policy can affect racial economic disparities. A large body of work discusses the efficiency costs of the minimum wage and focuses on its employment effects (see, e.g., Card, 1992; Card et al., 1993; Neumark and Washer, 1992; Card and
Krueger,1995;Neumark and Washer,2008;Dube et al.,2010;Cengiz et al.,2018).
The literature also studies the effects on wage inequality (see, e.g., Blackburn
et al.,1990;DiNardo et al.,1996;Lee,1999;Autor et al.,2016) and family incomes
(Gramlich,1976;congressional budget office,2014;Dube,2017). But the interplay
between the minimum wage and racial inequality has not been investigated in a causal research design thus far.
Second, our paper provides evidence on the economic effects of very large minimum wage increases. The 1967 reform is a large shock to the treated in-dustries in states that did not have a state minimum wage, because for them the wage floor moves from zero to the prevailing federal minimum wage, which was at a high level in the late 1960s. On top of extending the minimum wage to new sectors, the 1966 FLSA increased the federal minimum wage from $1.25 in 1966 to $1.4 in 1967 and $1.60 from 1968 on (the equivalent of $9.91 in 2017 dollars, i.e., its historical peak). In ongoing work,Bailey et al. (2018) investigate how the high nation-wide minimum wage mandated by the 1966 Fair Labor Standards Act affected employment, exploiting state-level differences in the bite of a national minimum wage due to differences in standard of living. Their results show little evidence of disemployment effects for men, consistent with our results. Since our paper focuses on different questions (the impact of the minimum wage on the black-white income gap, and the effect of the 1967 reform on the newly covered in-dustries), uses different research designs (cross-industry difference-in-differences and bunching) and relies in part on different data (our newly digitized BLS tabu-lations), we view our projects as complementary. More broadly, we contribute to a recent literature that analyzes sharp changes in the minimum wage, either in the United States at the city level (see, e.g.,Jardim et al.,2018) or in foreign countries (e.g.,Harasztosi and Lindner, 2017;Engbom and Moser, 2018). Evidence about
3. The 1967 Extension of the Minimum Wage and Data 12 the effects of large hikes can help inform current policy discussions in the United States, where a number of both local and federal policy-makers are implementing or considering large increases in minimum wages.
Third, we add to the burgeoning literature on bunching estimation applied to the minimum wage. One of the advantages of the bunching approach is that it offers transparent graphical evidence on the employment effects of minimum wage hikes within large industries.12 We are also able to track where in the wage distribution jobs were created or destroyed.
Finally, we contribute a new database of minimum wage legislation by state, industry, and gender spanning the 1950-2016 period. Looking forward, this database could be used to exploit historical changes in minimum wage legislation across industries or gender (in contrast to the bulk of the literature that focuses on cross-state variation).
3
The 1967 Extension of the Minimum Wage and Data
A
The 1966 Fair Labor Standards Act
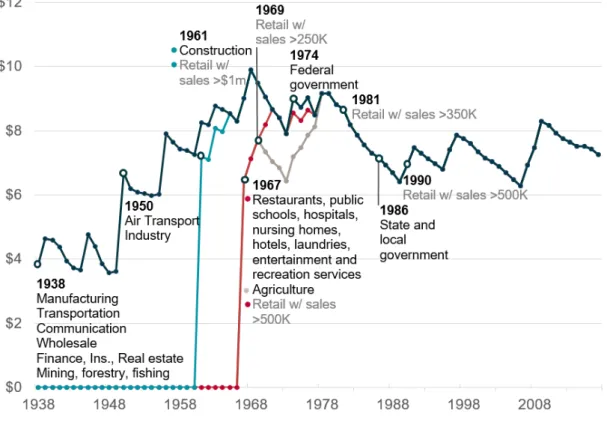
Political economy of the reform. The Fair Labor Standards Act (FLSA) of 1938 introduced the federal minimum wage in the United States. Millions of workers became subject to a wage floor. The coverage of the Act, however, was incom-plete: a number of sectors were excluded. The 1938 FLSA covered about 53% of the U.S. workforce (see figure 1.3) in the manufacturing, transportation and communication, wholesale trade, finance and real estate sectors (see the complete list of covered sectors in figure1.2). President Roosevelt intended to cover the economy as a whole but faced resistance in Congress, particularly from Southern Democrats (Phelps, 1939). The law enacted in 1938 stipulates that only employ-ees engaged in interstate commerce or the production of goods for interstate
12By contrast, the bulk of the literature has focused on teen employment or workers in specific industries, typically restaurants (Abowd et al.,2000;Allegretto et al.,2017;Neumark et al.,2014).
3. The 1967 Extension of the Minimum Wage and Data 13 commerce be covered (Daugherty, 1939). In practice, this meant that a number of sectors where black workers were overrepresented, such as agriculture, were excluded. The 1938 Fair Labor Standards Act, as a number of other programs passed in the 1930s and 1940s, had a discriminatory dimension (Katznelson,2006;
Mettler,1994;Rothstein,2017).
Over time, a series of amendments to the 1938 FLSA extended the minimum wage to the rest of the economy. In this paper, we focus on the 1966 FLSA amendments, the largest expansion of the federal minimum wage.13 The 1966 FLSA amendments introduced the federal minimum wage (as of February 1st, 1967) in the following sectors: agriculture, nursing homes, laundries, hotels, restaurants, public schools, and hospitals. These sectors employed about 8 million workers (see figure 1.3) in 1967, or about 21% of the U.S. workforce. Critically, nearly a third of all U.S. black workers worked in the sectors covered for the first time in 1967, compared to about 18% of all U.S. white workers. Conscious of this, President Johnson declared when signing the amendments that: “[The minimum wage law] will help minority groups who are helpless in the face of prejudice that exists. This law, with its increased minimum, with its expanded coverage will prevent much of th[e] exploitation of the defenseless—the workers who are in serious need" (Johnson,1966).
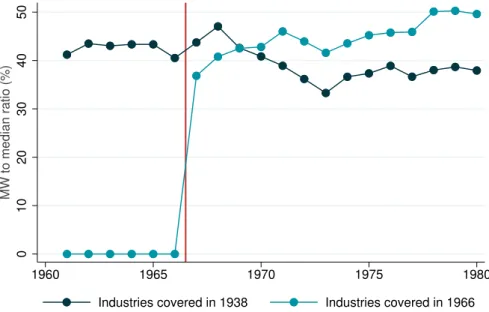
A sharp change in minimum wage policy. The 1967 extension of the minimum wage represented a sharp increase in the minimum wage in many sectors of the economy. The ratio between the federal minimum wage and the median wage rose from 0% to 38% in 1967 in the newly covered industries (see figure 1.5). The minimum wage introduced in these sectors in 1967 ($1) was initially below the federal minimum wage, but converged to the level of the federal minimum
13Using CPS data, we estimate that 53% of the U.S. workforce was covered by the 1938 FLSA as of 1966, an additional 16% was covered by the 1961 amendments (which introduced the minimum wage in retail trade and construction), and an additional 22% by the 1966 amendments, which are the focus of this research. The remaining 9% of the workforce (domestic workers, and workers in public administration) were covered after 1966.
3. The 1967 Extension of the Minimum Wage and Data 14 wage by 1971, except in agriculture where convergence was only complete in 1977. 14As a result, the ratio between the federal minimum wage and the median wage continued to increase in the newly covered sectors over time and reached 40%-50% during the 1970s, a level close to the one seen in the industries that were covered in 1938.
B
Data Used in our Analysis
We use four data sources to study the 1967 extension of the minimum wage: in-dustry wage reports published by the Bureau of Labor Statistics that we digitized; Current Population Survey micro-files going back to 1962; U.S. decennial census data; and data on state minimum wage legislation by industry and gender. Bureau of Labor Statistics industry wage reports. The BLS conducted regular establishment surveys in the 1960s, 1970s, and 1980s to monitor the implemen-tation of the amendments to the Fair Labor Standards Act of 1938. The surveys were requested by the Department of Labor’s wage and public contracts divisions. The BLS focused on collecting information on the distribution of employer-paid hourly earnings.15 Hourly earnings exclude premium pay for overtime, work on weekends, holidays and late shifts. Our data come in the form of tabulations that provide detailed distributions of hourly earnings by 5- and 10-cent bins and the number of workers in each bin. The hourly wage distributions are available for the United States as a whole and by regions (Northeast, Midwest, South and West), occupations (e.g., tipped workers vs. non-tipped workers for the restaurant and hotel industries; inside-plant workers vs. office workers in laundries; bus drivers; clerical employees; food servers; custodial employees; maintenance employees in schools, etc.), gender, and type of area (metropolitan vs. non-metropolitan).
14In all sectors except agriculture, the minimum wage was introduced at $1 an hour in February 1967. Then the minimum wage was raised annually in 15 cent-an-hour increments, effective each February 1 through 1971, to $1.60 an hour.
15In addition, the BLS collected information on weekly hours of work, and supplementary wage practices, such as paid holidays and vacation, health insurance and pension plans.
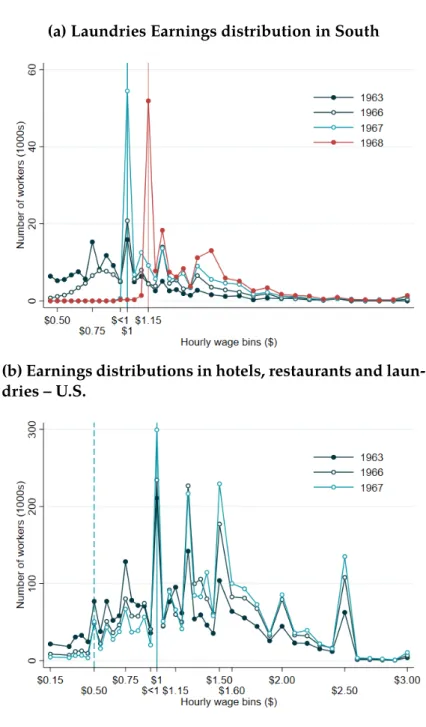
3. The 1967 Extension of the Minimum Wage and Data 15 Figure 1.6a shows an example of the raw tabulations for the laundries sector. The BLS data allow us to transparently study the evolution of the hourly wage distributions in each sector over time and to investigate the heterogeneity of the impact of the 1967 reform across many dimensions.
For the purposes of this project, we digitized over 1,000 hourly wage earnings distributions every year from 1961 to 1969.16. We built a database of hourly wage distributions for the industries covered in 1967, as well as for a set of industries covered in 1938—mainly from non-durable, low-wage manufacturing sectors;17
see figure1.6b.
Current Population Survey data. The Census Bureau and the Bureau of Labor Statistics have conducted the Current Population Survey—a monthly household survey—since the 1940s. However, public use files are only available for the years 1962 and onwards. We use data from the March CPS, more precisely the Integrated Public Use Microdata Series (IPUMS) from 1962-1980.18 IPUMS released the 1962-1967 files with a harmonized industry variable in 2009. Since incomes in the March CPS of year t refer to incomes earned in calendar year t − 1, we can track annual earnings from 1961 onwards (e.g., starting six years before the 1967 extension of the minimum wage). We study earnings through to 1980, i.e., two years after the full convergence of the minimum wage in agriculture to the federal minimum wage level.
One advantage of the CPS over the BLS tabulations is that it provides rich in-dividual worker-level data, e.g., gender, race, and education levels (30 categories). We harmonized industry classifications across years; our harmonized industry
16We collected the BLS Industry Wage reports from: https://fraser.stlouisfed. org/series/5293#4603 Another resource is: https://libraryguides.missouri.edu/ pricesandwages/1970-1979
17More precisely, we digitized data for cigars, cotton textiles, flour and grain mills, hosiery, leather tanning, men’s and boys’ suits and coats, men’s and women’s footwear, men’s and boys’ shirts, miscellaneous plastic products, and wood household furniture. About 35 more industries are also available.
3. The 1967 Extension of the Minimum Wage and Data 16 variable includes 23 different industries.19 This is thinner than the 2-digit NAICS code but a bit coarser than the 3-digits NAICS code. For instance, we are able to separate restaurants from the rest of the retail sector, but we cannot separate hotels and lodging places from laundries and other professional services due to data limitations in the 1962-1967 CPS. The BLS industry wage reports have hourly wage information for more detailed sectors.
There are three main limitations involved in using March CPS data to analyze the 1967 reform:
First, we only directly observe annual earnings in the CPS files of the 1960s and early 1970s, not hourly wages.20 In the CPS regressions shown below, our main outcome of interest will thus be annual earnings, and we will control for the number of weeks worked and the numbers of hours worked within a week. As we shall see, the wage effects of the reform estimated using the CPS will turn out to be very consistent with the effect on hourly wages seen in the BLS industry wage reports.
Second, pre-1968 CPS micro files have less observations than in later years, increasing the level of noise compared to more recent years. There is a slight difference in employment counts between the 1960 Census data and the early CPS files. However, the employment shares by industry and race match the information contained in the decennial census data. Further, we have checked that CPS employment is consistent in both levels and shares with the 1970 and 1980 censuses. The limitation of the CPS in the early 1960s does not affect our cross-industry or cross-State difference-in-differences point estimates, but it increases standard errors for the years 1962-1967.
19We used the information contained in the original industry variable from 1962 to 1967 and in the industry variable created by IPUMS from 1968 onwards that recodes industry information into the 1950 Census Bureau industrial classification system. For more information about the construction of the integrated industry codes in IPUMS starting in 1968, seeusa.ipums.org/ usa/chapter4/chapter4.shtml.
20The CPS started to collect information on hourly and weekly earnings in 1973 in the May supplement of the survey. Starting in 1979, the earnings questions were asked each month for people in the outgoing rotation groups.
3. The 1967 Extension of the Minimum Wage and Data 17 Third, from 1968 to 1976, the IPUMS data report information by state groups as opposed to states. We have information for 21 state groups across all years. The states that were grouped together were small (e.g., large states such as California and New York are always one single state) and geographically close to each other. We checked that the borders of the state groups do not cross region or division lines. Importantly, we checked that the states within each group had similar state minimum wage policies. Thus this data limitation is unlikely to be a threat to our cross-State empirical strategy. In our analysis using CPS data, for simplicity we use the term "states" to refer to "state groups."
U.S. Census data. We use the 1-100 national random sample of the population from the 1940, 1950, 1960, 1970, and 1980 decennial censuses to compute the share of workers covered by the Fair Labor Standards Act of 1938 and its subsequent amendments.21 We also use Census data to show that the employment shares by industry, gender, and race in 1960 are consistent with the early CPS files. More details are provided in the appendix.
Minimum wage database. We use the report of the minimum wage study
commission (1981) to build our minimum wage database by state, gender, and industry.22 We supplement it with the Department of Labor Handbook on women workers (1965).23 In 1965, 31 states and the District of Columbia had minimum wage laws. Details are provided in the appendix.
21Census data were accessed from the IPUMS website at https://usa.ipums.org/ usa-action/samples, with variables—in particular the industry variable—harmonized with the
CPS files, seeRuggles et al.(2018).
22The report was downloaded from https://cpb-us-e1.wpmucdn.com/blogs.rice.edu/ dist/f/3154/files/2015/11/Minimum-Wage-Study-1983-Carter-Administration-1hkd1cv. pdf.
23Accessible here: https://fraser.stlouisfed.org/files/docs/publications/women/ b0290_dolwb_1965.pdf.
4. The Wage Effects of the 1967 Reform 18
4
The Wage Effects of the 1967 Reform
A
Identification Strategy, Sample, and Summary Statistics
We start by studying the effect of the 1967 extension of the minimum wage on the dynamics of wages in the CPS. Our baseline empirical approach is a cross-industry differences-in-differences research design: we compare the dynamics of wages in the newly vs. previously covered industries, before and after 1967. The identification assumption is that absent the 1967 reform, wages in the 1967 indus-tries (treated) and in the 1938 indusindus-tries (control) would have evolved similarly. We provide graphical evidence that wages in the two groups evolved in parallel before 1967, lending support to our identification assumption (see figure1.7). We also show that workers do not move from one group of industries to the other around 1967. There is no discontinuity in the share of U.S. workers employed in the treated vs. control industries (figureA18a), nor in the share of black and white workers in those groups (figureA18b). As discussed below, our effects are robust to the inclusion of a wide range of controls and time-varying effects, such as state, industry, and race linear trends, making it unlikely that our effects are confounded by contemporaneous changes differentially affecting workers in the treated vs. control industries.
Our sample includes all prime-age workers, i.e., aged 25 to 55. Before age 21, workers were subject to a different, lower minimum wage that is not the focus of our study. We also exclude the self-employed, workers in grouped quarters, unpaid family workers, and individuals working less than 13 weeks a year and less than 3 hours a week (to remove noise generated by very low annual wages). Throughout the analysis, control industries include all industries that were covered in 1938 (that is, we exclude from the analysis the industries covered in 1961, 1974, and 1986, which together employed about 25% of the workforce). As shown by table1.3, our results are not sensitive to these sample restrictions.
4. The Wage Effects of the 1967 Reform 19 All wages are converted to 2017 dollars, using the CPI-U-RS price index from the Bureau of Labor Statistics.
Table 1.2 presents summary statistics; the data are averaged over 1965 and 1966. On the eve of the 1967 extension of the minimum wage, workers in the 1967 industries (our treated group) were paid 30% less on average than workers in the 1938 industries (control). The difference in average annual earnings between black and white workers was the same in both groups of industries. Female work-ers were overrepresented in the industries covered in 1967, among both white and black workers. In both the control and treated industries, black workers were less educated than white on average (around 40-45% have more than 11 years of schooling vs. 65-75% for white workers). The distribution of white individuals across regions is the same in the treatment and control groups. Black workers were predominantly in the South, and those working in the treated industries were more concentrated in the South (56%) than those working in the control industries (42%). White and black workers were employed in different occupa-tions. Finally, the majority of workers worked full-time, full-year. However, the share of full-time, full-year workers was higher in the treated industries (88% for white and 79% for black workers) than in the control industries (69% for white and 67% for black workers).
We estimate the following difference-in-differences model:
log wijst= α + 19 X
k=1
βkCovered 1967j × δt+k+ νj+ λt+ X0ijstΓ + εijst (4.1)
where log wijstdenotes the log annual earnings of worker i in industry j, state s, in year t.24 The dummy variable Covered 1967jequals 1 if worker i works in an industry covered in 1967, 0 if they work in an industry covered in 1938. t is the year when the reform was implemented (1967), and νj and λt are industry and
24Year t corresponds to the calendar year during which income was earned, i.e. 1961 in CPS 1962, 1962 in CPS 1963, etc.
4. The Wage Effects of the 1967 Reform 20 year fixed effects, respectively. The coefficient of interest, βk, measures the effect of the 1967 reform k years after the baseline year (1961 in what follows). In all our analyses, we control for the following worker-level characteristics: gender, race, age, age squared, education, and part-time and full-time status. We also control for the number of weeks worked,25 and the number of hours worked.26
In section5 below, we show that the reform did not affect the number of hours worked per year conditional on working.27 We report standard errors clustered at the industry level to allow for arbitrary dependence of εijstacross year t within industry j. We view clustering here mainly as an experimental design issue where the assignment is correlated within the clusters; seeAbadie et al.(2017)). This is why we cluster by industry in our main specification and not by other dimensions across which there may be unobserved heterogeneity within clusters. The clustering is at the industry rather than at the industry-year level to account for serial correlation across years (Bertrand et al.,2004).
B
Baseline Estimates of the Effect of the 1967 Reform on Wages
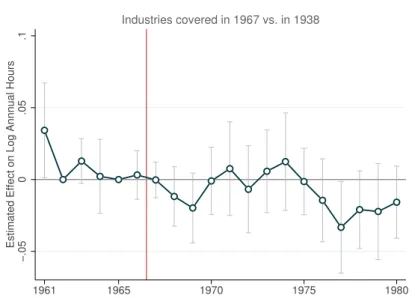
Figure1.7shows the effect of the 1967 reform on the log annual wages of treated workers relative to control workers. Before the implementation of the reform in February 1967, the annual wages of workers in the treated vs. control industries evolved in parallel: the point estimates for the years 1961-1966 are centered around 0 and are not statistically different from 0.
Starting in 1967, annual wages increased substantially—by about 5%—for
25The CPS contains information on the number of weeks worked last year, by categories: 1-13 weeks, 14-26 weeks, 27-39 weeks, 40-47 weeks, 48-49 weeks, and 50-52 weeks.
26The CPS contains information on the number of hours worked last week
27The annual number of hours worked is constructed as the ratio between the annual wage (as directly measured in the CPS) and the hourly wage (as re-constructed). We re-construct a measure of hourly wage by dividing the annual wage by the product of the number of hours worked per week and the number of weeks worked per week (measured as the midpoint of each weeks worked interval). Because we do not observe the exact number of weeks worked per year, the variance of the measure of the hourly wage thus obtained is underestimated. Therefore, we further smoothed this hourly wage measure by adding or subtracting to it a random number generated from a uniform distribution over the interval[-$0.25;$0.25] (after converting our hourly wage measure to 2017$).
4. The Wage Effects of the 1967 Reform 21 workers in the newly covered industries relative to workers in the control indus-tries. Relative wages continued to increase after 1967 through to 1971 when the treatment effect peaks (+7%). This pattern of increase is consistent with the fact that in the newly covered industries, the minimum wage was first introduced in 1967 at a level ($1 in nominal terms) below the prevailing federal minimum wage ($1.25), before gradually converging to the level of the federal minimum wage over the 1967-1971 period (except in agriculture); see figure1.2. After 1971, the point estimates stabilizes and the wage increase persists over time. Overall, the average wage of workers in the newly covered industries is 0.066 log points (i.e., 7% higher) higher relative to the average wage of workers in control industries in 1967-1972 compared to 1966 and 0.051 log points (i.e., 6%) higher in 1973-1980 relative to 1966; see table 1.3, column 1. These effects are statistically different from zero at the 5% level.
Actual vs. predicted effects. The magnitude of the wage estimates are consis-tent with the predicted wage increase obtained from assigning the 1967 minimum wage to workers in the treated industries who were below the 1967 minimum wage in 1966. We compare the actual effects of the reform to the predicted effects of the reform under the following three assumptions: first, there is perfect com-pliance with the reform; second, there is no employment effect; and finally, there are spillovers up to 115% of the 1967 minimum wage.
We start from the distribution of hourly wages in the 1966 CPS (constructed using the information available on annual earnings, the number of weeks worked, and the number of hours worked; see section27above). From there, we estimate that 16% of workers in the treated industries were below the 1967 minimum wage in 1966; see column (1) in table1.4). For these workers, the average increase involved from moving straight to the $1 nominal minimal wage introduced in 1967 is 34%; see column (2). The predicted wage effect for all workers in the treated industries is 16% × 34% = 5.5%; see column (4). This is close to the estimated
4. The Wage Effects of the 1967 Reform 22 effect of 5% found in our wage regression in 1967.28 The predicted wage effect is slightly larger than the observed effect, however, which could be due to several factors. There is measurement error in hourly wages, and there may be imperfect compliance with the reform, and effects of the reform on employment.
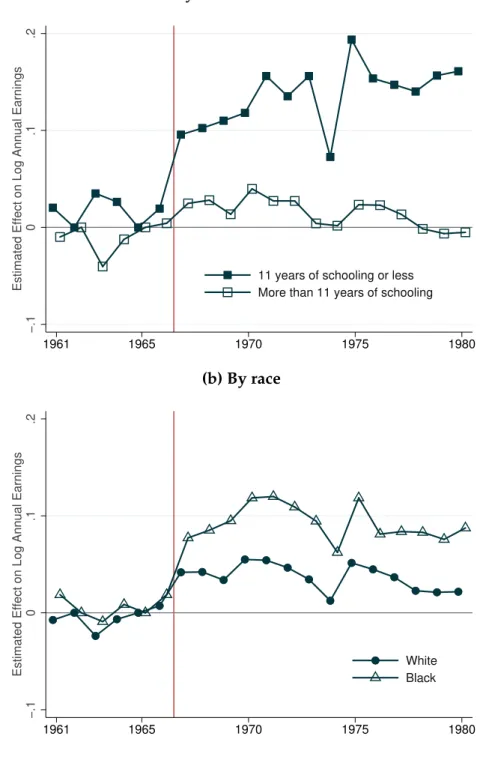
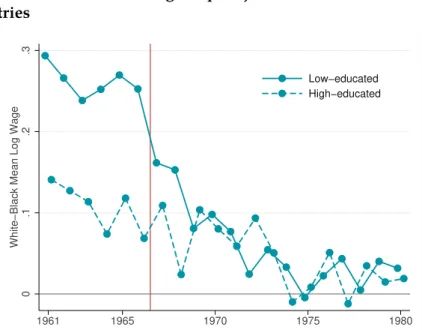
Effects by education. The wage effect shows up primarily where one would expect to see it, i.e., for workers with low levels of education. We separately estimate the above wage model for workers with 11 years of schooling or less vs. more than 11 years of schooling; see figure1.8a. For workers with low levels of education, wages increase by 10% in 1967 in the newly covered industries, above and beyond wage growth in the previously covered industries. The effect is much smaller (4% in 1967) among highly educated workers. These results are consistent with the idea that our empirical design captures the effect of the extension of the minimum wage in 1967 and not a general trend affecting all workers (including high-skill) in the 1967 industries.
Wage effects using hourly wage BLS data. We confirm our wage results using the BLS industry wage reports instead of the CPS data. We implement the same cross-industry difference-in-differences research design: we compare the dynam-ics of wages in the newly vs. previously covered industries, before and after 1967. Control industries here include non-durable manufacturing industries, which were covered by the minimum wage in 1938.29 We adapt our cross-industry
28Since we make predictions for 1967 alone, we compare the predicted effects to our wage coefficient obtained for 1967 alone (see figure1.7rather than to the pooled estimate for 1967-1972 presented in table1.3).
29Manufacturing represents more than 50% of all 1938 industries. Non-durable manufacturing represents about half of manufacturing in terms of the number of workers employed. In addition, wages in non-durable and durable manufacturing follow strictly similar trends, as can be seen in the CPS. We therefore believe that the subset of industries in the non-durable manufacturing form a good control group in this empirical setting.
4. The Wage Effects of the 1967 Reform 23 design to the nature of the BLS data by estimating the following model:
yjrt = α + β1Covered 1967j × Postt× Southr
+ β2Covered 1967j × Postt+ β3Postt× Southr + β4Covered 1967j × Southr+ νj + ηr+ λt+ εjrt
(4.2)
where yjrtdenotes log hourly wages in industry j, region r, and year t; Covered 1967j indicates whether an industry was covered in 1967; νj, ηr, and λt are industry, region, and year fixed effects. Our standard errors are clustered at the industry × region level. In addition, ˆβ4 in this specification allows us to investigate whether the wage effects are larger in the South. This regression is run on two samples: a strict sample that only includes industries with both pre- and post-reform data and years with both control and treatment industries, and a full sample including all our digitized data.
Table 1.6 shows that within the strict sample, wages in the newly covered industries jump by 8% relative to wages in non-durable manufacturing after the reform (1967-1969) relative to before. The magnitude of the rise is very similar to the 7% wage increase estimated using CPS data. The wage increase is higher for treated industries in the South relative to non-durable manufacturing industries in the non-South (+14%). The pattern and magnitude of the wage results are similar in the full sample of BLS industries.
C
Robustness Tests and Other Estimation Strategies
The main threat to our baseline identification strategy are shocks happening in 1967 that differentially affect workers in treated vs. control industries. In what follows we present a number of checks and tests for the wage effects we estimate. We first consider two types of shocks—state shocks and sectoral shocks—before considering additional checks and studying alternative research designs.
4. The Wage Effects of the 1967 Reform 24 Robustness to state shocks. If treated industries were concentrated, say, in the South and if there was a sudden convergence in wages between workers in the South and in the North in 1967, then our estimates would be confounded. To address this concern, in Column 2 of table1.3we add state fixed effects and state linear trends to the controls of our baseline model. The inclusion of state fixed effects and state linear trends does not change the magnitude or the pattern of the estimated wage effect.
Robustness to sectoral shocks. One might be concerned about shocks
hap-pening in some treated industries, such as agriculture (e.g., mechanization). In column 3 of table1.3we exclude agriculture from our sample to see whether the results still hold. We find that the magnitude of the wage effect (6%) is only a bit lower than when agriculture is included (7%). One interpretation is that there is some heterogeneity of the wage response across industries. This interpretation would be consistent with the fact that the bite of the minimum wage is higher in agriculture than in the other newly covered sectors.
Additional robustness tests. We report the following additional robustness tests. First, we vary the sample selection criteria. In Column 4 of table 1.3 we restrict the sample to full-time workers only. The point estimate (0.065 log points) is similar to the baseline estimate reported in column 1. This result suggests that the 1967 reform did not affect full-time and part-time workers differentially. In column 5, we winsorize the top and the bottom of the distribution of the outcome and the control variables at the 5% level; the point estimate remains unchanged (0.061 log points). This result shows that outliers (in particular at the bottom of the distribution) do not drive our results. In column 6, we test whether the precision of our results is robust to alternative ways of clustering standard errors. Since the intensity of the treatment varies by state, and since there might be reasons to believe that unobserved components of the annual wage for workers are
4. The Wage Effects of the 1967 Reform 25 correlated within states, we implement a two-way clustering (industry and state levels). The precision of our results is unchanged.30. Finally, followingCameron
et al.(2008) we implement a wild bootstrap approach to cluster standard errors, as
in both the state and industry dimensions we have a small number of clusters (16 clusters when clustering by industry and 22 for states). Wild bootstrap improves the precision of our estimates a bit.
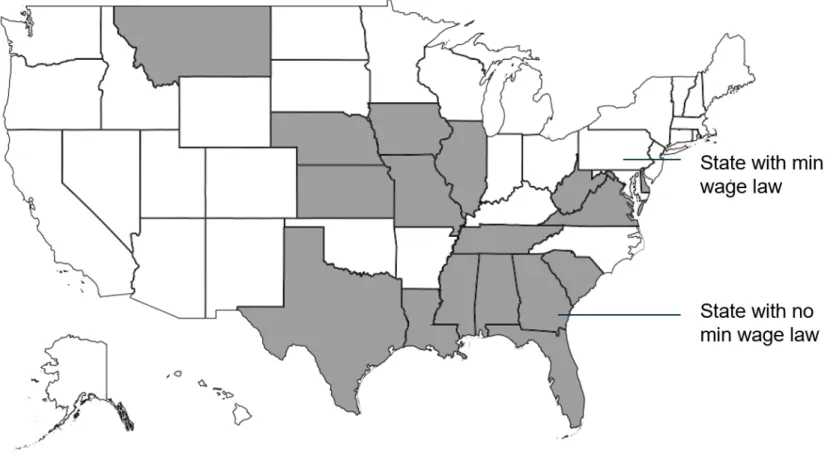
Wage effect in a cross-state research design. As a last robustness test, we con-sider another research design that leverages geographic variation in the bite of the reform. Just as today, many states had their own minimum wage law in the 1960s, thus already covering the industries that became covered by the federal law in 1967. We compare workers in states that already had a minimum wage law before the reform (weakly treated) to workers in states that did not (strongly treated). Figure1.9shows that states with no minimum wage law as of 1966 were concentrated in the South, but not exclusively; they are also present in the West and the Midwest. Our identification assumption is that absent the 1967 reform, wages in weakly and strongly treated states would have followed the same trend. We estimate the following difference-in-differences model, pooling together our estimates over three periods k, with k ∈ [1961-1966], [1967-1972] & [1973-1980]:
log wist= α + X
k
βkStrongly treated states× δt+k+ X0istΓ + νs+ δk+ εist (4.3)
where Strongly treated states is an indicator for a state with no minimum law in January 1966. The coefficient of interest, βk, measures the effect of the 1967 extension of the federal minimum wage k years after or before the year chosen as a baseline (1965 in this case). We control for the same workers’ characteristics as
30Together with the fact that the standard errors are much lower when the clustering is imple-mented at the state level rather than at the industry level, this result indicates that the correlation in the unobserved components of workers’ wages within industries is higher than the correlation in the unobserved components of workers’ wages within states
5. The Employment Effects of the 1967 Reform 26 in our cross-industry design. Standard errors are clustered at the state level. We find that wages in the strongly treated states grew on average by 3% more than in weakly treated states just after the reform and over the period 1967-1972 (see table1.5). As in our cross-industry design, the effect is concentrated on workers with low levels of education.
D
Wage Effects by Race
We now turn to our second key finding: the magnitude of the wage response to the 1967 reform is much larger for black workers (12%) than for white (5%).
To establish this fact, we run the same regression as in our benchmark cross-industry design, but for white and black workers separately (see Table1.7). That is, we compare white workers in the treated industries to white workers in the control industries, before vs. after 1967 (blue line in figure1.8b). Similarly, we compare black workers in the treated industries to black workers in the control industries (dark line in figure1.8b), controlling for observables as in our bench-mark specification. Strikingly, black workers in the treated industries saw their wage rise 12% more than black workers in the control industries starting in 1967. Because the wages of black workers in the control industries are themselves ris-ing faster than the wages of white workers in the control industries, the wage of black workers in the treated industries rises much faster (+20%) than average (black plus white) wages in the control industries (see Appendix FigureA5).
5
The Employment Effects of the 1967 Reform
A
Bunching Estimator
Methodology. We start by studying the effect of the 1967 extension of the min-imum wage on overall employment in the treated industries—and the employ-ment of low-paid workers in particular—using the BLS industry wage reports.