This article has been accepted for publication and undergone full peer review but has not been through the copyediting, typesetting, pagination and proofreading process, which may lead to differences between this version and the Version of Record. Please cite this article as doi: 10.1002/etc.4747.
Acc
ep
ted
Art
icle
19-00860 Hazard/Risk Assessment J. E. Adams et al.Toxicity of chemically-dispersed AWB and CLB to trout
Effects on trout alevins of chronic exposures to
chemically-dispersed Access Western Blend and Cold Lake Blend dilbits
Julie E. Adamsa*, Barry N. Madisona,b, Kelli Charbonneaua, Marie Sereneob, Lucie Baillonc, Valerie S. Langloisa,b,c, R. Stephen Browna,d, and Peter V. Hodsona,b
a
School of Environmental Studies, Queen’s University, Kingston, ON, Canada
b
Department of Biology, Queen’s University, Kingston, ON, Canada
c
Centre Eau Terre Environnement, Institut National de la Recherche Scientifique, Québec City, QC, Canada
d
Department of Chemistry, Queen’s University, Kingston, ON, Canada
(Submitted 29 December 2019; Returned for Revisions 09 March 2020; Accepted 05 May 2020)
Acc
ep
ted
Art
icle
ABSTRACTThis study assessed the chronic toxicity of two chemically enhanced water accommodated fractions (CEWAF) of dilbits, Access Western Blend (AWB) and Cold Lake Blend (CLB), to rainbow trout alevins. Chemical dispersion was used to overcome the resistance to dispersion of dilbits and to generate test solutions that contained more and smaller oil droplets for increased partitioning of petroleum hydrocarbons into water. Test solutions were characterized by fluorescence spectroscopy (FS), a rapid and
inexpensive analytical tool, to compare toxicity endpoints measured by fluorescence (TPH-F). Cumulative mortality and the prevalence and severity of malformations increased following exposure of alevins to dispersed dilbits. Toxicity curves overlapped for AWB and CLB when expressed as TPH-F and 22-24 d LC/EC50s ranged from 0.36 to 1.5 mg/L. Gene expression in alevins was also altered following exposure to dispersed dilbit, with relative cyp1a mRNA levels increasing up to 170-fold for AWB and up to 240-fold for CLB. AWB and CLB caused similar toxicity to rainbow trout alevins as light to medium conventional crude oils, and rainbow trout alevins were more sensitive than yellow perch, Japanese medaka, and fathead minnow embryos exposed to dispersed AWB and CLB. This research is the first study assessing the embryotoxicity of dilbits to a Canadian freshwater salmonid species.
Keywords: oil spills, toxic effects, hazard/risk assessment, dilbit, fluorescence
spectroscopy, CEWAF
*Address correspondence to 5jea2@queensu.ca
Acc
ep
ted
Art
icle
DOI: 10.1002/etc.xxxx INTRODUCTIONThe world’s third largest oil reserves are found in Canada (Olsson 2012). The majority of the oil products in Canada are produced from petroleum extracted from oil sands in western Canada (CAPP 2016). Bitumen extracted from the oil sands is blended with other products, including natural gas condensates and synthetic light crude oils to reduce viscosity and facilitate transportation (Dew et al. 2015). Diluted bitumen, or dilbit, is bitumen diluted 20-30% with condensate (Crosby et al. 2013). Differences in bitumen stocks, diluents, and dilution factors generate a diversity of products with different physical and chemical characteristics. The two most studied dilbit products, Access Western Blend (AWB) and Cold Lake Blend (CLB), are transported in the highest volumes by pipeline across Canada (GOC 2013). Increased transportation of dilbit and the expansion of pipeline networks increase the potential for inland oil spills,
contamination of freshwater, and exposure of freshwater species to oil across Canada.
Comprehensive reviews by the Royal Society of Canada (Lee et al. 2015) and the US National Academy of Sciences (2016) have identified knowledge gaps related to the toxicity of dilbit products, their diluents, and their weathered residues to aquatic
organisms. Conversely, there is extensive literature on the toxicity of crude oil to aquatic organisms. It is proposed that the acute toxicity of oil is driven by monoaromatics and low molecular weight polycyclic aromatic hydrocarbons (PAH, e.g., naphthalenes), and that 3- to 5-ringed alkylated PAH and heterocycles cause chronic embryotoxicity to fish (Hodson et al. 2007; Turcotte et al. 2011; Adams et al. 2014a; Lin et al. 2015). Exposures
Acc
ep
ted
Art
icle
of early life stages of fish to 3- to 5-ringed alkylated PAH and oils that contain these PAH cause blue sac disease (BSD) characterized by mortality, cardiovascular and craniofacial malformations, yolk sac and pericardial edema, body hemorrhaging, and cytochrome P450-1A (CYP1A) induction (Marty et al. 1997; Billiard et al. 1999). The median lethal concentrations (LC50s) range from 0.045 to 40 mg/L total petroleum hydrocarbons (TPH) for acute toxicity to larval fish (reviewed in NRC 2005), while concentrations causing chronic sublethal toxicity ranged from and 0.03 to 11 mg/L TPH or 0.3-60 µg/L total polycyclic aromatic compounds (TPAC) (reviewed in Lee et al. 2015). Based on their hydrocarbon composition (GOC 2013), dilbits should be equally or less toxic than medium conventional crude oils (Alsaadi et al. 2018; Dew et al. 2015).
Despite numerous studies of crude oil toxicity to fish, a recent literature review (Adams et al. 2017) of oil toxicity tests to fish identified that there are fewer tests
assessing the toxicity of oil to freshwater fish species than marine species. Since all dilbit products are transported across land there is the potential that freshwater fish would be exposed to these products in a spill event. To address this data gap, the National
Contaminants Advisory Group (NCAG) of Fisheries and Oceans Canada (FAO) funded dilbit toxicity tests with freshwater species (https://www.dfo-mpo.gc.ca/science/rp-pr/ncag-gncc/index-eng.html). Several dilbit toxicity tests have been conducted within the last five years, primarily involving the toxicity of AWB and CLB to the early life stages of warm water fish species (reviewed in Alsaadi et al. 2018a).
Dilbit caused malformations and induced cyp1a mRNA synthesis in fish embryos at concentrations similar to conventional crude oils. Exposure of Japanese medaka
Acc
ep
ted
Art
icle
(Oryzias latipes, Madison et al. 2015, 2017), fathead minnow (Pimephales promelas; Alsaadi et al. 2018b) and yellow perch (Perca flavescens; McDonnell et al. 2019) embryos to water accommodated fractions (WAF) and chemically-enhanced WAF
(CEWAF) of AWB and CLB caused a higher prevalence of BSD and alteration of mRNA synthesis at hatch at low concentrations of TPAC (EC50s 0.1 to 24 µg/L TPAC).
Compared to conventional crude oil, dilbit (blend not identified) was less toxic in acute exposures of zebrafish embryos (Danio rerio; Philibert et al. 2016), whereas CLB and Western Canadian Select was as acutely toxic to fathead minnows as Alaska North Slope crude oil (Barron et al. 2018). Alderman et al. (2017a) reported cardiotoxicity to juvenile sockeye salmon (Oncorhynchus nerka) at low concentrations (< 66.7 µg/L) of PAH and changes in the general immune response, iron homeostasis, and coagulation factors (Alderman et al. 2017b). Exposure of juvenile sockeye salmon to sublethal
concentrations of dilbit (< 125 µg/L of PAH) caused effects on iono- and osmoregulation, stress responses and immune defense, and these effects were expected to impair seaward migration (Lin et al. 2020). Lower dilbit concentrations (< 68 µg/L PAH) did not
significantly affect osmoregulation (Alderman et al. 2020) or swimming performance (Avey et al. 2020) of Atlantic salmon (Salmo salar) smolts.
Toxicity tests often employ ‘standard methods’ to compare toxicity among
different oils or among different test species (Adams et al. 2017; Hodson et al. 2019). For comparisons of toxicity among oils based on their chemical composition, differences in their physical characteristics that inhibit dispersion and bioavailability should be
overcome. To do so, chemical dispersants have been used as a tool to generate solutions of CEWAF with more and smaller droplets and greater surface area-to-volume ratios.
Acc
ep
ted
Art
icle
The smaller droplets increased the rate of partitioning of hydrocarbons from oil to water and provided a higher and more constant exposure of test organisms (Adams et al. 2014b). For more viscous oils, dispersants increased the sensitivity of toxicity tests and avoided bias caused by variations in mixing efficiencies among oils (Adams et al. 2014a), enabling the comparison of oils by their chemical activity (Martin et al. 2014). When applied to tests with dilbit (e.g., Madison et al. 2015, 2017), chemical dispersion increased the measured concentrations of hydrocarbons in test solutions by about 100-fold compared to water accommodated fractions (WAFs) prepared by low energy stirring. Additionally, previous studies found that chemical dispersion of the oil increased
exposure of fish to oil but did not change the inherent toxicity of the oil components (Wu et al. 2012; Adams et al. 2014b). This approach was applied in the present study to better compare the toxicity of different oils, rather than to mimic an environmentally relevant exposure scenario.
There is a need for more detailed and more frequent chemical characterization of toxicity test solutions to better describe concentrations causing effects and to facilitate comparison of studies. Oil solutions are dynamic in nature and variability in the solution preparation and in test concentration over time is anticipated, though many studies assume these are constant. Often concentrations in test solutions are estimated from dilution of the stock solution concentration (n = 1) or from measured concentrations of test solutions at one sampling time. Repeated measures of the concentration gradient, test solutions between renewal, and test solutions over time are necessary to quantify
variability and estimate error in toxicity endpoints (Hodson et al. 2019). This study implemented fluorescence spectroscopy, a rapid and inexpensive method to measure
Acc
ep
ted
Art
icle
fluorescent hydrocarbons in water, to repeatedly measure differences in all test solutions between 24-hour test solution renewals and over the 22-24 days of fish exposure.
Toxicity tests of dilbits to a variety of freshwater species are needed to define the range of effects in risk assessments. The objective of this research was to assess the toxicity of AWB and CLB to alevins of rainbow trout (Oncorhynchus mykiss), a standard cold water test species (Environment and Climate Change Canada’s (ECCC) Biological Methods Development Group) and one native to western Canada where dilbit is
transported in high volumes by pipeline and rail.
MATERIALS & METHODS
The toxicity of chemically-dispersed AWB and CLB to rainbow trout alevins from hatch to swim-up was assessed with static daily renewal exposures. Chemical dispersion was used to aid the delivery of hydrocarbons into solution by reducing the surface tension of dilbit droplets that inhibits dispersion. This tool was useful in toxicity testing with oils with various properties, including conventional crude oils (Wu et al. 2012) and more viscous heavy fuel oils (Adams et al. 2014a, 2014b; Martin et al. 2014).
Throughout the toxicity tests, samples of the stock of CEWAF dilbits and water samples from the fish exposures were collected daily and analyzed by fluorescence spectroscopy (FS) for total petroleum hydrocarbons (TPH-F). Concentrations of PAC were analyzed in a subset of CEWAF dilutions by gas chromatography-mass
spectroscopy (GC-MS). Toxicity was assessed by cumulative mortality, prevalence and severity of malformations (% affected, % normal, blue sac disease severity index),
Acc
ep
ted
Art
icle
growth and development, and changes in the expression of genes of interest reflecting exposure to hydrocarbons and oxidative stress.
This work includes data from two separate experiments designated as ‘Experiment 1’ (E1) and ‘Experiment 2’ (E2). The first was conducted in October-November 2014 as a preliminary range-finding experiment. In this experiment we found that dispersant in the highest treatments of chemically-dispersed dilbits contributed to alevin toxicity. E2 was conducted in October-November 2015. Experiment E2 repeated E1, but used a narrower and higher concentration range, a different method for delivering dispersant to the floating oil layer, a lower ratio of dispersant-to-oil, and more dispersant controls. The two experiments were regression designs, replicated over time.
2.1 Test organisms
Trout eggs were purchased at the eyed stage from Rainbow Springs Trout Hatchery (Thamesford, ON, Canada) and held in City of Kingston dechlorinated, charcoal filtered, municipal water (pH 7.9 ± 0.2 and hardness 131 ± 3 mg/L CaCO3; Madison et al. 2015) at 10 °C until hatch. In E2, the trout started to hatch in transit and were immediately placed into treatments. Experiments were conducted under a Queen’s University animal control protocol (Hodson-2013-063) and followed the guidelines of the Canadian Council on Animal Care.
Water quality (pH, temperature, dissolved oxygen, and conductivity) was
measured daily to ensure optimum conditions for alevin development. Water quality was as follows: water temperature (E1: 10.3 ± 0.9 °C; E2: 9.3 ± 0.3 °C), dissolved oxygen
Acc
ep
ted
Art
icle
(E1: 13.4 ± 0.6 mg/L; E2: 10.5 ± 0.3 mg/L), pH (E1: 8.2 ± 0.2; E2: 7.8 ± 0.1),
conductivity (E1: 199 ± 6.5 µS/cm), and specific conductance (E2: 326.8 ± 2.4 μS/cm).
At hatch, alevins were distributed randomly into 4.0 L stainless steel bowls containing 2.0 L of test solution (n = 40 embryos per treatment) and water solutions were changed daily. The experiments were ended after 22 d (E1) and 24 d (E2) (or 227 and 223 degree-days, respectively; calculated by multiplying the average water temperature by the days of exposure) when most of the negative control fish developed to swim-up, i.e., when most of the yolk sac was absorbed and the alevins swam to the surface of the water to begin external feeding. At the end of the exposure, trout alevins were
anesthetized with an overdose of tricaine methane sulfonate (100 mg/L MS-222; CAS # 886-86-2, Sigma-Aldrich, Oakville, ON, Canada) buffered 2:1 with sodium bicarbonate (CAS # 144-55-8, Fisher Scientific, Whitby, ON, Canada).
2.2 Oils
Un-weathered 2013 winter blends of AWB and CLB dilbits and the dispersant Corexit ® 9500A (referred to as Corexit 9500 herein) were provided by Fisheries and Oceans Canada (Centre for Offshore Oil, Gas and Energy Research, Dartmouth, NS, Canada). The same CLB stock was used by Madison et al. (2017). Bulk oil was stored at 4 ˚C in the dark until use. A subsample of thoroughly-mixed bulk oil in sufficient volume to prepare test solutions for the whole experiment was collected in one pre-labeled sealed amber bottle per experiment to limit handling, loss of volatiles, and changes to the
physical and chemical properties of the stored oil with use. The stocks of oil were not artificially weathered prior to receiving the samples.
Acc
ep
ted
Art
icle
2.3 Preparation of CEWAFTest solutions were generated by chemical dispersions of oil in water. A modification of the semi-standardized CROSERF low energy mixing method was employed. Stock solutions of AWB and CLB dilbit CEWAFs were prepared daily with low energy mixing using a stir plate in 50 mL glass beakers covered with aluminum foil, as described in Martin et al. (2014). An aliquot of 3.5 mL of oil was weighed in 50 mL glass beakers containing the stir bar and 31.5 mL of water (1:9 oil-to-water ratio). The water used to prepare CEWAFs was the same as the diluent for CEWAFs in fish
exposures. All CEWAF stock solutions were prepared daily at the same time on a multi-position stir plate. After 18 h of mixing, Corexit 9500 was applied to the surface of the floating oil layer. In E1, dispersant was added to the center of the oil during mixing at a dispersant-to-oil ratio (DOR) of 1:10, while in E2, the DOR was 1:20 and the dispersant was applied in a swirl pattern to the floating oil layer when the beakers were removed briefly from the stir plate. The aim of this change in methodology was to reduce the amount of dispersant applied and increase the surface area of oil interacting with dispersant for more effective oil dispersion.
For both experiments, the solutions were mixed for 1 h after dispersant
application and left to settle for an additional hour. A scoopula was used to gently move the residual surface oil to one side to recover the lower aqueous phase with a Hamilton glass syringe with a 21 or 23-gauge needle. The lower aqueous phase (stock CEWAF solution) was immediately diluted in 1.0 L of dechlorinated municipal water in stainless steel bowls, followed by an additional 1.0 L of water, to achieve nominal CEWAF
Acc
ep
ted
Art
icle
concentrations of 0.0001. 0.001, 0.01, 0.1, and 1% v/v (E1) or 0.032, 0.068, 0.1, 0.32, 0.68, and 1% v/v (E2) in a total volume of 2.0 L.
In both experiments, the negative control was dechlorinated municipal water and the positive control was 100 µg/L retene (7-isopropyl-1-methylphenanthrene; CAS# 273819; MP Biomedical Inc., Solon, OH, USA). Retene was dissolved in methanol (CAS# 67-56-1, VWR International, Mississauga, ON, Canada), and methanol solvent controls were included in both experiments. To determine whether the dispersant in CEWAF contributed to the toxicity of dispersed oil, each experiment included controls of dispersant without oil and dispersant mixed with Nujol, a non-toxic mineral oil (CAS# 8042-47-5; Sigma-Aldrich, St. Louis, MO, USA) as described in Adams et al. (2014b). Nujol was dispersed under the same conditions as the dilbits (E1: Nujol CEWAF 0.1% and 1% v/v; E2: 0.68 and 1% v/v). For E1, an additional control of Nujol without dispersant was prepared by adding 3.5 mL of Nujol to 2.0 L of water, the maximum volume of oil loading in the preparation of CEWAF stocks (0.17% v/v). In E2, the Nujol control was a WAF stock prepared under the same conditions as the dilbits without dispersant applied and diluted to 1% v/v (Nujol WAF 1% v/v).
The dispersant-only control in E1 was created by spiking a known volume of dispersant (60 µL) into 2.0 L of water (0.003% v/v or 28.5 mg/L), equivalent to the 24 d LC50 of Corexit 9500 to rainbow trout alevins (estimated Corexit 9500 concentration 29.5 mg/L; Adams et al. 2014b). In E2, the dispersant control was generated by mixing dispersant and water following the CEWAF method, but without added oil. This
Acc
ep
ted
Art
icle
dispersant stock was diluted to 1% v/v in water, at an estimated concentration of Corexit 9500 of 0.005% v/v, or 52.8 mg/L Corexit 9500.
2.4 Toxicity tests
At hatch, alevins were exposed to waterborne treatments in 24 h darkness and solutions were aerated throughout the experiment. Minimal lighting was provided by a desk lamp pointed at the wall for daily checks and water renewals.
2.4.1 Mortality and assessment of blue sac disease (BSD). Alevins were observed daily for mortality and malformations during daily replacement of test solutions. The time to onset of effects and unique malformations separated dispersant effects from oil toxicity (Adams et al. 2014b). Mortality in the first five days of exposure to 1% v/v Nujol CEWAF and 1% v/v CEWAF (AWB and CLB) was consistent with the acute lethality of dispersant in the dispersant-only treatment rather than the components of oil. The
estimated Corexit 9500 concentration in these treatments (103 mg/L) exceeded the reported concentration of dispersant that caused 100% mortality to rainbow trout alevins (Adams et al. 2014b; Fig. S20: S: Supplemental Data). To avoid dispersant bias, data for the highest nominal treatments (1% v/v) for both oils in E1 were removed from the dataset.
Acc
ep
ted
Art
icle
At the end of each experiment, alevins were anesthetized, photographed, scored for blue sac disease (BSD; Wolf 1957), and measured for maximum total length (cm) and total wet mass (mg) and wet mass with yolk sac removed. Growth and development were expressed as the ratio of yolk sac-to-fish mass, an index of yolk conversion and development (Schein et al. 2009).
For each alevin, BSD was scored by the presence/absence of craniofacial malformations (CM), body hemorrhaging (BH), ocular hemorrhaging (OH), and fin rot (FR). Pericardial edema (PE) and yolk sac edema (YSE) were scored on a graded scale according to the severity of fluid accumulation (0-2 for PE; 0-3 for YSE; Martin et al. 2014). For each treatment, malformations were summarized as percent affected (the proportion of fish at swim-up with at least one sign of BSD), percent normal (the proportion of total number of alevins in the treatment that had no signs of BSD at swim-up), and average BSD Severity Index (BDS SI; as described by Schein et al. 2009; Wu et al. 2012; and as modified in Martin et al. 2014).
Subsets of alevins per treatment (n = 6-8 in E1, n = 9-10 in E2) were anesthetized, photographed, and immediately placed into individual RNAse/DNAse-free cryovials and flash frozen in liquid nitrogen to prevent degradation of genetic material. These samples were stored at -80 ˚C before molecular analysis described in the following section. Due to the sampling requirements for molecular response, BSD scoring was completed on these subsets of alevins using the photographs. Wet mass and length could not be measured for these samples and these data points were not included in the length, wet mass, wet mass with yolk removed and yolk sac-to-body mass graphics (Fig. S22-S25).
Acc
ep
ted
Art
icle
2.4.2 Molecular response. Subsets of frozen alevins were assessed by real-time qPCR to measure responses of target molecular biomarkers (see Supplemental
Information J for detailed protocol). Whole fish from each treatment (n = 6-8 in E1, n = 9-10 in E2) were cryogenically ground into powder. Approximately 100 mg of the powdered homogenate was added to 1 mL TRIzol® reagent (Ambion RNA by Life Technologies, Carlsbad, CA, USA), processed using a Retsch Mixer Mill MM400 (Thermo-Fisher, Ottawa, ON, Canada), and held on ice. A suite of molecular biomarkers was selected from previous work with chronic dilbit exposure in developing Japanese medaka (Madison et al. 2015, 2017), representing those biological pathways associated with phase I (cyp1a) and phase II detoxification and transformation (gst-π, gpx-4b, nfe2, gsr, sod, cat), xenobiotic metabolism (ahr, arnt), and cell cycling and mutation (p53). Where possible, differences in salmonid isoforms of certain gene targets, specific to salmonids, were accounted for in the design of primers (see Table S8 for full list of primers). In initial trials, elongation factor 1-alpha (ef1a) remained unchanged with dilbit exposure and was used as a reference (housekeeping) gene to normalize levels of
additional target biomarkers.
Whole fish from E2 were also assessed for changes in DNA methylation by measuring the addition of methyl groups to cytosine to form the 5-methylcytosine bases (Vandegehuchte & Janssen 2011) using methods described in McDonnell et al. (2019) modified from Pierron et al. (2014).
Acc
ep
ted
Art
icle
2.5.1 Fluorescence spectroscopy (FS). The concentration of oil in water for the test solutions and CEWAF stocks was measured daily as total petroleum hydrocarbon content by FS (TPH-F). FS was used for daily measurements of the concentration of petroleum hydrocarbons in test solutions using a scanning spectrofluorometer (Quanta-Master Fluorescence Spectrometer, Photon Technologies International, HORIBA Scientific, ON, Canada) equipped with a 75W xenon arc lamp and FelixGX Version 4.1.2.4995 software. The FS method has been used to measure individual PAH in water (Lin et al. 2015) and in fish bile (Fragoso et al. 1999), and waterborne concentrations of heavy fuel oils (Martin et al. 2014), conventional crude oils (Greer et al. 2012; Wu et al. 2012), diesel oil (Schein et al. 2009), and dilbits (Madison et al. 2015, 2017; Alsaadi et al. 2018b; McDonnell et al. 2019).
Several calibrations comparing total fluorescence (area under the emissions curve) to known concentrations of oil were produced to calculate the TPH-F
concentration in CEWAF stock dilutions and test solutions (Fig. S1, Table S1). Known concentrations of oil were prepared in hexanes and serially diluted into equal parts ethanol and water and analyzed by emission scans. FS emission scan parameters were optimized to the fluorescence of the dilution of whole oil in solvent, and these parameters were used for subsequent CEWAF stock and water sample analysis. Both dilbits were optimized to excitation wavelength of 300 nm and an emission wavelength range of 310– 460 nm (similar to reported optimized wavelengths for AWB and CLB λex 302 nm, λem 307-457 nm; Madison et al. 2015, 2017). In E1, all samples were analyzed in quartz cuvettes with slit sizes of 1 nm and calibration curves were generated with filtered deionized water (18.2 MΩ-cm, PURELAB Ultra water system, Siemens Water
Acc
ep
ted
Art
icle
Technologies). In E2, the slit sizes were increased to 6 nm and calibration curves were generated with dechlorinated Lake Ontario water collected from the aquatic facility, the same water used for generation of CEWAF stocks and preparation of test solutions for fish exposures. In each individual calibration, the 50:50 matrix blank (anhydrous ethanol and water) was set to the 0 µg/L concentration for oil. The calibrations were limited to the linear range of the standards, 0 to 1000 µg/L for E1 and E2. To calculate the TPH-F in water samples, all calibrations during the toxicity tests were pooled to generate a single linear calibration curve per oil for each experiment.
The limit of detection was calculated from method one described by Loock & Wentzel (2012) and reported in Table S2. The FS method limit of detection (LOD) for AWB and CLB in E1 with samples diluted 50:50 in ethanol was 21 and 23 µg/L, respectively. This is equivalent to 41 and 47 µg/L in un-diluted water samples. The FS LOD for AWB and CLB in E2 was 160 and 125 µg/L in un-diluted water samples, respectively. The higher LOD in E2 is related to the higher slit size and dilution water with higher background fluorescence. Water samples taken daily from the test solutions were analyzed by FS and the mean TPH-F was calculated. Data points were removed if the TPH-F concentration was 2-fold greater or less than the mean concentration for all samples and if the fluorescence spectrum had peaks inconsistent with oil spectra from adjacent time points in the same treatment (see Fig. S11-S12 for concentrations over time and Fig. S16 for oil spectrum; removed 23 of 192 t0 CEWAF samples in E1 and 26 of 250 samples in E2). TPH-F concentrations less than the method LOD were included in the mean TPH-F concentrations (see Table S5). Quality assurance and quality control measures for the FS method are reported in Fig. S6-S8 and Table S3.
Acc
ep
ted
Art
icle
In all experiments, aliquots of test solutions from exposure vessels containing fish were sampled at the time of water change (t0) and water samples were also collected daily after 24 h (t24) in E1. Water samples were immediately diluted in anhydrous ethanol (1:1, v/v) in 7 mL borosilicate vials, sealed with foil-lined caps, and stored in the dark at 4 °C prior to analysis. All water samples were analyzed with the optimized wavelengths for whole oils, except for the retene positive controls. Consistent with peak emission wavelengths reported by Fragoso et al. (1999) and Lin et al. (2015), retene was optimized to λex302 nm, λem 315-465 nm and calibration curves and water samples were analyzed under these emission scan parameters (Fig. S2-S3). A calibration for Corexit 9500 was prepared at λex 300 nm, λem 310-460 nm to match the parameters of dispersed oil sample analysis (Fig. S4-S5).
2.5.2 Gas Chromatography-Mass Spectrometry (GC-MS). A subset of test
solutions was analyzed by both FS and GC-MS. On day 10 of E1, samples were collected from freshly prepared dilutions of AWB and CLB CEWAF stocks (0.0001, 0.001, 0.01, and 0.1 % v/v), negative control (water), and the dispersant-only control (0.003 % v/v Corexit 9500). Samples were also collected from two CEWAF treatments per oil after 24 h of alevin exposure to measure depletion of PAC over the renewal period. Duplicate samples were collected in 500 mL amber glass bottles with no headspace or preservation and shipped overnight in coolers to AGAT Laboratories for ‘Polyaromatic Hydrocarbon Analysis in Water – Alkylated’ (Protocol # ORG-170; Edmonton, Alberta, Canada). Analytes are reported in Table S6 with limits of detection, percent recovery and measured PAC concentrations in test solutions; the 49 analytes are the same as those reported by
Acc
ep
ted
Art
icle
Madison et al. (2017). The sum or total concentrations of polycyclic aromatic compounds (TPAC), including alkylated PAC, are reported in Table S6.
2.6 Endpoint calculation and statistics
Toxicity endpoints were computed from nominal loadings (% v/v) and mean measured concentrations of TPH-F in water. Graphs and regressions were produced with GraphPad Prism 8.3.0 (GraphPad Software Inc., La Jolla, CA, USA). The nonlinear regressions for endpoint estimation included log(agonist) vs normalized response – Variable slope, log(agonist) vs response – Variable slope (four parameters), and
log(inhibitor) vs response – Variable slope (four parameters) (See Table S7 for nonlinear regression parameters and endpoints). For gene expression, treatment means were
compared to controls by one-way ANOVA and Holm-Sidak post hoc analyses (p < 0.05). Treatment means for length, whole body wet mass, body wet mass with yolk removed and ratio of yolk sac wet mass to whole body wet mass were compared to controls by Kruskal-Wallis test (p < 0.05). A nonparametric test was used as several treatments were not normally distributed (Shapiro-Wilk test, p < 0.05).
RESULTS
3.1 Chemical analysis of test solutions
The relationships between the nominal % dilutions and TPH-F were linear and repeatable (Fig. 1). Compared to E1, the increased slit width in E2 analyses increased the total fluorescence for the same oil calibration (Fig. S1; regression details in Table S1). Increased slit width and higher background fluorescence signal of the diluent in E2 decreased the sensitivity for detecting lower concentrations of oil in water, while
Acc
ep
ted
Art
icle
reducing the definition of the fluorescence spectrum (Fig. S2-S5, S16-S17). The background fluorescence signal was higher than in E1 because water from the aquatic facility (dechlorinated Lake Ontario municipal water) was used for dilutions rather than filtered deionized water; this increased the y-intercept of calibration regressions.
However, the different water sources did not change the relative fluorescence of the samples when the solvent matrix was the same for the calibration curve and the samples being analyzed.
At nominal CEWAF loadings greater than 0.01% v/v, there was a linear increase in mean TPH-F concentrations per treatment. Overall there were similar concentrations of oil in water for both oils based on nominal loadings for both experiments (Fig. 1). The average TPH-F concentration (t0) for AWB 0.1% v/v treatment was 43% lower in E1 than E2. This trend was not observed for CLB where the 0.1% v/v average TPH-F (t0) was not different in E1 and E2. The average TPH-F concentration (t0) for the 0.1% v/v treatment was similar for AWB and CLB in E2, whereas concentrations of AWB were approximately 41% lower than CLB in E1. In E1, water samples taken daily just prior to solution renewal demonstrated that the average decays in fluorescence over 24 h for the 0.01 and 0.1% v/v treatments were 12% and 18% for AWB and 17% and 20% for CLB, respectively. The estimated TPH-F for dispersed oil treatments estimated from dilutions of CEWAF increased linearly with the measured mean concentrations of TPH-F in water samples collected daily from exposure solutions (Fig. S15, Table S4-S5). Trends in TPH-F in daily dilutions of CEWATPH-F stocks and test solutions are reported in TPH-Fig. S9-S14. The coefficient of variance (CV) for dilutions of CEWAF stocks measured by FS ranged from 24 to 59% for AWB and 31 to 42% for CLB (see Table S4). Water samples collected
Acc
ep
ted
Art
icle
from test solutions of diluted CEWAF stocks directly after preparation (t0) ranged from 24 to 58% for AWB and 33 to 105% for CLB (see Table S5).
Calibration curves for measuring retene and Corexit 9500 concentrations in control solutions are provided in Fig. S2-S5 and measured concentrations are reported in Fig. S13-S14 and Table S5. The measured mean concentrations of retene were similar in E1 and E2 (t0; 111 µg/L in E1, 113 µg/L in E2). The 0.003% v/v dispersant control and 0.1% v/v Nujol CEWAF in E1 contained mean concentrations of Corexit 9500 of 44 and 11 mg/L, respectively, at t0. In E2, t0 mean concentrations for 0.68% v/v and 1% v/v Nujol CEWAF were 27 mg/L and 48 mg/L, respectively. The mean concentration of 0.005% v/v Corexit 9500 in E2 was 60 mg/L (t0). The measured concentration of Corexit 9500 in dispersant and Nujol CEWAF control solutions increased linearly with the estimated Corexit 9500 concentration (Fig. S21). The increase in fluorescence was attributed entirely to Corexit because the fluorescence of Nujol WAF solutions did not differ from water controls (Table S5, Fig. S17).
The concentrations of PAC in the GC-MS analysis were below their individual limits of detection for almost all water samples, and multiple analytes (>3 of 49 measured) were detectable only at the nominal dilutions with the highest expected concentrations (Table S6). The total concentrations of all analytes measured by GC-MS were 0.79 and 3.94 µg/L TPAC for 0.1% v/v AWB and CLB CEWAF, respectively (corrected to water control). The profile of measurable PAC in these water samples was dominated by 2- and 3-ringed PAC (Fig. S18).
Acc
ep
ted
Art
icle
3.2 Mortality and prevalence of malformations
The cumulative percent mortality, BSD severity index, and percent affected increased with nominal loadings (% v/v) and with mean TPH-F concentrations per treatment and similar exposure-response curves were observed for AWB and CLB in both experiments (Figs. 2-5); there was no difference between the samples of two
different dilbits. The data from both oils were combined to generate one toxicity estimate as AWB and CLB toxicity data were similar and concentration-response curves
overlapped as determined by comparison of the 95% confidence intervals of endpoints and correlation coefficients > 0.9 when data were combined.
The ratio of yolk sac wet mass-to-whole body wet mass was similar to the water control in all treatments except for the highest oil treatments and the dispersant controls in E2. These fish were less developed or had yolk sac edema that increased the mass of the yolk sac relative to the whole-body wet mass (Fig. S22-S25).
Retene caused 5% mortality in E1 and 58% mortality in E2, with all alevins at swim-up showing at least one sign of BSD in both experiments. Although dispersant controls caused similar rates of mortality, they differed in prevalence of malformations. The dispersant control in E1 (t0 mean 44 mg/L) had 0% affected and the dispersant control in E2 (t0 mean 60 mg/L) had 100% affected alevins at swim-up. No mortality or signs of BSD were observed in 0.1% Nujol CEWAF (10 mg/L) in E1. In E2 the Nujol CEWAF 0.68 and 1% v/v treatments (27 and 48 mg/L) caused mortality and signs of BSD. Fish length (cm) was reduced at swim-up in retene and dispersant control
Acc
ep
ted
Art
icle
treatments (Fig. S22). Negative control fish showed little response compared to fish in the oil exposures.
3.3 Targeted gene expression analysis and methylation
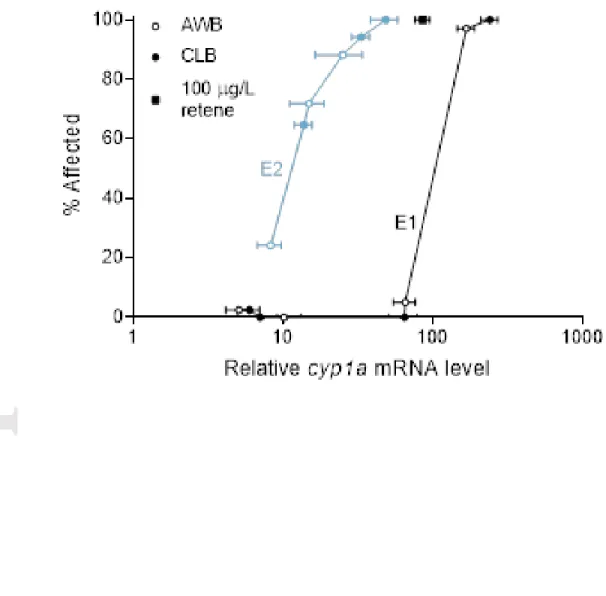
Relative cyp1a mRNA levels of whole alevins exposed to AWB and CLB CEWAF increased by 170- to 240-fold and 25- to 50-fold compared to water controls in E1 and E2 respectively (Fig. 6). Alevins with increased cyp1a expression also had higher proportions of malformations (Fig. 7); this was more pronounced for E2. Compared to water controls, relative mRNA levels of other biomarkers increased in response to oil exposure above nominal loadings of 0.0001% v/v (> 40 µg/L TPH-F), but many of the observed trends were variable (Fig. S26-S29). For example, the concentration-related increase in glutathione reductase (gsr) transcript level observed in E1 was not mirrored in E2.
Overall no changes in DNA methylation from the negative control (Nujol WAF 1% v/v) were measured in trout sampled from the three lowest treatments in E2 (Fig. S30-S31).
DISCUSSION
Dilbit toxicity did not differ between AWB and CLB nor between E1 and E2; cumulative percent mortality, BSD severity index, and percent affected increased while percent normal (Fig. S19) decreased with nominal loading (% v/v) and measured TPH-F concentrations. The overlap of AWB and CLB exposure-response curves allowed for one non-linear regression to express the toxicity for each endpoint. The 22-24 d LC50 and
Acc
ep
ted
Art
icle
EC50s ranged between 0.035 and 0.14 % v/v nominal loading and 0.36 and 1.5 mg/L TPH-F.
At swim-up, alevins exposed to increasing concentrations of oil were smaller and had higher ratios of yolk sac mass-to-whole fish mass than control fish. Because wet mass was measured, treatment-related edemas would also have contributed to the mass and may have confounded growth effects. Future studies should use dry mass for comparisons. Several biomarker genes were altered following dilbit exposure, but only cyp1a expression increased consistently with increasing concentrations of AWB and CLB, by 25- to 240-fold compared to controls. The whole-body cyp1a expression of alevins was also similar for both oils, but there was a slight difference in relative expression between the two experiments at similar oil concentrations (e.g., cyp1a; Fig. 6). Differences between E1 and E2 may relate to the degree of relative expression of cyp1a with the differences in fish size and age. Concentration-related responses of cyp1a to dilbit have been noted previously. Despite variance in the size of responses among fish species, cyp1a mRNA consistently responded to oil in a concentration-specific manner, as shown by others (Kim et al. 2013; Holth et al. 2014; Adeyemo et al. 2015; Madison et al. 2015, 2017; Alsaadi et al. 2018b; McDonnell et al. 2019). For example, Madison et al. (2015, 2017) highlighted 15- to 30-fold increases in cyp1a mRNA levels in medaka less than 24 h post hatch in response to increasing WAF and CEWAF concentrations of AWB and CLB dilbit compared to non-exposed medaka.
The expression of ahr, arnt, p53, sod1, cat, and gst-π in treatments also increased, but this was transient and without a clear association with concentrations of hydrocarbons
Acc
ep
ted
Art
icle
measured in water. Decreasing trends in ahr and arnt transcription were observed at higher concentrations of dilbit; these were also associated with severe BSD in alevins. At lower dilbit concentrations both ahr and arnt transcripts were elevated and in accordance with characteristic PAC-AHR related toxicity (Incardona 2017), as observed in earlier studies with dilbit (Madison et al. 2015, 2017; Alderman et al. 2017a, 2017b). Reduced transcription at higher concentrations could indicate a direct toxic effect of hydrocarbons on mRNA synthesis. A comparable effect of ahrr upregulation in affected fish was noted for polar cod (Boreogadus saida) acutely exposed to crude oil WAF (Andersen et al. 2015).
Dilbit exposure also elevated mRNA synthesis of key anti-oxidant genes such as sod1, cat, and gsr in rainbow trout alevins, but the relationships between gene expression and water TPAC concentrations were less consistent. Biomarkers of oil exposure related to antioxidant defense (e.g., cat, sod) and phase II detoxification and biotransformation (e.g., gsr, gst) have been associated with the cellular oxidative imbalance from oil and/or Corexit 9500 exposure (Theron et al. 2014; Zheng et al. 2014). However, high
concentrations of Corexit 9500 (> 80 mg/L) appear to be required to have lasting cytotoxicity in mammalian cell lines (Zheng et al. 2014). In fish, even with variations among species and life stage, gene homologues in newly-hatched medaka and yellow perch exposed to AWB and CLB CEWAF treatments with similar water TPAC concentrations appeared to follow similar trends in activation to the current study (Madison et al. 2015, 2017; McDonnell et al. 2019). Inconsistent with McDonnell et al. (2019), we observed no changes in DNA methylation in individual trout alevins exposed to the three lowest AWB and CLB CEWAF treatments in E2. Future studies of DNA
Acc
ep
ted
Art
icle
methylation should target specific genes or tissues to identify which genes are methylated, by which PAC, and at what concentrations.
Several studies have assessed the toxicity of oils to rainbow trout with the same protocols for toxicity testing, preparation of CEWAF, characterization of test solutions, and derivation of toxicity endpoints as this study. This enables the direct comparison of dilbit toxicity to trout alevins in this study to the toxicity of Heavy Fuel Oil 6303 (Martin et al. 2014), weathered Alaska North Slope crude (Wu et al. 2012), weathered Federated crude (Wu et el. 2012), weathered Medium South American crude (Wu et al. 2012), weathered Scotian light (Wu et al. 2012), and diesel fuel oil No. 2 (Schein et al. 2009; see Table S9). Dilbits caused the same type of malformations observed in exposures of trout alevins to diesel, conventional crude, and heavy fuel oils (Schein et al. 2009; Wu et al. 2012; Martin et al. 2014). The toxicity of chemically-dispersed AWB and CLB to rainbow trout alevins was similar to the toxicity of light and medium conventional crude oils to rainbow trout alevins when toxicity was expressed as nominal loadings (% v/v) and measured concentrations of oil (TPH-F) in water (Fig. 8, Table S9). Overall, the ranking of the oils by toxicity provided the same ranking as the measured TPAC concentrations in each whole oil. The sole exception was diesel, which had the lowest toxicity and highest estimated TPAC concentration because of its very high proportion of low molecular weight aromatic compounds (i.e., naphthalenes, alkyl naphthalenes). The naphthalenes are associated with acute, not chronic toxicity (Lee et al. 2015), but are included in the sum of TPAC concentrations.
Acc
ep
ted
Art
icle
As described above, there are also several studies that implemented the same test protocols as this study but differed in the freshwater fish species exposed. Rainbow trout alevins were more sensitive than yellow perch, Japanese medaka, and fathead minnow embryos exposed to AWB and CLB CEWAF (Table 1). The sole exception was the greater sensitivity of medaka embryos to CLB CEWAF than trout alevins (Madison et al. 2017). Contrary to previous studies (Table 1, Table S9), AWB and CLB had the same toxicity to trout alevins when expressed as % nominal loadings and TPH-F. This difference may be related to differences in TPAC concentrations of oils and test
solutions. The error associated with TPAC measurements is unknown because there were no repeated measurements of test solutions, and concentrations that were toxic were often at or below the detection limits for most PAC. Measures of TPAC in test solutions over time are needed to reveal whether concentrations in AWB and CLB solutions are similar.
Identification of the composition and concentration of TPAC in the dissolved phase aids the identification of the main toxic components of oil and predictions of effects because PAC toxicity varies with ring number and the number, size, and pattern of alkyl substitutions (Hodson 2017; Geier et al. 2018). As indicated, measuring TPAC concentrations in oil toxicity tests was challenging because concentrations that were toxic were often at or below the detection limits of individual PAC analytes. As a consequence, only a limited number of samples were analyzed in the present study. To overcome this challenge, analyses of test solutions included a subset analyzed by GC-MS (TPAC) and a more comprehensive set analyzed by FS. The purpose was to correlate TPAC and TPH-F concentrations and to express toxicity in terms of TPAC concentrations as reported previously (Alsaadi et al. 2018; Madison et al. 2015, 2017; McDonnell et al. 2019).
Acc
ep
ted
Art
icle
However, only the highest CEWAF treatment in E1 (0.1% v/v) contained more than three PAC analytes at concentrations above their detection limit. As there was insufficient data to correlate TPAC to TPH-F, the data from this study were compared to similar regressions reported by Madison et al. 2015, 2017 (Fig. S32). Using the estimated TPAC concentrations above the LOD for GC-MS, the estimated 22-24 d LC50 and EC50 values ranged between 0.53 and 2.7 µg/L TPAC for AWB and CLB (Fig. S33, Table S10). On this basis, dilbit appears more toxic to rainbow trout alevins than crude and heavy fuel oils (22-25 d EC50-LC50 range from 2-28 µg/L TPAC, Table S9) when expressed as estimated TPAC concentrations. Although the stocks of dilbit and the methods used to generate and characterize test solutions were the same between Madison et al. 2015, 2017 and the present study, the estimated endpoints could vary between these experiments.
These toxicity tests demonstrated that chemical dispersion was an effective tool for driving components of oil into solution. Based on the composition of the dilbits, their toxicity was comparable to other oils. This approach allowed the measurement of the toxicity of viscous oils that do not readily disperse in water by generating more and smaller droplets for increased partitioning of hydrocarbons into water (Adams et al. 2014a, 2014b; Martin et al. 2014). Adams et al. (2014b) suggested that at toxic concentrations of dispersed oil, the concentration of dispersant is insufficient to contribute to dispersed oil toxicity when mixed well (Wu et al. 2012; Adams et al. 2014b). However, in the present study, the dilbit products were more resistant than expected to dispersion by low energy mixing methods. This may indicate that less dispersant applied to the surface slick was sequestered by the dilbit than with
Acc
ep
ted
Art
icle
conventional oils, leaving more dispersant to dissolve in the test solution, independent of the oil (as discussed in Adams et al. 2014b). Additional controls with dispersant-alone and dispersions of non-toxic mineral oil (Nujol) were necessary to assess the toxicity of dispersant in chemically-dispersed test solutions (e.g., Adams et al. 2014b; Martin et al. 2014; Madison et al. 2015, 2017). Assuming that Nujol sequesters dispersant in the same way as dilbit, the Nujol, dispersant, and Nujol CEWAF controls in the present study indicated that dispersant in the highest CEWAF treatments of dilbit could have
contributed to alevin toxicity (Fig. S21). In E1, these controls demonstrated that the acute toxicity of 1% v/v for AWB and CLB CEWAF was associated with the detergent-like action of dispersant (Wu et al. 2012) and not dilbit toxicity, resulting in their exclusion from the experiment. Mortality in dispersant control fish was greater than 50% and was consistent with dispersant mortality previously reported (24 d LC50 Corexit 9500 29.5 mg/L, Adams et al. 2014b; Fig. S21) based on measured concentrations by FS. Further research is needed to develop analytical methods to distinguish between water-dissolved dispersant and dispersant sequestered to oil droplets in dispersed oil solutions.
FS enabled the daily measurement of oil concentrations in CEWAF stock
dilutions and in test solutions (Fig. S9-S14) and indicated considerable variability (Table S4-S5) over the course of the experiments. The variability in hydrocarbon concentrations may have been related to inconsistencies in the mixing energy delivered by the multi-position stir plate and/or changes in oil properties that affect dispersion. Increased mixing energy increased dispersion effectiveness of CLB in Baffled Flask Tests (Pan et al. 2017). Additionally, weathering of oil can reduce the dispersant interaction with the oil, the degree of dispersion, and the delivery of hydrocarbons into CEWAF stocks. The
Acc
ep
ted
Art
icle
volatile components in dilbit are rapidly lost during weathering, increasing the density and viscosity of the remaining oil (GOC 2013). Although weathering was not measured in this study, loss of volatile components likely occurred during the 18 h of mixing prior to chemical dispersion and over time with use and handling. Madison et al. (2017) observed changes in the viscosity of dilbit from the loss of volatiles during 18 h of low-energy mixing that reduced the dispersibility of the dilbits during test solution
preparation. The reduced effectiveness of dilbit dispersion during preparation of test solutions may make dilbit appear less toxic than oils that disperse more readily due to the reduced delivery of toxic components into test solutions (reviewed in Alsaadi et al. 2018a). Research is needed to determine how the characteristics of dilbit and the
methodology to prepare solutions for dilbit toxicity testing may alter the interpretation of toxicity.
Altogether, the current data suggest that dilbits are of similar toxicity to light and medium conventional crude oils to developing fish based on exposure of rainbow trout alevins to chemically-dispersed dilbit solutions. In spills in rivers there is an increased risk as highly turbulent waters of rapids or waterfalls can break oil into smaller droplets, increasing exposure of freshwater species. Chemical dispersants are a useful tool when studying the toxicity of dilbit to overcome the resistance to dispersion or limited dispersibility of viscous dilbits. A potential drawback of this method is the influence of free dispersant on toxicity in high concentrations of dispersed oil solutions when oil and dispersant do not mix well. Several research needs were identified including the need to develop methods to generate test solutions to limit the effects of weathering on
Acc
ep
ted
Art
icle
tests, the need for appropriate control treatments for experiments with dispersant, the need for methods to distinguish between water-dissolved dispersant and dispersant sequestered to oil droplets in dispersed oil solutions, and the need for chemical characterization of test solutions with repeated sampling to assess the variability in
measured concentrations. FS proved to be a valuable method to inexpensively and rapidly measure changes in CEWAF stocks and test solutions with a high sampling frequency for detailed reporting of changes in test solutions. This research assessed the toxicity of dilbits to a native Canadian freshwater fish species, rainbow trout, and contributes to hazard assessment and risk assessment of dilbit products in Canada.
Supplemental Data ̶ The Supplemental Data are available on the Wiley Online Library at DOI:10.1002/etcxxxx
Acknowledgment--Funding to support this research was provided the Natural Sciences and Engineering Research Council of Canada - Strategic Partnership Grant Program (NSERC-SPG) to P.V. Hodson and R.S. Brown, the National Contaminants Advisory Group (NCAG) of Fisheries and Oceans Canada to V.S. Langlois and P.V. Hodson, and the Canada Research Chair to V.S. Langlois. Oils and Corexit® 9500A were supplied by T. King, Center for Offshore Oil, Gas and Energy Research, Fisheries and Oceans Canada, Dartmouth, NS. Technical support was provided by S. Wallace and C. Emerton (Royal Military College of Canada). Thank you to two anonymous reviewers for their contributions.
Acc
ep
ted
Art
icle
Author Contributions Statement--Experimental design and planning by J. Adams, R.S. Brown, and P.V. Hodson. Fluorescence methods development/refinement by J. Adams and R.S. Brown. Toxicity testing and data collection by J. Adams and K. Charbonneau. Fish genomic analysis and contribution to interpretation by M. Sereneo, L. Baillon, B.N. Madison, and V.S. Langlois. J. Adams performed data analysis and wrote the manuscript. All co-authors provided feedback.
REFERENCES
Adams J, Bornstein JM, Munno K, Hollebone B, King T, Brown RS, Hodson PV. 2014a. Identification of compounds in heavy fuel oil that are chronically toxic to rainbow trout embryos by effects-driven chemical fractionation. Environ Toxicol Chem 33(4):825–835. http://doi.org/10.1002/etc.2497
Adams J, Sweezey M, Hodson PV. 2014b. Oil and oil dispersant do not cause synergistic toxicity to fish embryos. Environ Toxicol Chem 33(1):107–114.
http://doi.org/10.1002/etc.2397
Adams J, Charbonneau K, Tuori D, Brown RS, Hodson PV. 2017. Review of Methods for Measuring the Toxicity to Aquatic Organisms of the Water Accommodated Fraction (WAF) and Chemically-Enhanced Water Accommodated Fraction (CEWAF) of petroleum. DFO Can. Sci. Advis. Sec. Res. Doc. 2017/064. xi + 110 p.
Adeyemo OK, Kroll KJ, Denslow ND. 2015. Developmental abnormalities and differential expression of genes induced in oil and dispersant exposed Menidia
Acc
ep
ted
Art
icle
beryllina embryos. Aquat Toxicol 168:60-71. https://doi.org/10.1016/j.aquatox.2015.09.012
Alderman SL, Lin F, Farrell AP, Kennedy CJ, Gillis TE. 2017a. Effects of diluted
bitumen exposure on juvenile sockeye salmon: From cells to performance. Environ Toxicol Chem 36(2):354-360. http://doi.org/10.1002/etc.3533
Alderman SL, Dindia LA, Kennedy CJ, Farrell AP, Gillis TE. 2017b. Proteomic analysis of sockeye salmon serum as a tool for biomarker discovery and new insight into the sublethal toxicity of diluted bitumen. Comp Bioch Physiol - Part D 22:157–166. https://doi.org/10.1016/j.cbd.2017.04.003
Alderman SL, Dilkumar CM, Avey SR, Farrell AP, Kennedy CJ, Gillis TE. 2020. Effects of diluted bitumen exposure and recovery on the seawater acclimation response of Atlantic salmon smolts. Aquat Toxicol 221(January):105419.
doi:10.1016/j.aquatox.2020.105419.
https://doi.org/10.1016/j.aquatox.2020.105419
Alsaadi F, Hodson PV, Langlois VS. 2018a. An embryonic field of study: The aquatic fate and toxicity of diluted bitumen. B Environ Contam Tox 100(1):8–13.
https://doi.org/10.1007/s00128-017-2239-7
Alsaadi FM, Madison BN, Brown RS, Hodson PV, Langlois VS. 2018b. Morphological and molecular effects of two diluted bitumens on developing fathead minnow (Pimephales promelas). Aquat Toxicol 204:107–116.
Acc
ep
ted
Art
icle
Andersen Ø, Frantzen M, Rosland M, Timmerhaus G, Skugor A, Krasnov A. 2015. Effects of crude oil exposure and elevated temperature on the liver transcriptome of polar cod (Boreogadus saida). Aquat Toxicol 165:9–18.
http://dx.doi.org/10.1016/j.aquatox.2015.04.023
Avey SR, Kennedy CJ, Farrell AP, Gillis TE, Alderman SL. 2020. Effects of diluted bitumen exposure on Atlantic salmon smolts: Molecular and metabolic responses in relation to swimming performance. Aquat Toxicol 221(January):105423.
doi:10.1016/j.aquatox.2020.105423
Barron MG, Conmy RN, Holder EL, Meyer P, Wilson GJ, Principe VE, Willming MM. 2018. Toxicity of cold lake blend and western Canadian select dilbits to standard aquatic species. Chemosphere 191:1–6.
https://doi.org/10.1016/j.chemosphere.2017.10.014
Billiard SM, Querbach K, Hodson PV. 1999. Toxicity of retene to early life stages of two freshwater fish species. Environ Toxicol Chem 18(9):2070–2077.
https://doi.org/10.1002/etc.5620180927
Canadian Association of Petroleum Producers [CAPP]. 2016. Canada’s oil sands. http://www.capp.ca/
Carls MG, Holland L, Larsen M, Collier TK, Scholz NL, Incardona JP. 2008. Fish embryos are damaged by dissolved PAHs, not oil particles. Aquat Toxicol 88:121– 127. https://doi:10.1016/j.aquatox.2008.03.014
Acc
ep
ted
Art
icle
Crosby S, Fay R, Groark C, Kani A, Smith JR, Sulivan T, Pavia R. 2013. US Department of Commerce. In: Transporting Alberta Oil Sands Products: Defining the Issues and Assessing the Risks. NOAA technical memorandum, Seattle, WA.
Dew WA, Hontela A, Rood SB, Pyle GG, Water A, Building ES. 2015. Biological effects and toxicity of diluted bitumen (dilbit) and its constituents in freshwater systems. J Appl Toxicol 35(11):1219–1227. http://doi.org/10.1002/jat.3196
Fragoso NM, Hodson PV, Kozin IS, Brown RS, Parrott JL. 1999. Kinetics of mixed function oxygenase induction and retene excretion in retene-exposed rainbow trout (Oncorhynchus mykiss). Environ Toxicol Chem 18(10):2268–2274.
https://doi.org/10.1002/etc.5620181022
Geier MC, Chlebowski AC, Truong L, Massey Simonich SL, Anderson KA, Tanguay RI. 2018. Comparative developmental toxicity of a comprehensive suite of polycyclic aromatic hydrocarbons. Arch Toxicol 92:571–586. https://doi.org/10.1007/s00204-017-2068-9
Government of Canada (GOC). 2013. Federal Government Technical Report. Properties, Composition and Marine Spill Behavior, Fate and Transport of Two Diluted
Bitumen Products from the Canadian Oil Sands. Environment Canada Emergencies Science and Technology, Fisheries and Oceans Canada Centre for Offshore Oil, Gas and Energy Research, Natural Resources Canada CanmetENERGY. Nov 30 2013. ISBN 978-1-100-23004-7, Cat. No.: En84-96/2013E-PDF
Acc
ep
ted
Art
icle
Greer C, Hodson PV, Li Z, King T, Lee K. 2012. Toxicity of crude oil chemically dispersed in a wave tank to embryos of Atlantic herring (Clupea harengus). Environ Toxicol Chem 31(6):1324–1333. https://doi.org/10.1002/etc.1828
Hodson PV, Khan CW, Saravanabhavan G, Clarke L, Brown RS, Hollebone B, Wang Z, Short J, Lee K, King T. 2007. Alkyl PAH in crude oil cause chronic toxicity to early life stages of fish. Proceedings, 28th Arctic and Marine Oilspill (AMOP) Program, Technical Seminar, Edmonton, AB, Canada, June 4–7, pp 291-300.
Hodson PV. 2017. The toxicity to fish embryos of PAH in crude and refined oils. Arch Environ Contam Toxicol 3(1):12–18. https://doi.org/10.1007/s00244-016-0357-6
Hodson PV, Adams J, Brown RS. 2019. Oil toxicity test methods must be improved. Environ Toxicol Chem 38(2):302–311.
https://setac.onlinelibrary.wiley.com/doi/abs/10.1002/etc.4303
Holth TF, Eidsvoll DP, Farmen E, Sanders MB, Martinez-Gomez C, Budzinski H, Burgeot T, Guilhermino L, Hylland K. 2014. Effects of water accommodated fractions of crude oils and diesel on a suite of biomarkers in Atlantic cod (Gadus morhua). Aquat Toxicol 154:240–252.
http://dx.doi.org/10.1016/j.aquatox.2014.05.013.
Incardona JP. 2017. Molecular mechanisms of crude oil developmental toxicity in fish. Arch Environ Con Tox 73:19–32. http://dx.doi.org/10.1007/s00244-017-0381-1
Kim R-O Kim B-M, Hwang D-S, Au DWT, Jung J-H, Shim WJ, Leung KMY, Wu RSS, Rhee J-S, Lee J-S. 2013. Evaluation of biomarker potential of cytochrome P450 1A
Acc
ep
ted
Art
icle
(CYP1A) gene in the marine medaka, Oryzias melastigma exposed to water-accommodated fractions (WAFs) of Iranian crude oil. Comp Biochem Phys C 157:172–182. http://dx.doi.org/10.1016/j.cbpc.2012.11.003
Lee K, Boufadel M, Chen B, Foght J, Hodson P, Swanson S, Venosa A. 2015. The Royal Society of Canada Expert Panel: The behaviour and environmental impacts of crude oil released into aqueous environments. Retrieved from https://rsc-src.ca/sites/default/files/images/OIW_Dettman Consultation.pdf
Lin H, Morandi GD, Brown RS, Snieckus V, Rantanen T, Jørgensen KB, Hodson PV. 2015. Quantitative structure – activity relationships for chronic toxicity of alkyl-chrysenes and alkyl-benz[a]anthracenes to Japanese medaka embryos (Oryzias latipes). Aquat Toxicol 159:109–118. https://doi.org/10.1016/j.aquatox.2014.11.027
Lin F, Osachoff HL, Kennedy CJ. 2020. Physiological disturbances in juvenile sockeye salmon (Oncorhynchus nerka) exposed to the water-soluble fraction of diluted bitumen. Aquat Toxicol 220:1–13. doi:10.1016/j.aquatox.2019.105383
Loock H-P, Wentzell PD. 2012. Detection limits of chemical sensors: Applications and misapplications. Sensor Actuat B-Chem 173: 157–163.
http://dx.doi.org/10.1016/j.snb.2012.06.071
Madison BN, Hodson PV, Langlois VS. 2015. Diluted bitumen causes deformities and molecular responses indicative of oxidative stress in Japanese medaka embryos. Aquat Toxicol 165:222–230. http://doi.org/10.1016/j.aquatox.2015.06.006
Acc
ep
ted
Art
icle
Madison BN, Hodson PV, Langlois VS. 2017. Cold Lake Blend diluted bitumen toxicity to the early development of Japanese medaka. Environ Pollut 225:579–586.
https://doi.org/10.1016/j.envpol.2017.03.025
Martin JD, Adams J, Hollebone B, King T, Brown RS, Hodson PV. 2014. Chronic toxicity of heavy fuel oils to fish embryos using multiple exposure scenarios. Environ Toxicol Chem 33(3):677–687. http://doi.org/10.1002/etc.2486
Marty, G. D., Heintz, R. A., & Hinton, D. E. (1997). Histology and teratology of pink salmon larvae near the time of emergence from gravel substrate in the laboratory. Canadian Journal of Zoology 75(6):978–988. http://doi.org/10.1139/z97-119
McDonnell D, Madison BN, Baillon L, Wallace SJ, Brown SR, Hodson PV, Langlois VS. 2019. Comparative toxicity of two diluted bitumens to developing yellow perch (Perca flavescens). Sci Total Environ 655:977–985.
https://doi.org/10.1016/j.scitotenv.2018.11.199
National Academies of Sciences, Engineering, and Medicine (NAS). 2016. Spills of Diluted Bitumen from Pipelines: A comparative study of environmental fate, effects, and response. Washington, DC: The National Academies Press.
National Research Council (NRC). 2005. Understanding oil spill dispersants: efficacy and effects. The National Academies Press, Washington, D.C. 400 p.
Olsson, G. 2012. Water and energy: threats and opportunities. International Water Association London, London, p 293
Acc
ep
ted
Art
icle
Pan Z, Zhao L, Boufadel MC, King T, Robinson B, Conmy R, Lee K. 2017. Impact of mixing time and energy on the dispersion effectiveness and droplets size of oil. Chemosphere 166:246–254. https://doi.org/10.1016/j.chemosphere.2016.09.052
Philibert DA, Philibert CP, Lewis C, Tierney K. 2016. A comparison of diluted bitumen (dilbit) and conventional crude oil toxicity to developing zebrafish. Environ Sci Technol 50(11):6091–6098. http://doi.org/10.1021/acs.est.6b00949
Pierron F, Baillon L, Sow M, Gotreau S, Gonzalez P. 2014. Effect of low-dose cadmium exposure on DNA methylation in the endangered European eel. Environ Sci Technol 48(1):797–803. https://pubs.acs.org/doi/10.1021/es4048347
Redman AD, Butler JD, Letinski DJ, Di Toro DM, Leon Paumen M, Parkerton TF. 2018. Technical basis for using passive sampling as a biomimetic extraction procedure to assess bioavailability and predict toxicity of petroleum substances. Chemosphere 199:585–594. https://doi.org/10.1016/j.chemosphere.2018.02.024
Schein A, Scott JA, Mos L, Hodson PV. 2009. Oil dispersion increases the apparent bioavailability and toxicity of diesel to rainbow trout (Oncorhynchus mykiss). Environ Toxicol Chem 28(3):595–602. https://doi.org/10.1897/08-315.1
Theron M, Bado-Nilles A, Beuvard C, Danion M, Dussauze M, Ollivier H, Pichavant-Rafini K, Quentel C, Le Floch S. 2014. Chemical dispersion of crude oil:
Assessment of physiological, immune, and antioxidant systems in juvenile turbot (Scophthalmus maximus). Water Air Soil Pollut 225:1–17.
Acc
ep
ted
Art
icle
Turcotte D, Akhtar P, Bowerman M, Kiparissis Y, Brown RS, Hodson PV. 2011. Measuring the toxicity of alkyl-phenanthrenes to early life stages of medaka (Oryzias latipes) using partition-controlled delivery. Environ Toxicol Chem 30(2):487–495. https://doi.org/10.1002/etc.404
Vandegehuchte M, Janssen C. 2011. Epigenetics and its implications for ecotoxicology. Ecotoxicology 20(3):607−624. https://doi.org/10.1007/s10646-011-0634-0
Wolf K. 1957. Experimental induction of blue-sac disease. Trans Am Fish Soc 86(1): 61– 70. https://doi.org/10.1577/1548-8659(1956)86[61:EIOBD]2.0.CO;2
Wu D, Wang Z, Hollebone B, McIntosh S, King T, Hodson PV. 2012. Comparative toxicity of four chemically dispersed and undispersed crude oils to rainbow trout embryos. Environ Toxicol Chem 31(4):754–765. https://doi.org/10.1002/etc.1739
Zheng M, Ahuja M, Bhattacharya D, Clement TP, Hayworth JS, Dhanasekaran M. 2014. Evaluation of differential cytotoxic effects of the oil spill dispersant Corexit 9500. Life Sci 95:108–117. http://dx.doi.org/10.1016/j.lfs.2013.12.010
Acc
ep
ted
Art
icle
Figure 1. Mean concentrations of total petroleum hydrocarbons measured by
fluorescence (TPH-F) in water samples collected daily from test solutions containing chemically-dispersed Access Western Blend (AWB; open circles) and Cold Lake Blend (CLB; closed circles). The TPH-F concentrations were not corrected to water controls. Symbols representing data from Experiment 1 (E1) are black and data from Experiment 2 (E2) are blue. Vertical error bars are the standard error of the mean (n = 20-23 AWB E1; n = 20-23 CLB E1; n = 11-24 AWB E2; and n = 9-23 CLB E2). The method limit of detection (LOD) was 41 and 47 µg/L for water samples in E1 for AWB and CLB respectively (horizontal dotted lines). The LOD is equivalent to 0.0038% v/v nominal loading for AWB and 0.0043% v/v nominal loading for CLB. Data above the LOD for both oils in both experiments fit a single log-log-linear regression.
Acc
ep
ted
Art
icle
Figure 2. Cumulative percent mortality (A), BSD severity index (B), and percent
affected (C) of rainbow trout alevins exposed to chemically-dispersed Access Western Blend (AWB; open circles) and Cold Lake Blend (CLB; solid circles). Toxicity was reported against nominal loading (% v/v; A). Symbols representing data from Experiment 1 (E1) are black and data from Experiment 2 (E2) are blue.
Acc
ep
ted
Art
icle
Figure 3. Panel A: Cumulative percent mortality of rainbow trout alevins exposed to
negative controls for Experiment 1 (E1) and Experiment 2 (E2). The negative controls were water, 100 µg/L methanol, 0.17% v/v Nujol, and 1% v/v Nujol water
accommodated fraction (WAF).
Panel B: Cumulative percent mortality of rainbow trout alevins exposed to dispersant and positive controls for Experiment 1 (E1) and Experiment 2 (E2). Toxicity was expressed as concentration measured by fluorescence spectroscopy (FS; µg/L). The dispersant controls were dilutions of dispersant (Corexit 9500) and chemically dispersed Nujol (Nujol chemically enhanced water accommodated fraction; Nujol CEWAF). The positive control was 100 µg/L retene.
Panel C: Cumulative percent mortality of rainbow trout alevins exposed to chemically-dispersed Access Western Blend (AWB; open circles) and Cold Lake Blend (CLB; solid circles). Symbols representing data from Experiment 1 (E1) are black and data from Experiment 2 (E2) are blue.