HAL Id: hprints-00326097
https://hal-hprints.archives-ouvertes.fr/hprints-00326097
Submitted on 1 Oct 2008HAL is a multi-disciplinary open access archive for the deposit and dissemination of sci-entific research documents, whether they are pub-lished or not. The documents may come from teaching and research institutions in France or abroad, or from public or private research centers.
L’archive ouverte pluridisciplinaire HAL, est destinée au dépôt et à la diffusion de documents scientifiques de niveau recherche, publiés ou non, émanant des établissements d’enseignement et de recherche français ou étrangers, des laboratoires publics ou privés.
To cite this version:
Tove Faber Frandsen. On the ratio of citable versus non-citable items in economics journals. Sciento-metrics, Springer Verlag, 2008, 74 (3), pp.439-451. �hprints-00326097�
On the ratio of citable versus non-citable items in economics journals Tove Faber Frandsen1
Royal School of Library and Information Science Birketinget 6, Copenhagen S. Denmark
Abstract
This paper presents a study of possible changes in patterns of document types in economics journals since the mid-1980s. Furthermore, the study includes an analysis of a possible relation between the profile of a journal concerning composition of document types and factors such as place of publication and JIF. The results provide little evidence that the journal editors have succeeded in manipulating the distribution of document types. Furthermore, there is little support for the hypothesis that journal editors decrease the number of publications included in the calculation of JIF or for that matter for the hypothesis that journal editors increase the number of publications not included in the calculation of JIF. The results of the analyses show that there is a clear distinction of journals based on place of publication and JIF.
Introduction
The ratio of source items (citable items) in a journal versus the non-source items (non-citable ones) is an important factor in the determination of a journal’s impact factor. Yet, if the terms ‘citable’ and ‘non-citable’ were correct this ratio would have no influence at all on a journal’s impact factor. In reality, however, a considerable amount of these so-called non-citable items are cited, some even to a large extent.
1 The author is grateful to Ronald Rousseau for his valuable comments to improve this
FRANDSEN &ROUSSEAU (2005) offer formulations of JIF for the general case and it
is evident that JIF is a decreasing function of the number of publications in the publication window. This means that if the number of publications decreases in one particular year (included in the publication window), and all other data stay the same, then the impact factor increases too.
This way of increasing the JIF is due to two aspects: The first relates to the inclusion of some document types in the numerator and others in the denominator. In the numerator of the JIF, ISI counts citations to all types of documents published in a journal, whereas in the denominator it includes only the number of articles, notes, and reviews. However, other document types such as editorials and letters are frequently cited. These types contribute to the JIF’s numerator, but are not included in the denominator. This means that citations to non-citable items are, in a sense, for free (MOED & VAN LEEUWEN,
1995). Journals may have their impact factors inflated by up to 75 per cent due to editorials and correspondence sections (MOED et al, 1996). Due to the indexing policy of the citation indexes it is practically impossible to exclude them in the numerator. An alternative would be to include all document types in the denominator although also highly problematic.
The second aspect is related to the way publications qualify to be source items or citable units. According to ISI all full articles – original and review – are counted as source items. In addition, any shorter item with full author information and abstract may be counted, especially if cited references are included. Thus, in some instances, technical notes qualify as source items as may case notes. Editorials and commentaries are not counted as source items, nor are meetings abstracts. Letters are typically not counted; however there are room for exception in cases where they function as “articles” within a journal. Supplements are somewhat more problematic and are treated on a case-by-case basis (O’NEILL, 2000). As we can see it is a matter of subjective
obvious. GISVOLD (1999) gives examples of journals being punished for publishing
a large number of documents not likely to be cited that is classified as source items by ISI. Table 1 provides an overview of publications recognized by ISI (ISI CITATION DATABASES HELP, 2006).
Table 1. ISI Document types in citation databases Art Exhibit Review
Article Bibliography Biographical-Item Book Review Chronology Correction, Addition
Dance Performance Review Database Review
Discussion Editorial Excerpt
Fiction, Creative Prose Film Review
Hardware Review
Item About An Individual Letter
Meeting Abstract
Music Performance Review Music Score
Music Score Review News Item
Poetry Press Digest Record Review Reprint Review, Bibliography Script Software Review Theater Review
TV Review, Radio Review, Video Review
Another aspect is that JIF does not take into account the composition of a journal in terms of the percentages of articles, notes, and reviews. As a result, journals containing a high proportion of review articles tend to have higher JIFs than other journals which GARFIELD (1996) also notes. VAN LEEUWEN et al (1999) recommends each document type being treated separately to take into account that document types are not cited the same.
Empirical work shows that the denominator in the JIF equation can be manipulated by editors by increasing the total number of documents published each year in the journal preferably by increasing the number of documents not included in the ISI calculation of JIF (Frandsen, 2007).
Research question
The main goal of this article is to identify changing patterns of document types in economics journals since the mid-1980s. Furthermore we want to investigate if there is a relation between the profile of a journal concerning composition of document types, geographical location and JIF.
The analysis in the present paper is based on a selection of 32 economics journals. Preliminary searches conducted before the start of the actual analysis showed that before the mid-1980s the number of observations in the data material is too small so the initial publication period used in the analysis is 1984.
The development in document types will be analysed over time in order to show whether or not the journals are publishing more or less of the document types that can affect the calculation of JIF either in the denominator or the nominator. First of all we analyse whether the various document types are distributed randomly and secondly we analyse if the number of publications not included in the ISI calculation is increasing or decreasing.
The estimation equation we use is as follows:
Number of documents not included in the ISI calculation of JIFi,t = β0 + βi,t + u
i,t denotes the given time period, t, in the journal, i. β0 denotes the constant
u denotes the error term. Methods
We analyse a set of economics journals using the Social Sciences Citation Index (SSCI). An overview of the journals is available in appendix 1. We start out with the time which is capturing a possible development over time. The starting year (1984) is given the value of 1 and the next year 2 and so forth.
We study the development over time in the document composition of all journals. We register the composition of every document type each year by using the following search string in DIALOG:
S jn=economica; rank dt
The documents are divided into seven categories namely: Article, review, letter, note, editorial, book review and other. The categories consist of just the document type indicated in the category label. Publications not included in the first six categories are brought together in the seventh category named other. These documents have been aggregated in this category as there are so few of them and the use of them varies considerably over the years.
In order to be able to divide the journals in top two on the basis of JIF we calculate JIFs for all the journals throughout the entire period. We calculate two synchronous JIFs. One is calculated as done by the ISI and one also including the document type letter in the denominator as recommended by Christensen et al (1997). Furthermore we calculate two diachronous JIFs, one with a 3-year citation period and one with a 5-year citation period. Garfield (1998), Moed, Van Leeuwen and Reedjijk (1999) and Stegmann (1999) find small variations between various lengths of citation windows of JIFs within disciplines and thus we use linear regression analyses to evaluate the correlation between all the four various JIFs to determine if it is adequate to use only one formulation in the subsequent analyses. All the variations of JIF are highly correlated. The linear regressions provide p-values for all combinations < 0.001 and Pearson’s r2 ranging from 0.83 to 0.99 which indicate that we are able to
explain 83 to 99 per cent of the variance in the data set. Thus we only report the results of the analysis using the diachronous JIFs with the 3-year citation period.
The analysis below consists of different statistical analyses of the data material. Linear regression analysis of the statistical relations between the dependent and the independent variable gives information on statistically significant relations. Furthermore, we are given the slope coefficients and a
p-value for the linear relationship. Pearson’s r2 reveals information about the
degree of correlation between the dependent and the independent variable. The analyses have been done in Microsoft Excel and SPSS.
Results
We are mainly interested in knowing if the share of publications included and not included in the definition of the ISI JIF is randomly distributed over the years. Particularly we wish to investigate if the share of documents included in the calculation of the ISI JIF has a clear trend over the investigated period: increasing or decreasing. The data do not exhibit a rising number of average total publications a year per journal. The number is relatively stable and ranges from 76 to 89 with an average of 82 total publications a year per journal as can be seen in table 2.
Table 2. The average number of publications a year per journal Year Average total documents
1984 81 1985 84 1986 83 1987 81 1988 85 1989 84 1990 86 1991 89 1992 88 1993 80 1994 82
1995 81 1996 82 1997 82 1998 81 1999 76 2000 79 2001 79 2002 78
Furthermore the distribution of document types does not indicate a clear pattern of reducing the publications included in the calculation and raising the number not included. This is illustrated in figure 1 showing the average shares of document types included and excluded in the calculation of JIF by ISI in a given journal each year. For the matter of preserving an overview we merge the seven different document types into two types and we can see the development year by year from 1984 to 2002.
0 10 20 30 40 50 60 70 80 90 100 1984 1985 1986 1987 1988 1989 1990 1991 1992 1993 1994 1995 1996 1997 1998 1999 2000 2001 2002 Year S h ar e of publ ic a ti ons i n a j our na l Included Excluded
Figure 1. The share of publications included and not included in the calculation of JIF.
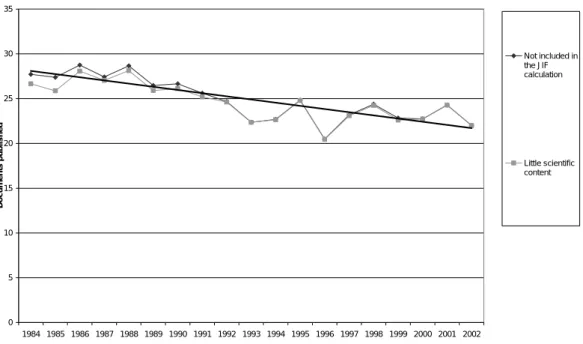
The share of publications included in the calculation of JIF seems to be slightly rising which is primarily due to the considerable rise in the number of articles (as can be seen in appendix 2). This tendency is however somewhat levelled out by the fall in the number of notes which falls from a stable average the first 10 years of 5 every year to null. The number of publications not included in the calculation shows a clearer tendency towards a decrease. It is evident in figure 1 that the share of publications not included in the ISI calculation of JIF is decreasing and the share of publications included in the calculation is increasing. To extend the point we also show that these tendencies are the same if we create two new but very similar categories of document types containing a higher degree of scientific content which includes articles, reviews, letters and notes and a category containing less scientific content which includes book reviews, editorials and other document types. Basically this means that we use the same two groups as before we just move the document type letter as CHRISTENSEN,INGWERSEN AND WORMELL (1997) recommend
including letters to assure a more detailed picture. In figure 2 these two types are depicted and we have added a tendency line to the former type.
0 5 10 15 20 25 30 35 1984 1985 1986 1987 1988 1989 1990 1991 1992 1993 1994 1995 1996 1997 1998 1999 2000 2001 2002 Year Doc u ment s publ is h e d Not included in the JIF calculation Little scientific content
Figure 2. Excluded from the JIF-calculation and little scientific content.
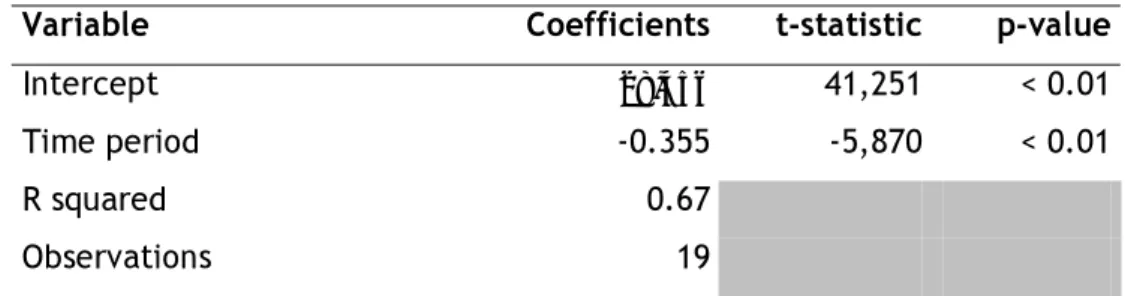
These tendencies are statistically significant as shown in table 3 which is a transcript of the outcome of the linear regression. The dependent variable is number of publication not included in the calculation of the ISI JIF. The independent variable is year. The result is presented as an overview of the selected variables, a model summary that gives a summary of the fit of the model, ANOVA that analyses the variance, regression coefficients. The outcome can be seen in appendix 2. Some of the central information in the outcome is the R square of the model that summarises the fit of the model. In this case the R square of the model is 0.705, which is a good fit and thus we are able to explain 70.5 per cent of the variance in the data set. This is also confirmed in the analysis-of-variance tables, which for both models show that the means of the predictors are not significantly different at the 0.01 significance level. Other important information is held in the tables of regression coefficients. Estimates displays regression coefficient B, t value for B, and two-tailed significance level of t.
Table 3. Univariate linear regression analysis. Dependent variable is the share of publications not included in the calculation of the ISI-JIF.
Variable Coefficients t-statistic p-value
Intercept 28,456 41,251 < 0.01
Time period -0.355 -5,870 < 0.01
R squared 0.67
Observations 19
In table 3 we see that we can interpret the coefficients as the change in the share of publications not included in the calculation of the ISI-JIF if the characteristic changes by one unit. The coefficient -0.355 to time period shows that if 10 years pass by, it will all other things equal imply publishing a share of publications not included in the calculation of the ISI-JIF that is 3.55 percentage points smaller.
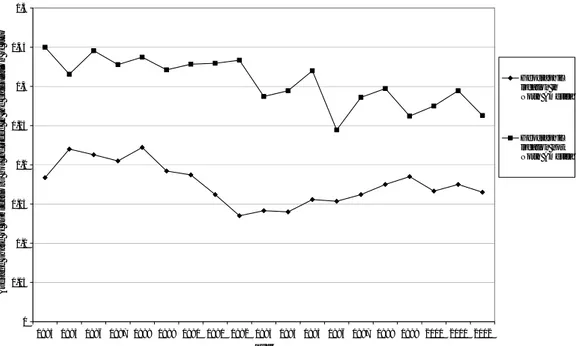
We can detect geographical differences in the distribution of document types as shown in figure 3. Figure 3 illustrates the differences in the share of documents not included in calculation of JIF for journals located in North America and for journals located outside North America. This splitting up of journals has been constructed by determining the geographic location of each journal, i.e. their place of publication which is done by using Ulrich´s international periodicals directory. Ulrich’s provide a formal representation of journals and thus some journals may be located elsewhere in reality. But as it is tedious and almost impossible to establish a certain geographic location we use the information provided by Ulrich´s.
0 0,05 0,1 0,15 0,2 0,25 0,3 0,35 0,4 1984 1985 1986 1987 1988 1989 1990 1991 1992 1993 1994 1995 1996 1997 1998 1999 2000 2001 2002 Year Av er a g e s h a re of publ ic a ti ons not i n cl ude d i n t h e c a lc ul ati on of J IF Geographic location in North America Geographic location not North America
Figure 3. Share of documents not included in calculation of JIF for journals located in North America and for journals located outside North America.
In figure 3 we can clearly see the difference in the average share of documents not included in the calculation of JIF. Throughout the entire period the journals located in North America has an average share of 18 per cent whereas the journals not located in North America has a share of 31 per cent. This difference could be due to different publication traditions which would imply that North American journals have a tradition for publishing relatively fewer documents of the types not included in the calculation of JIF. Furthermore we can see that the North American journals seem to have an increasing share if we only look at the last 10 years. This tendency is statistical significant as a linear regression only including data from 1993 to 2002 is significant at the 0.01 significance level. R square of the model is 0.605, which is a relatively good fit. The coefficient of 0.00375 is to be under stood as: in a 10-year period the share of not included documents in the calculation of JIF increases with 0.0375 which is the same as 3.75 percentage points.
Another interesting division is between the top half of the journals and the low half measured by JIF. The division is made on the basis of the average JIF throughout the period.
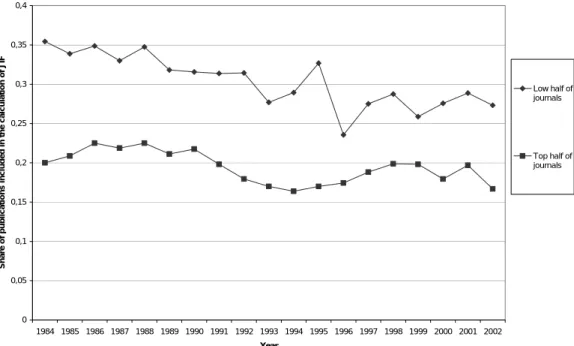
0 0,05 0,1 0,15 0,2 0,25 0,3 0,35 0,4 1984 1985 1986 1987 1988 1989 1990 1991 1992 1993 1994 1995 1996 1997 1998 1999 2000 2001 2002 Year S h a re of publ ic a ti ons i n c luded i n the ca lc ul at ion o f JI F Low half of journals Top half of journals
Figure 4. Share of documents not included in calculation of JIF for journals with the highest and the lowest average JIF.
The picture in figure 4 is very similar to the picture depicted in figure 3 although this time we separate by using JIF instead of geographic location. The top half of the journals in the data set measured by JIF has a considerably lower share of documents not included in the calculation of JIF than the lowest half of the journals. The former has an average of about 20 per cent whereas the latter has an average of about 30 per cent throughout the entire period. Again we see that the last 10 years the top half of journals does not show a clear tendency to a decrease. However, this is not statistically significant when we extract the data from the last 10 years.
The distinctions can also be investigated statistically. Table II is an overview of four linear regressions.
Table 4. Univariate linear regression analyses of share of not included documents in the calculation of JIF and independent variable is the time variable.
Type of division Journals R square Coefficient P-value Geographical North American journals 0.29 -0.00252 < 0.01
Not North American journals 0.64 -0.00437 < 0.01 JIF Top half of journals 0.38 -0.00221 < 0.01 Low half of journals 0.67 -0.00488 < 0.01 As we can see in table 4 the slope for the journals not from North America is considerably higher than that of the journals from North America. The coefficient -0.0043 is to be under stood like this: in a 10-year period the share of not included documents in the calculation of JIF decreases with 0.0437 which is the same as 4.37 percentage points. The decrease for the North American journals is only 0.0252 or 2.52 percentage points. This implies that overall development towards a lower share of documents not included in the calculation of JIF is largely due to the changed document composition of the non-North American journals.
The division of journals made on the basis of JIF show that the slope of the lower half of the journals is more than twice as large as that of the top half. The top half on average decreases its share by 2.21 percentage points whereas the lower half decreases its share by 4.88 percentage points. Again the overall development towards a lower share of documents not included in the calculation of JIF is largely due to the changed document composition of the lower half of the journals measured by JIF.
We also note that the R squares are considerably lower of the North American journals and the top half of journals measured by JIF which is due to the development in the last 10 years.
Discussion and conclusions
The definition of JIF opens up to various ways of manipulating the value. There are indeed cases of editors trying to manipulate the JIF by changing the composition of document types. SEVINC (2004) reported that a manuscript
submitted to a rheumatology journal was returned by the editor proposing to resubmit it as a letter. Basically it is a matter of increasing the number in the numerator or decreasing the number in the denominator. KALTENBORN & KUHN
(2004) refer to the phenomenon as IF-doping. Manipulating the denominator also includes being aware of diminishing the share of documents containing scientific content. It seems that this is a dangerous tactic as it reduces a journal’s scientific value, and hence may lead, especially in a very competitive market, to a reduction in the number of journal subscriptions.
On the basis of these analyses of the distribution of document types in economics journals we cannot find statistical significant evidence that the journal editors have succeeded in manipulating the distribution of document types. We find no support for the hypothesis that journal editors decrease the number of publications included in the calculation of JIF by ISI or for that matter for the hypothesis that journal editors increase the number of publications not included in the calculation of JIF by ISI. On the contrary we find a slight tendency to a general increase in the total number of documents published each year caused by an increase in the document types that is included in the calculation of JIF.
Furthermore we can conclude on the basis of these analyses that there is a clear distinction between journals located in North America North and journals
located outside North America when it comes to the share of published material not included in the calculation of the ISI JIF. We further see a clear distinction between the top half and the lower half (according to impact factor) of the journals.
This investigation only includes 32 economic journals. It would be interesting to study a larger group of journals including many fields.
Literature
CHRISTENSEN, F. H.; INGWERSEN, P., WORMELL, I. (1997). Online determination of the journal impact factor and its international properties. Scientometrics, 40(3),529-540.
FRANDSEN, T.F. (2007). Self-citations: analysing the JIF mechanism. Journal of
Informetrics, 1(1), 47-58.
FRANDSEN, T. F.& ROUSSEAU, R. (2005). Article impact calculated over arbitrary periods. Journal of the American Society of Information Science & Technology, 56(1), 58-62.
GARFIELD, E. (1996) How can impact factors be improved? British Medical Journal, 313(7054), 411-413.
Garfield, E. (1998). Long-term vs. short-term journal impacts: does it matter? The Scientist, 12(3); 10-12.
GISVOLD, S.-E. (1999). Citation analysis and journal impact factors. Is the tail
wagging the dog? Acta Anaesthesiologica Scandinavia, 43, 971-973.
ISI CITATION DATABASES HELP (2006). http://wos.ekt.gr/help/helpdefs.html
MOED,H.F.&VAN LEEUWEN,T.N. (1995). Improving the accuracy of Institute for
Scientific Information’s journal impact factors. Journal of the American Society for Information Science (JASIS) 46: 461-467, 1995.
MOED, H. F.; VAN LEEUWEN, T. N. &REEDIJK, J. (1996). A critical analysis of the
journal impact factors of Angewandte Chemie and The Journal of the American Chemical Society: Inaccuracies in published impact factors based on overall citations only. Scientometrics, 37, 105-116.
Moed, H. F.; Van Leeuwen, T. N. & Reedijk, J. (1999). Towards appropriate indicators of journal impact. Scientometrics, 46, 575-589.
O’NEILL, J. (2000). The significance of an impact factor: implications for the
publishing community. Learned Publishing, 13(2), 105-109.
SEVINC, A. (2004). Manipulating impact factor. An unethical issue or an editor’s
choice? Swiss Medical Weekly. 134, 410.
Stegmann, J. (1999). Building a list of journals with constructed impact factors. Journal of Documentation 55(3), 310-324.
VAN LEEUWEN, T. N.; MOED, H. F. & REEDIJK, J. (1999). Critical comments on Institute for Scientific Information impact factors: a sample of inorganic molecular chemistry journals. Journal Information Science, 25: 489-498.
Appendix 1. Journals included in the study
1 American Economic Review
2 American Journal of Economics and Sociology 3 Brookings Papers on Economic Activity
4 Bulletin of Indonesian Economic Studies 5 Cambridge Journal of Economics
6 Desarollo Economico – Revista de Ciencas Sociales 7 Developing Economies
8 Eastern European Economics 9 Econometrica 10 Economic History Review 11 Economic Journal 12 Economica
13 Economics Letters 14 Ekonomiska Samfundets Tidskrift 15 European Economic Review 16 Explorations in Economic History
17 International Economic Review 18 Jahrbücher Für Nationalökonomie und Statistik 19 Journal of Econometrics
20 Journal of Economic Issues 21 Journal of Economic Literature 22 Journal of Economic Theory 23 Journal of political Economy
24 Kyklos
25 Oxford Economic Papers 26 RAND Journal of Economics 27 Review of Economic Studies
28 Review of Economics and Statistics 29 Scandinavian Journal of Economics 30 South African Journal of Economics 31 World Development
32 World Economy
Appendix 2. The average number of publication a year
Review Letter Note Editorial Article
Book review Others 0,6 1,5 6,3 1,3 44,7 25,8 1,0 0,5 1,6 5,2 1,3 48,7 24,9 1,7 0,6 0,6 4,8 1,3 48,3 26,2 1,5 0,3 0,3 5,8 2,4 48,0 23,6 0,9 0,6 0,3 4,6 2,1 49,9 25,9 1,1 0,7 0,7 5,4 2,2 50,5 23,8 1,0 0,4 0,6 4,9 2,0 50,5 26,4 1,4 0,6 0,2 6,9 1,2 51,9 26,9 1,3 0,8 0,1 5,1 1,2 53,3 26,1 1,5 0,6 0,0 5,7 1,0 50,2 21,0 1,8 0,3 0,0 4,0 1,0 52,5 22,6 1,4 1,5 0,1 2,8 1,8 50,6 23,5 1,1 0,9 0,1 0,0 2,2 56,6 20,7 1,1 1,0 0,2 0,0 2,4 56,2 20,7 2,0 0,9 0,3 0,0 4,2 54,5 20,2 1,3 1,0 0,4 0,0 2,4 52,6 18,8 0,9 0,8 0,0 0,0 2,9 53,0 21,2 0,9
1,3 0,0 0,0 2,5 53,6 20,6 1,1 1,2 0,0 0,0 2,4 55,7 18,2 0,7